Sample Category Title
Weekly Wave Analysis EUR/USD, GBP/USD, USD/JPY
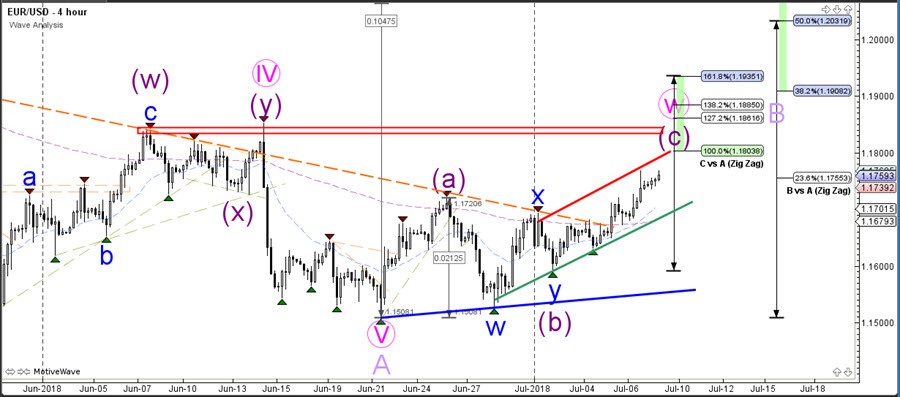
The EUR/USD is moving up higher and challenging the previous top (red box), which is a key support or resistance zone. This is probably part of a wave W (pink) within wave B (light purple) but it could also still be a wave 4 if price declines fast from the resistance zone. A bullish breakout could see price test the Fibonacci retracement levels of wave B (purple).
Daily chart:
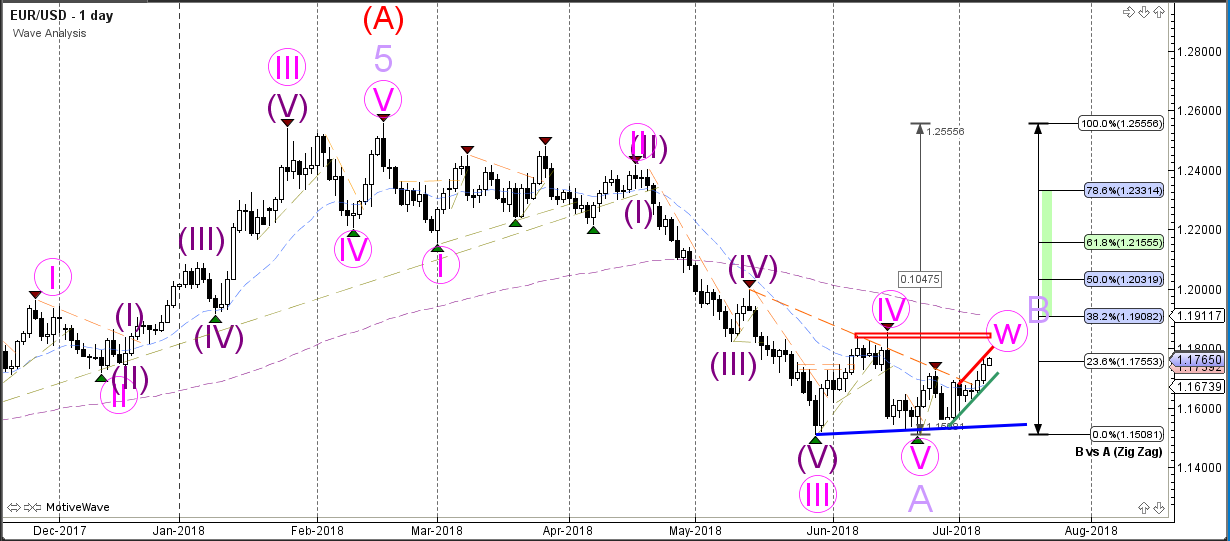
The EUR/USD seems to be building a bearish ABC (purple) correction within wave B (red).
Weekly chart:
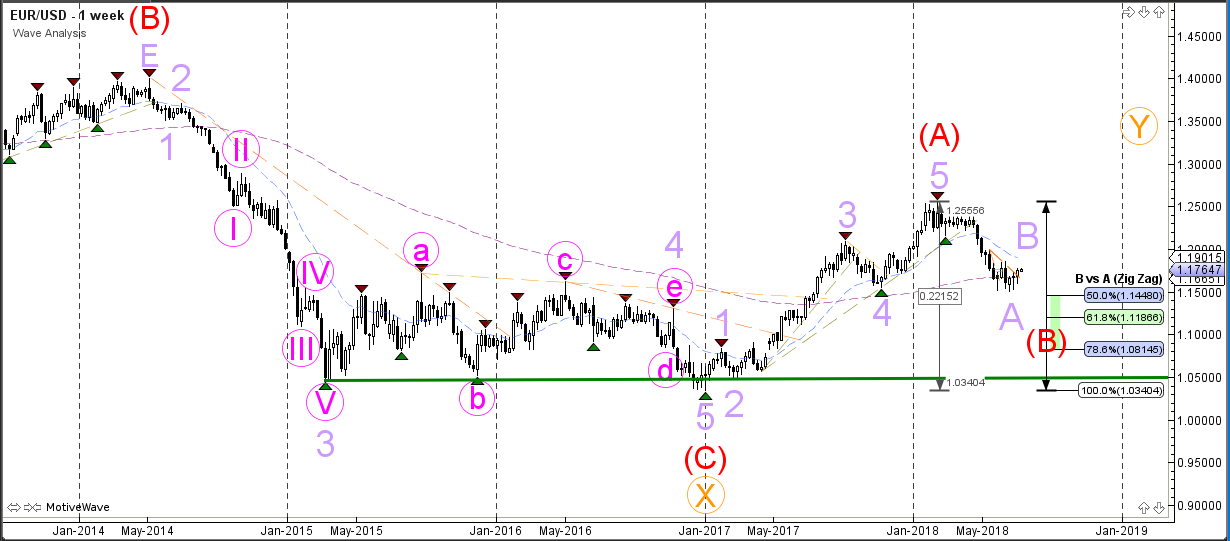
The EUR/USD has probably completed wave A (red) and price is now most likely retracing to the Fibonacci levels of wave B (red).
Monthly chart:
GBP/USD
The GBP/USD is moving up higher and challenging the resistance trend line of the downtrend channel (red). This is probably part of a wave W (purple) within wave 2 (pink).
Daily chart:
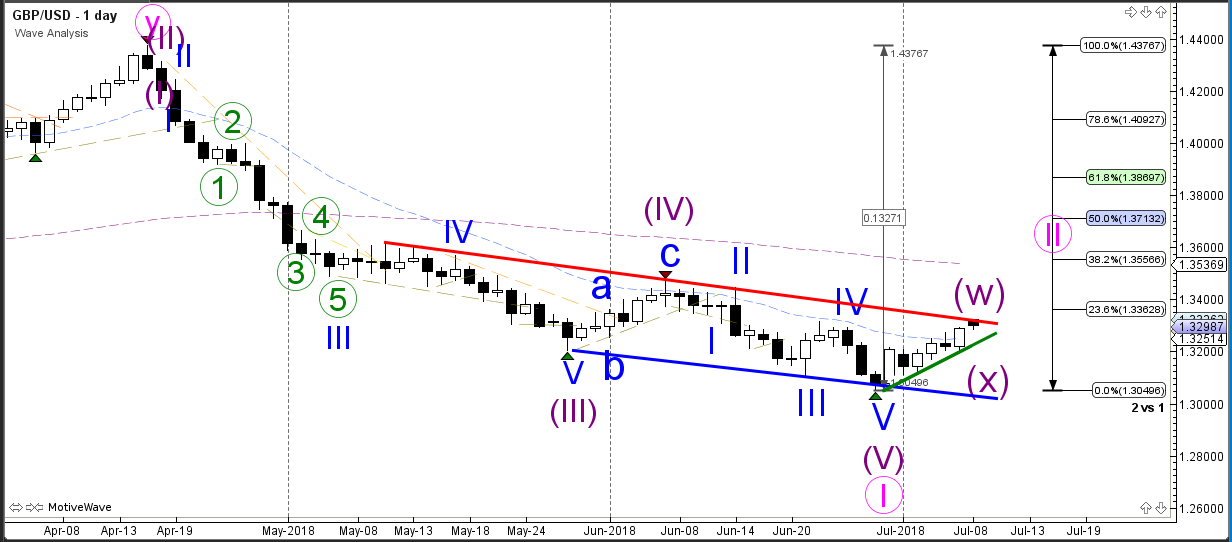
The GBP/USD has probably started the bearish wave 5 after price has completed a wave 4 (light purple) correction.
Weekly chart:
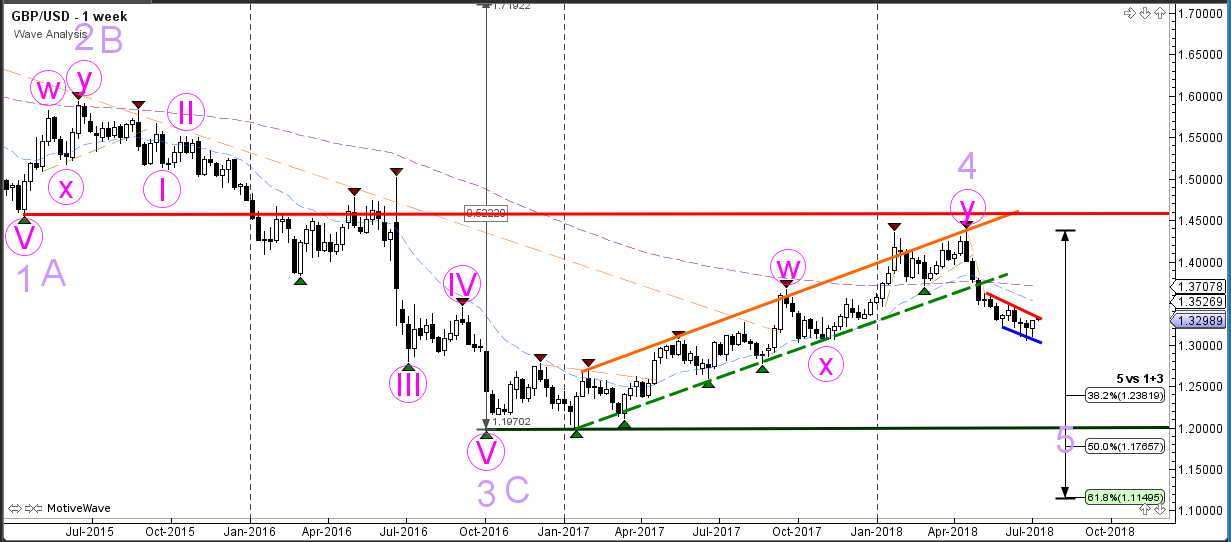
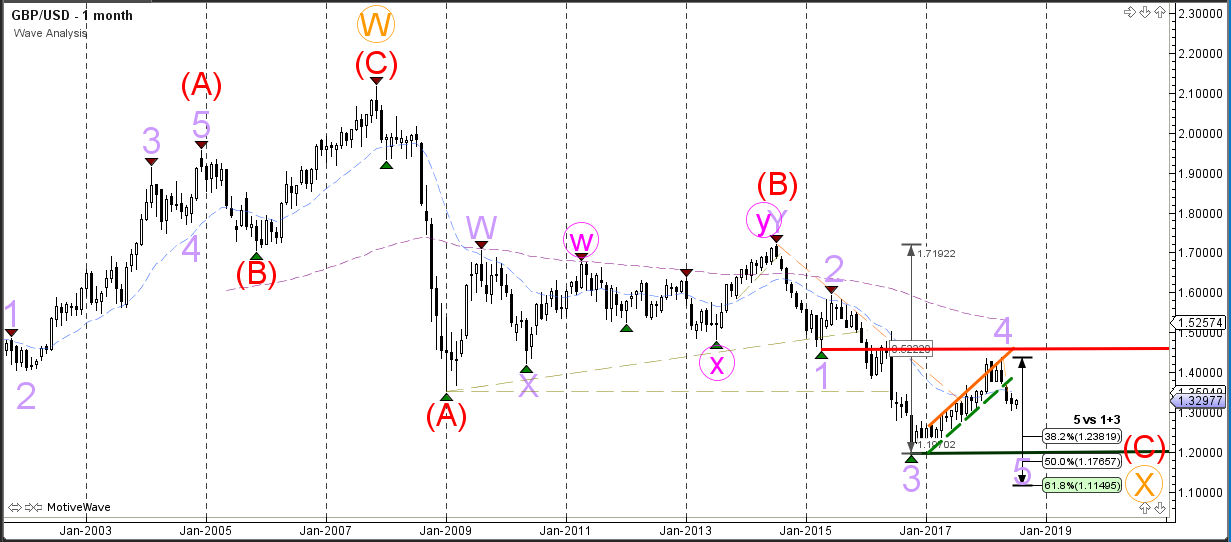
The GBP/USD bearish breakout could see the continuation of the wave 5 (purple) whereas a bullish break above resistance (red) could indicate that the wave C has been completed at the bottom.
Monthly chart:
USD/JPY
The USD/JPY is testing the resistance trend line (red) and a bullish breakout could see price rise towards the next Fibonacci levels. A bearish breakout below support could see price complete a larger correction within wave X (pink).
Daily chart:
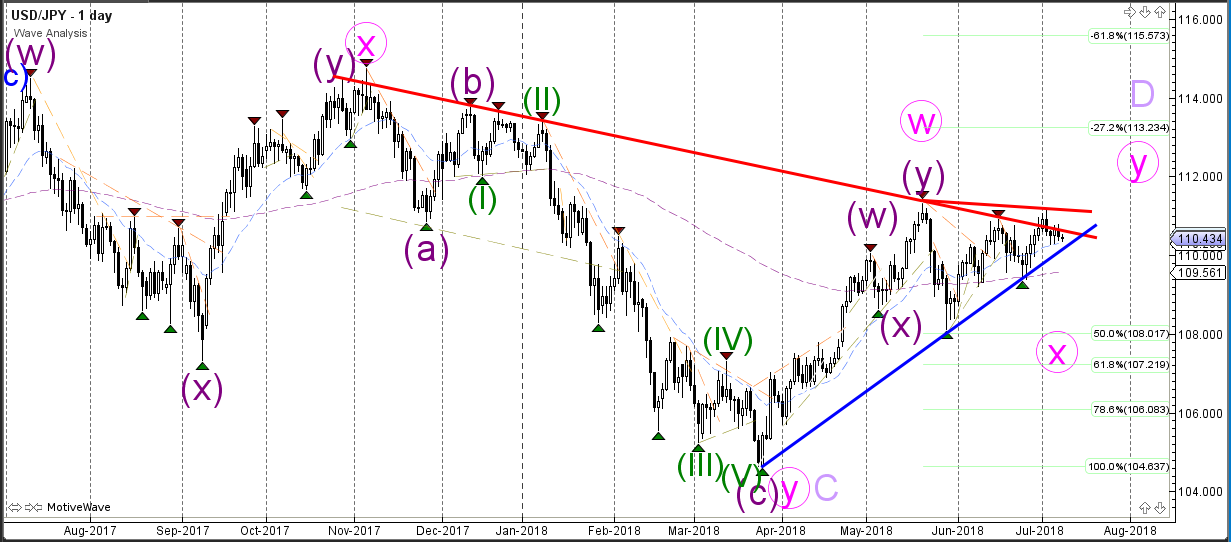
The USD/JPY could be building an ABCDE triangle (light purple) within wave B (red).
Weekly chart:
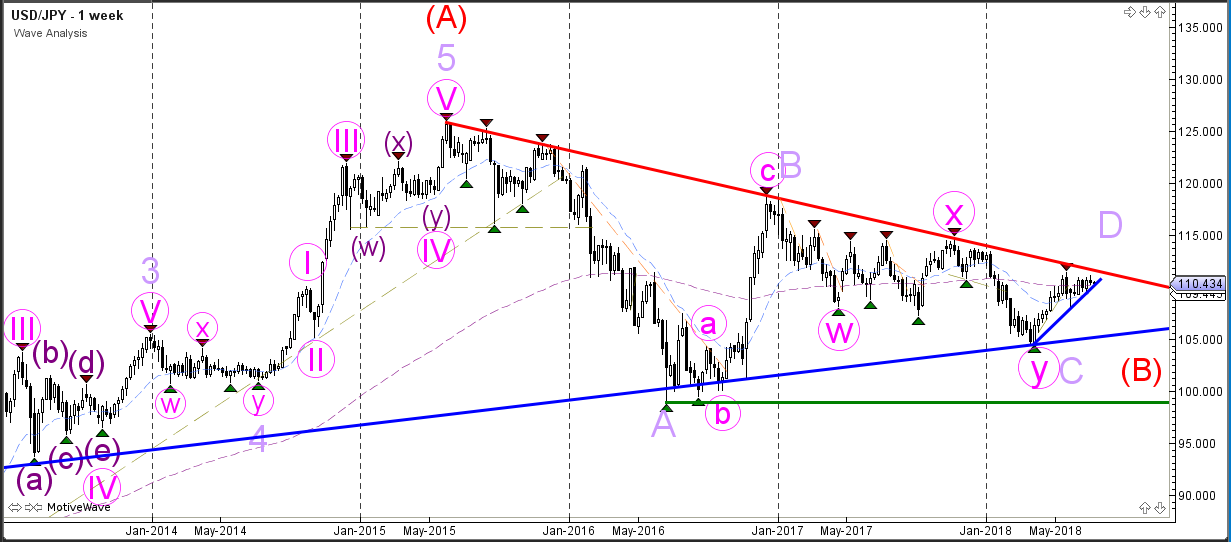
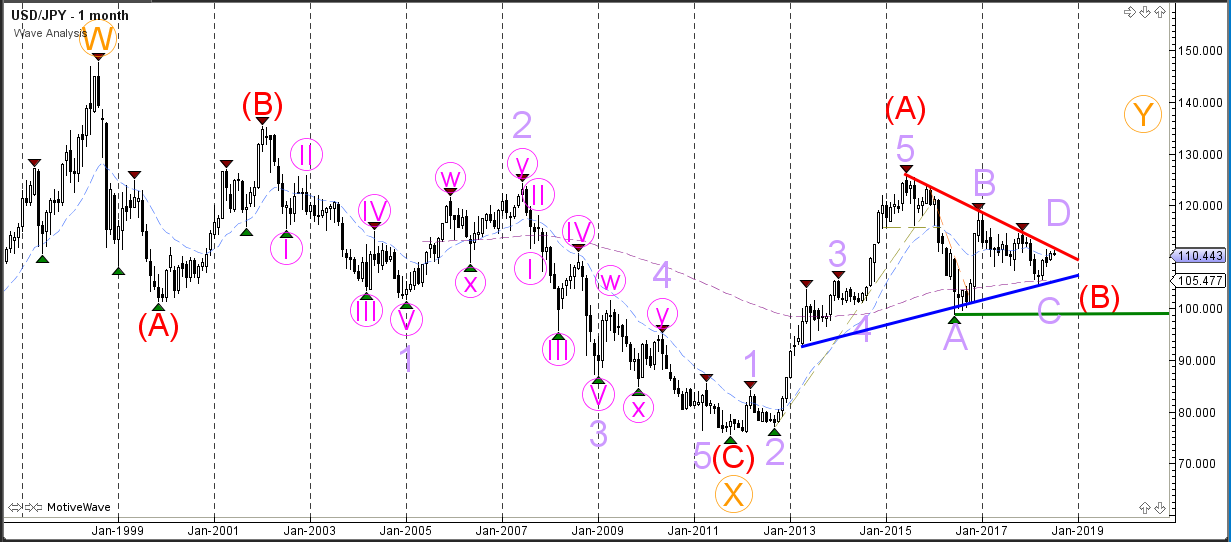
The USD/JPY is in the wave D (light purple) of the triangle pattern.
Monthly chart:
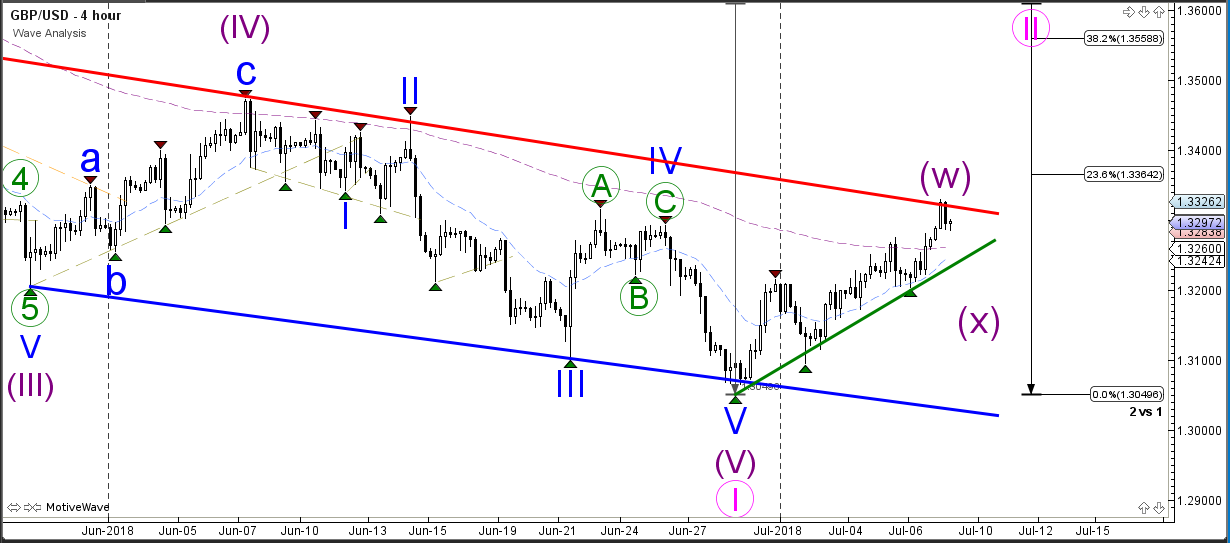
GBP/USD Approaches Channel Top And 23.6% Fib Resistance
The GBP/USD bullish correction has reached the top of the downtrend channel, which is a bounce or break zone. The GBP/USD could be in a larger bullish correction within a wave 2 (pink) if price manages to break above the bearish channel but then the 23.6% Fibonacci retracement level could be a bounce spot as well. A bearish breakout below support does not have to lead to a larger bearish continuation if the wave WXY (purple) pattern indeed unfolds as shown in the image.
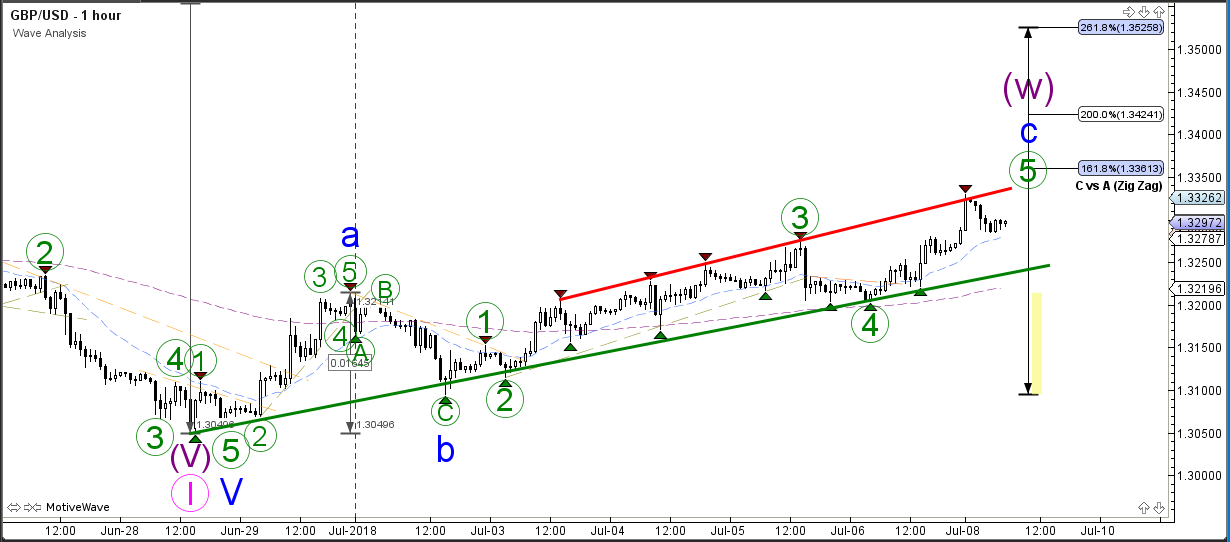
The GBP/USD is probably building a corrective wave 5 (green) within the minor bullish channel on this 1 hour chart.
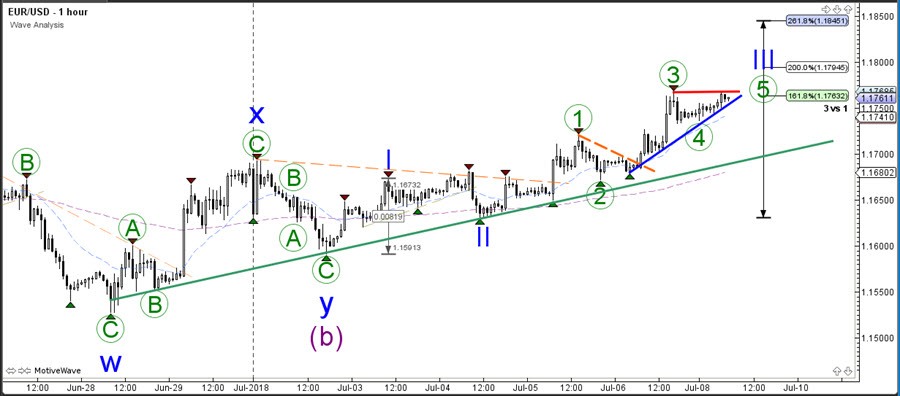
EUR/USD Ascending Wedge Chart Pattern Aims At 1.18-1.1850
The EUR/USD uptrend channel is now approaching the previous top and key resistance zone (red), which is a bounce or break zone.
The EUR/USD seems to be building a wave C (purple), which could complete a wave W (pink) if the wave patterns on the image are correct. A larger WXY corrective pattern could take place within wave B (light purple). A strong bearish reaction and fall could indicate that a wave 4 pattern was finished (not a wave W) and price could make one more decline within a wave 5 (pink).
The EUR/USD is building an ascending wedge chart pattern. A bullish breakout could send the pair towards the Fibonacci targets of wave 3 (blue). One more wave 4 and 5 (blue) are possible once price completes wave 3 (blue).
Euro Extends Its Gains In The Asian Session
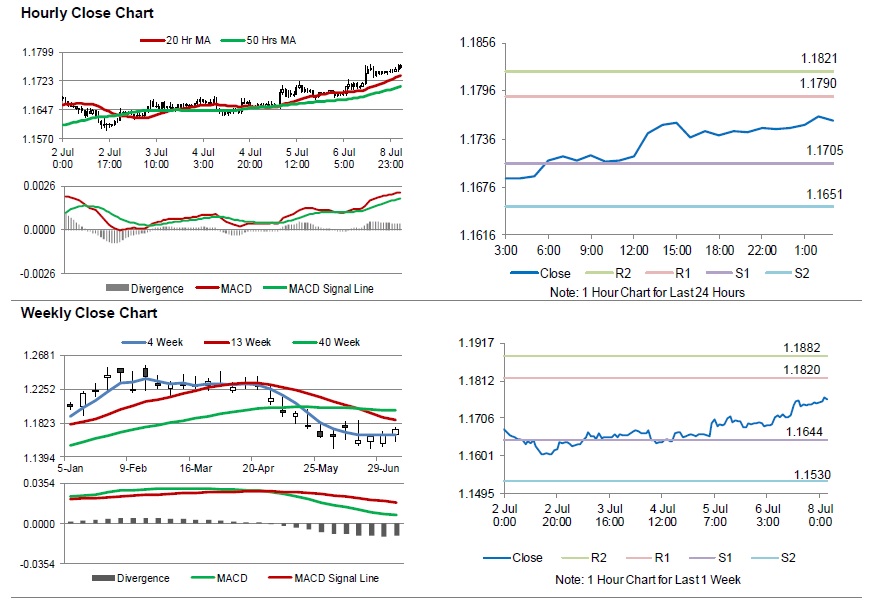
For the 24 hours to 23:00 GMT, the EUR rose 0.46% against the USD and closed at 1.1745 on Friday, after Germany's industrial output rose at a faster than expected pace in May.
On the data front, Germany's seasonally adjusted industrial production rebounded 2.6% on a monthly basis in May, higher than market expectations for a rise of 0.3%. In the previous month, industrial production had recorded a revised drop of 1.3%.
The US Dollar weakened against basket of currencies on Friday, following the rise in unemployment rate and slower wage growth.
Data showed that US unemployment rate unexpectedly rose to 4.0% in June, compared to a rate of 3.8% in the previous month. Market participants had anticipated unemployment rate to record a steady reading. Further, the nation's average hourly earnings of all employees rose by 0.2% on a monthly basis in June, undershooting market expectations for an advance of 0.3%. Average hourly earnings of all employees had advanced 0.3% in the preceding month. On the contrary, non-farm payrolls climbed by 213.0K in June, more than market expectations for an advance of 195.0K. Non-farm payrolls had registered a revised increase of 244.0K in the prior month. Additionally, trade deficit narrowed to a 19-month low level of $43.1 billion in May, amid growing fears of retaliatory tariffs and more than market expectations for a deficit of $43.6 billion. In the previous month, trade deficit had recorded a revised reading of $46.1 billion.
In the Asian session, at GMT0300, the pair is trading at 1.1759, with the EUR trading 0.12% higher against the USD from Friday's close.
The pair is expected to find support at 1.1705, and a fall through could take it to the next support level of 1.1651. The pair is expected to find its first resistance at 1.1790, and a rise through could take it to the next resistance level of 1.1821.
Moving ahead, investors would keep an eye on the Euro-zone's Sentix investor confidence index for July and Germany's trade balance data for May, slated to release in a few hours. Later in the day, the US consumer credit for May, will keep investors on their toes.
The currency pair is trading above its 20 Hr and 50 Hr moving averages.
UK’s Halifax House Price Index Climbed More-Than-Expected In June
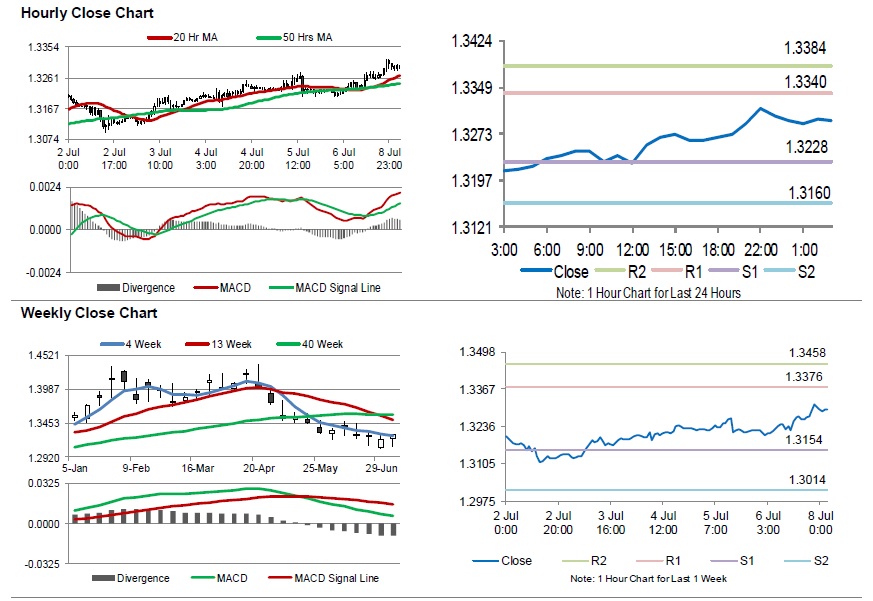
For the 24 hours to 23:00 GMT, the GBP rose 0.51% against the USD and closed at 1.3290 on Friday.
In the economic news, UK's Halifax house price index rose 1.8% on yearly basis in the three-months ended April-June 2018, more than market expectations for a gain of 1.6%. The index advanced by a revised 1.9% in March-May 2018.
In the Asian session, at GMT0300, the pair is trading at 1.3295, with the GBP trading marginally higher against the USD from Friday's close.
The pair is expected to find support at 1.3228, and a fall through could take it to the next support level of 1.3160. The pair is expected to find its first resistance at 1.3340, and a rise through could take it to the next resistance level of 1.3384.
Amid lack of major macroeconomic releases in the UK today, traders would focus on global macroeconomic events for further direction.
The currency pair is trading above its 20 Hr and 50 Hr moving averages.
Japan Posted A Trade Deficit In May
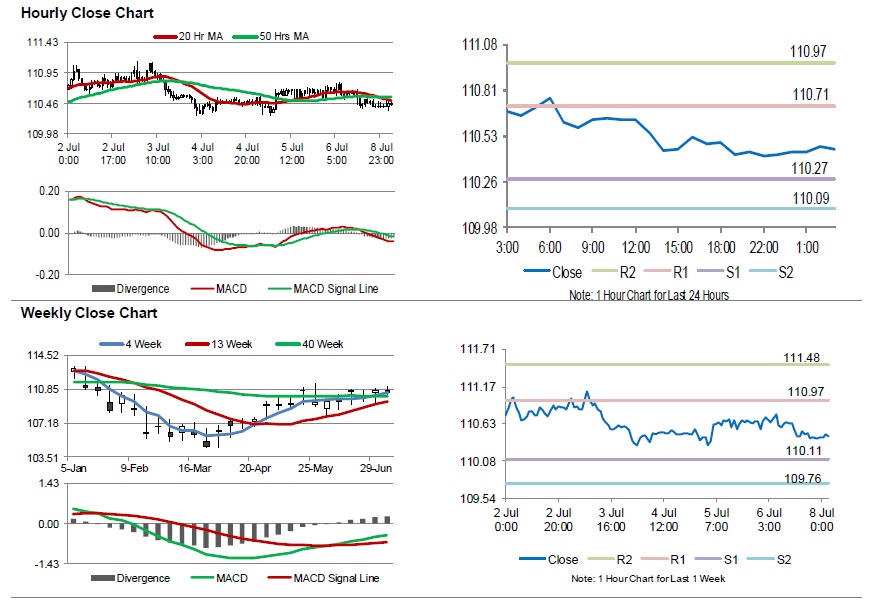
For the 24 hours to 23:00 GMT, the USD declined 0.21% against the JPY and closed at 110.43 on Friday.
Macroeconomic data showed that Japan’s preliminary leading economic index advanced to a 6-month high level of 106.9 in May, higher than market expectations of an advance to a level of 106.6. In the prior month, the leading economic index had recorded a reading of 106.2. Meanwhile, the nation’s the flash coincident index dropped to a level of 116.1 in May, in line with market expectations. In the previous month, the index had recorded a reading of 117.5.
In the Asian session, at GMT0300, the pair is trading at 110.45, with the USD trading slightly higher against the JPY from Friday’s close.
The Japanese Yen fell against the dollar, after Japan posted a trade deficit in May.
Overnight data indicated that Japan recorded a trade deficit (BOP basis) of ¥303.9 billion in May, following a surplus of ¥573.80 billion in the prior month. Market had expected for a trade deficit of ¥483.10 billion.
The pair is expected to find support at 110.27, and a fall through could take it to the next support level of 110.09. The pair is expected to find its first resistance at 110.71, and a rise through could take it to the next resistance level of 110.97.
The currency pair is showing convergence with its 20 Hr moving average and trading below its 50 Hr moving average.
Swiss Franc Trading On A Stronger Note In The Morning Session
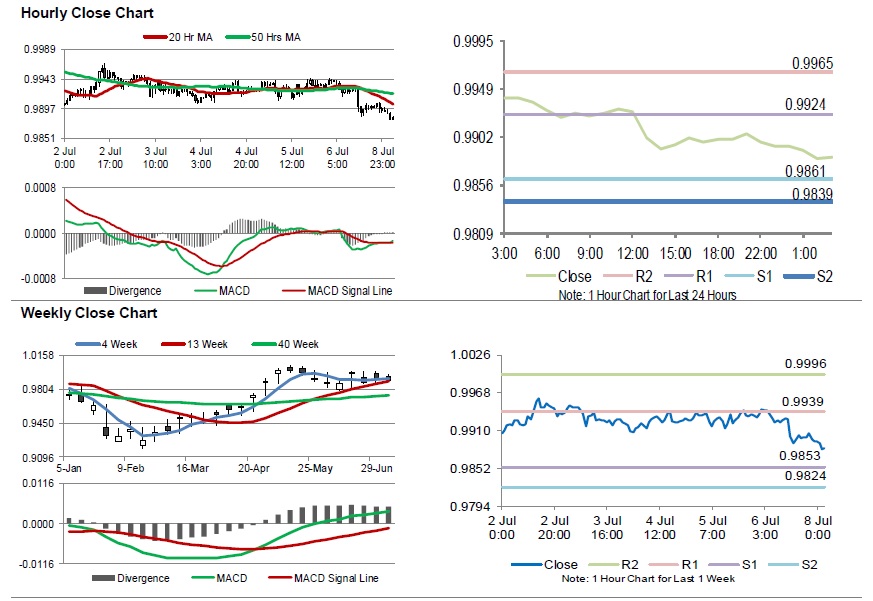
For the 24 hours to 23:00 GMT, the USD declined 0.28% against the CHF and closed at 0.9905 on Friday.
In the Asian session, at GMT0300, the pair is trading at 0.9883, with the USD trading 0.22% lower against the CHF from Friday’s close.
The pair is expected to find support at 0.9861, and a fall through could take it to the next support level of 0.9839. The pair is expected to find its first resistance at 0.9924, and a rise through could take it to the next resistance level of 0.9965.
Looking forward, investors will await Switzerland’s unemployment rate for June, set to release in a while.
The currency pair is trading below its 20 Hr and 50 Hr moving averages.
Loonie Trading Higher In The Morning Session
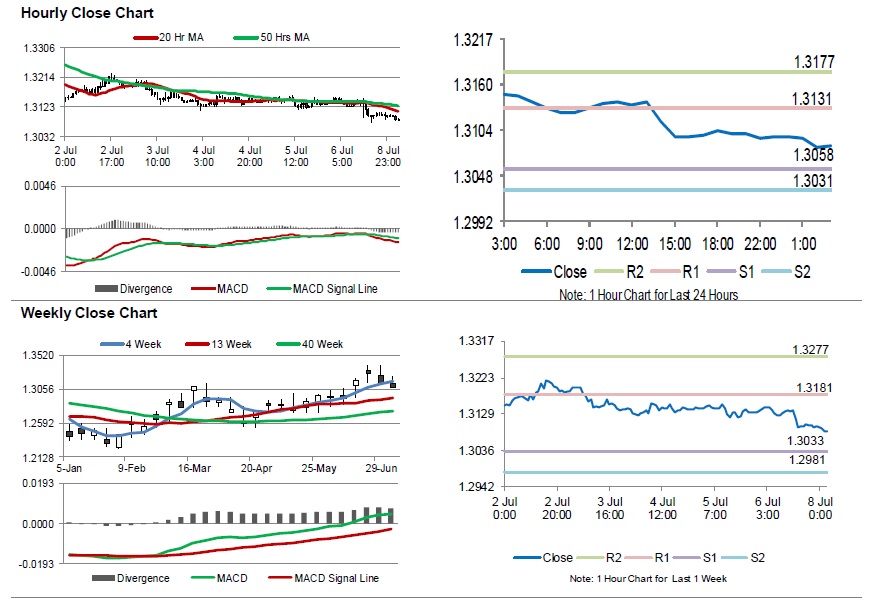
For the 24 hours to 23:00 GMT, the USD declined 0.25% against the CAD and closed at 1.3101 on Friday.
Data released showed that Canada's unemployment rate unexpectedly rose to 6.0% in June, defying market consensus for an unchanged reading. The unemployment rate had recorded a rate of 5.8% in the prior month. Additionally, trade deficit widened more than expected to C$2.8 billion in May, compared to a revised deficit of C$1.9 billion in the prior month. On the other hand, nation's seasonally adjusted Ivey PMI increased to a level of 63.1 in June, compared to a reading of 62.5 in the previous month.
In the Asian session, at GMT0300, the pair is trading at 1.3085, with the USD trading 0.12% lower against the CAD from Friday's close.
The pair is expected to find support at 1.3058, and a fall through could take it to the next support level of 1.3031. The pair is expected to find its first resistance at 1.3131, and a rise through could take it to the next resistance level of 1.3177.
In absence of key economic releases in Canada today, investor sentiment would be determined by global macroeconomic events.
The currency pair is trading below its 20 Hr and 50 Hr moving averages.
Aussie Trading On A Stronger Footing In The Asian Session
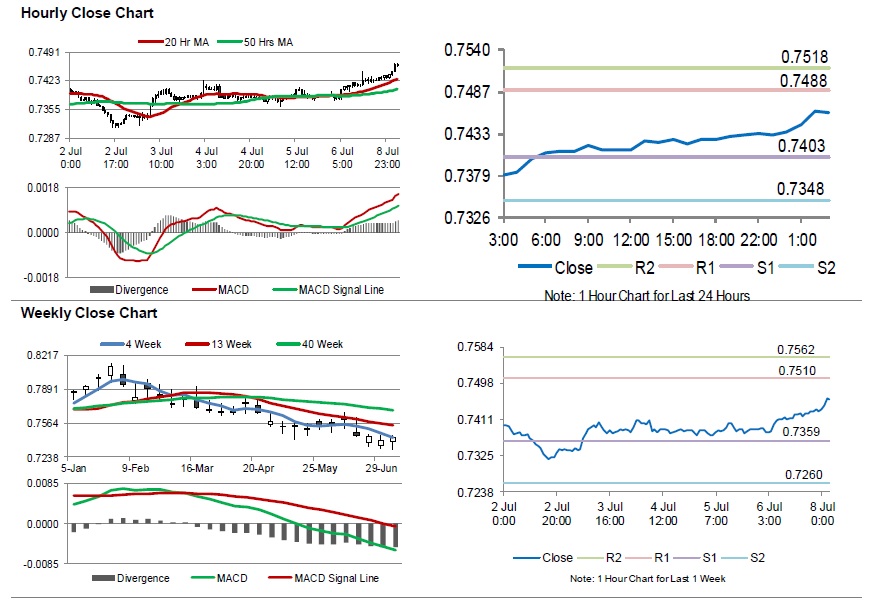
For the 24 hours to 23:00 GMT, the AUD rose 0.58% against the USD and closed at 0.7431 on Friday.
LME Copper prices declined 1.2% or $73.5/MT to $6326.0/MT. Aluminium prices declined 1.3% or $28.5/MT to $2098.5/MT.
In the Asian session, at GMT0300, the pair is trading at 0.7459, with the AUD trading 0.38% higher against the USD from Friday’s close.
The pair is expected to find support at 0.7403, and a fall through could take it to the next support level of 0.7348. The pair is expected to find its first resistance at 0.7488, and a rise through could take it to the next resistance level of 0.7518.
Going ahead, investor would closely monitor Australia’s NAB business conditions and the NAB business confidence, both for June, scheduled to release overnight.
The currency pair is trading above its 20 Hr and 50 Hr moving averages.
Gold: Yellow Metal Reverses Its Losses In The Asian Session
For the 24 hours to 23:00 GMT, Gold declined 0.23% against the USD and closed at USD1256.20 per ounce on Friday.
In the Asian session, at GMT0300, the pair is trading at 1259.40, with gold trading 0.25% higher against the USD from Friday’s close.
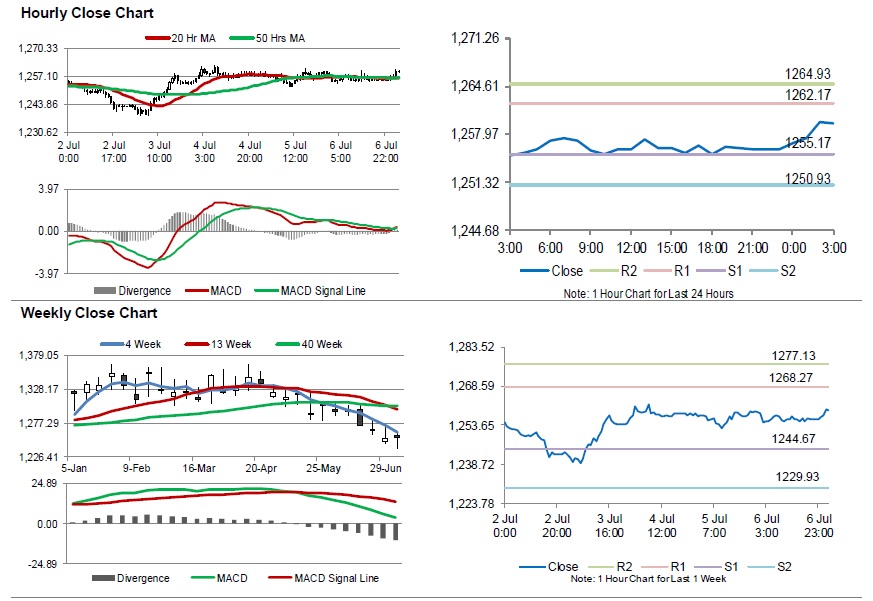
The pair is expected to find support at 1255.17, and a fall through could take it to the next support level of 1250.93. The pair is expected to find its first resistance at 1262.17, and a rise through could take it to the next resistance level of 1264.93.
The yellow metal is trading above its 20 Hr and 50 Hr moving averages.