

Sample Category Title
For The USD, It’s All About This Week’s CPI
For the USD, it's all about this week's CPI.
Markets dismissed the opening salvo of the US -Sino trade war as dated news.
However, after another Goldilocks NFP, US stock markets traded positively in the green while the US dollar bears begrudgingly came out of hibernation after US bond market yields knee-jerked lower.
The NFP report showed the US economy continues to add jobs at a robust pace (+213k). There was a 0.2pp rise in the participation rate to 62.9%, with the expansion in the labour force helping lift the unemployment rate to 4.0%. AHE were softer than expected at 0.2% m/m (consensus: 0.3% m/m). An undershoot in hourly earnings with the participation rate moving higher suggests there is still more room in the labour market to go before wage pressure passes through to the data. But none the less, it does keep the Fed on track and shouldn't alter too much from that perspective. But the tepid US wage growth inflationary data does lend tentative support to the fresh recovery in EM and G10 high-beta currencies versus the USD
However, for the USD to get back on track and reverse this negative momentum, it's all about this week's US CPI print. With the big dollar apparently in retreat, the Greenback will need a shot in the arm with inflationary “pick me up juice” to reverse this nascent sell-off
Trade war
The market will be incredibly focused on Fed chatter this week as downside risks from tariffs were discussed by Fed officials as indicated on the Jun 13 FOMC meeting minutes released last week. Currently, the duties on $34 billion of Chinese goods, remain primarily at the Walmart level as far as escalation runs and will have limited economic impact, However, should the Administration follow through with the threat of a $200 billion + duties on Chinese goods, indeed this would have some negative implication for both the US and global growth prospects.
Remember that while Powell recognised the dangers of escalating trade war in his Sintra comments last month, but he was insistent the Fed would need to assess incoming data. Early warning signs usually come from sentiment surveys and if we recall it was China and EU sentiment indexes that had led investors into the tank in those key markets. So, traders will key on this week's University of Michigan consumer sentiment index to see if there are any signs that consumer sentiment is starting to fray from trade war fears.
Oil Market
Of course, Oil traders are wholly perplexed by President Trumps demands to cut off 2.4 million barrels of Iranian oil while admonishing OPEC to keep prices stable if not have them go down! But it's the White House's zero-tolerance policy to Iran which is supporting oil markets given the fragile state of global supplies as spare oil capacity hovers near zero. In this scenario, of supply reality versus wishful thinking, there is only one direction for the oil price to move, and that is higher over time
Oil benchmarks went in opposite directions Friday afternoon, with WTI running higher and Brent trading lower as fears of the escalating U.S.-Chinese trade war and increased production by Saudi Arabia, and Russia bumped against supply disruptions from Venezuela and Libya as well as the sanctions on Iran.
There has been some interesting discussion over a note issued by Sanford C. Bernstein & Co. suggesting the lack of reinvestment in oil production could lead to a price spike.“Investors who had egged on management teams to reign in capex and returned cash will lament the underinvestment in the industry,”, And that falling behind the production curve in favour of paying out shareholder dividends runs the risk of prices spiralling much higher in the future.
Baker Hughes reported an increase of 5 in the number of active oil rigs in the United States matching the June high water mark.
Gold Market
For the better part of June and early July, US dollar strength and the dollar-bullish outlook continued to weigh on gold as stronger than expected US data and a hawkish Fed weighted gold prices down like an anchor. Buyers of physical in Asia have been few and far between despite the pullback, as local currencies have been taking it on the chin due to the stronger USD. But the Goldilocks NFP print which could deliver a softer US dollar profile this week, suggests opportunistic investors may return which should support gold prices. After all, in this highly political and geopolitically charged environment, gold remains a very suitable component in any diversified portfolio.
China Market
While China response to the US administration trade policy is keeping the headline tickers working overtime, growth remains mainland's biggest priority hence the markets will be extremely focused on this week's China tier one economic data dump which will provide some exacting signpost for evaluating Chinas economy. While US-Sino Trade will continue to dominate the headline ticker tape, this week's critical set of growth data will be a massive test for local markets. Frankly, by all metrics, growth in China remains more than adequate, but a subpar reading and Main Street might eventually take notice and realise all is not well in China.
PBoC
Many confusing signals to deal with but none more so than why the PBoC waited so long on the currency front before verbal intervention which has left just enough uncertainty in the air over what their actual motivation was. With some arguing that policy choices are going to be robust and will have the effect of intentionally causing the currency to weaken. However, authorities have made clear their intent on domestic monetary settings, and this would suggest that growth and not trade war will be the determining factor in policy decisions
Indeed, there is Big Trouble in Big China as authorities continue to grapple with pulling back stimulus created by a state-run banking machine which operated with wanton disregard for risk management. Add in the prospects of an economic slowdown, escalating trade wars all wrapped in a shrinking population, and it does suggest Main Street is missing the bigger picture. China risk continues to be underpriced from my chair indicating at a minimum; the Yuan will resume trending lower as the mainland administrators continue to deleverage China, keeping in mind in a wobbly China scenario, CNH should move more than CNY (which is fixed)
Asia market
There have been massive portfolio outflows from Asia that have resulted in markets tumbling to fire sale levels (SHCOMP -20% on the year). The big dollar – which triggered a lot of the recent round of EM troubles – seems to be consolidating but, there is a lot to be still much to be worried about as the US is not easing its aggressive trade posturing. But this extended period of capital outflows in ASEAN markets does suggest this was more than event-driven risk but more of a structural shift. Whether this shift was all about the strength of the US dollar and risk around China, or more likely a combination for both, this week tier one China data will go along way to confirm this view.
Malaysia market
The first round of US tariffs has come into effect with little fanfare. But this contained reaction has given a boost to local risk assets led by the SHCOMP trading 2.5 % higher w. USD ASIA along with the broader G-10 complex in general, traded lower into the weekend as the Goldilocks NFP has given a boost to the nascent EM Asia rally and the USDMYR was no exceptions piggybacking regional risk.
But MYR bonds were trading very neutral into weekend due to the NFP influence, but activity should pick up today ahead of the MPC on the 11th which could read neutral to dovish and give support to local bonds. However, a more dovish MPC could cause the USDMYR trade defensively this week, but the currency pair will be hard pressed to take out the 4.05 level given the s US dollar could be on the retreat after Friday's tepid US wage growth-inflation.And with OIL prices poised to move higher, the Ringgit should get some support from the commodity sector.
On the MPC front, economic growth will slow to 5.5 per cent this year from 5.9 per cent, while inflation will cool to 2.5 per cent from 3.9 per cent, which will give new Governor Nor Shamsiah Mohd Yunus cause to pause. But for fear of triggering more outflows and denting the local capital market appeal due to to the resulting weaker Ringgit, the BNM will likely refrain from being overtly dovish. With very little priced into rate hike expectations, the market has done most the BNM repricing with Bloomberg data showing the market implied policy rate for one year's time has declined to 3.28 per cent from 3.41 per cent in May, so why rock the boat.
Currency Market
NZD: The metals complex has recovered from the worst of the sell-off for now and has seen something of a relief rally in AUD & NZD.But given the antipodean position in the global supply chain, they will be the first pairs to buckle on a further escalation of trade war rhetoric.
EUR: The Euro has seen a decent relief rally from the low 1.15 handle, and after last week when some ECB members advocated a sooner rather than later rate hike and a Goldilocks NFP print we could see some more EUR short covering. But it does feel like we are entering the summer doldrums on currency markets as desks are more apt to cover what orders need to be hedged and little else.
JPY: This remains a painfully dull range trades, and levels are clear with the downside at 109.90 and topside resistance in the 111.20
BoJ Kuroda to maintain ultra loose policy until inflation hits target
BoJ Governor Haruhiko Kuroda said at a quarterly meeting of regional branch managers that the central bank would maintain its ultra-loose monetary policy until inflation hits 2% target. He added that the economy is expanding moderately and is expected to continue with it. Consumer inflation, however, is moving between 0.5% to 1.0%.
BoJ will continue to pursue current policy under the yield curve control framework for as long as needed. The monetary policy will be adjusted when necessary to maintain economic momentum.
ECB Coeure: Europe United to respond to US shift from hegemonia to arkhe
ECB Executive Board Member Benoit Coeure the recent developments in trade war "doesn't have the potential to derail the recovery" of the Eurozone. Just after ECB announced to end the asset purchase program in December, the risks of US-China trade war has turned from rhetorics into reality. And the US is threatening tariffs on European Union autos. But Coeure said that the June monetary policy decision "already takes the risks into account" and there is "no reason to change policy expectations" right now. He added the the impact of trade tensions on business confidence is so far "limited" and "the backdrop is very strong resilient growth in the Eurozone".
Coeure also delivered a speech titled "Asserting Europe's Leadership" and shared his view on the current global development. He noted that over the past seven decades, American leadership in the world was of the "legitimate" type, that "builds on trust and common identities". That's called "hegemonia" in ancient Greece. Such leadership was "largely unchallenged because it was built on shared fundamental values ... of human rights, freedom, democracy, equality and the rule of law."
However, Coeure pointed out that "putting one's country first marks a departure from the sort of prudent and vigilant policy that leadership by a legitimate hegemon would entail." And, "he transactional nature of such an approach arguably belongs much more to arkhe – hard power – where policies and doctrines are imposed on others, without their consent and regardless of the consequences. International agreements are repealed, the international rule of law is questioned and other nations are challenged."
He also said that solutions offered to solve the problems of globalization are too often "simplistic and short-sighted". For example, "raising tariffs and withdrawing within national borders will deprive people of the economic benefits of trade and integration." And he pointed to ECB staff estimates that if US raises tariffs of all goods by 10% while others retaliate the same, US GDP could drop up to -2.5% in the first year alone.
Coeure said EU's response, as seen with ancient Greeks, were alliances against arkhe. That is, "Europe united" against "America first". In particular, he stressed the importance of "completing the euro area's architecture" as it's necessary for Europe to attain other objectives on fostering cooperation on security and defence, speak with one voice on international affairs and to complete the Single Market.
Eco Data 7/9/18
[php_everywhere instance="1"]
FX Delta – 1-Click Trade Signals for MT4

Get the ultimate 1-click trade signals based on riding market trends, accompanied with the best risk- reward strategy and accurate timing entry.
FX Delta has been developed and is successfully used both by beginners and experienced traders. The user guide and accompanying video tutorials contain all the background information you should know about the strategy but are certainly not a must if you are not interested in in-depth learning.
The system scans trends in long time-frames , while simultaneously looking for market corrections on short-timeframes. The software algorithm then pinpoints the ideal market entries - the exact places with the highest probability of trend continuation and minimal risk. The algorithm uses volume and momentum along with price action to accomplish the trend identification and is suitable for intra day trading as well as long term trading.
The Delta System is composed of 2 elements:
Element 1: The Delta Scanner
A quick, efficient visual tool to pinpoint the markets that are currently moving and suitable for trading. All the markets are covered - Forex, Commodities, Stocks, Indices, Cryptocurrencies. This is the first step of the FX Delta trading process.
Element 2: The FX Delta Dashboard - Includes 3 "sub" areas:
- Navigation - this section provides the general information on where we stand, what we are looking for, and the levels that will validate the setup. In technical terms, here you will find the direction we are looking to trade, the safety range and the validity of the delta pattern on the higher time frames.
- Trade management - provides useful information such as: target 1 and 2 in pips, risk-reward ratio towards target 1 and 2, and stop loss in pips.
- 1- click shortcut trade execution buttons - our traders' favorite part: get effortless 1-click trade alerts that contain Open Market, Set Pending, Close Trade fields.
EA Builder – Create Indicators and Strategies Without Programming

Autotrading Made Easy - Create Indicators and Strategies without Programming
- MetaTrader 4 & 5 Supported
- TradeStation EasyLanguage Supported
- Binary Options NEW!
- Create Unlimited Indicators for Free
- Create Strategies with a One-Time Upgrade
- Video Tutorials
The best thing about EA Builder is that the work is pretty much done in a few clicks. Turn your trading idea into an automated system within minutes, without hiring a programmer and without knowing anything about programming. Even professional programmers appreciate the benefits of creating indicators and strategies with a few short clicks.
Trade Forex, Stocks and Futures
You can create strategies to trade any financial instrument available on any of the three most popular trading platforms: MetaTrader 4, MetaTrader 5 and TradeStation.
Intuitive & Straightforward
Start creating your first strategies or indicators within minutes! No manuals to study. Nothing to install, because it's a web-basedapplication. Creation is pretty straightforward, and every feature has a popup-tip that guides you with a short explanation, so you never get lost!
Loads of Features
Only want to trade at specific times of the day? Want to limit the number of trades or trade duration? All it takes is a single click!
Custom Indicators and Functions
Besides all the standard indicators and amazing built-in functions such as trendlines, support, resistance and time of day, you can add custom indicators or custom functions, so there are really no limitations on what you can do with EA Builder!
Alerts
Audible alerts, email alerts, print to output window, and so on, are convenient ways to get notified that trades have been executed or new indicator arrows have shown up.
Money Management
Money management techniques set up with a few clicks will ensure that your account is never exposed to substantial losses.
Nice Output
The generated code is human readable, well-commented and neatly formatted. It uses no objects, classes or advanced functions, and it is contained in a single file. You don't need to understand the code, just download it. However, for non-professionals interested in diving into the source and learning something about it, this is a great tool.
Binary Options
In addition to standard market and pending orders, you can trade Binary Options directly on MetaTrader 4. A short video tutorial will guide you through how to use this new feature.
Video Guide to Creating a Profitable EA (Expert Advisor)

Whether you're an EA programming guru or an absolute beginner, a video tutorial will take you step-by-step through how to create your own indicators and strategies WITHOUT writing a single line of code. Scroll down the page below to see the first video on how to create a simple but useful indicator.
Click here and then scroll down to "Video Tutorials" and play the Youtube video:
And there's much more inside - you will learn how to design, backtest and optimize a winning strategy. It doesn't matter whether you're using MetaTrader or TradeStation, the videos are made for both platforms!
- How to Create Indicators
- How to Create Strategies
- Daily Breakout Strategy
- Daily Breakout with Pending Orders
- Strategy Optimization
- Money Management Demonstration
- Trendline Breakout Automated Entry
Forex Trendy – Forex Trend Scanner

Knowing the trend is crucial. Sure, you have experienced times when you entered the trade and waited during the choppy zone while some other pair was making a solid move. Trading the market that turns up and down and takes back all the profits during a series of losses feels like a slow torture...
Forex Trendy is a software solution to avoid trading during uncertain market periods. Instead, pick the best trending pair at the current time.
It uses no indicators, but the trend is determined by pure price action.
It quickly scans 34 Forex pairs on all time frames from minute to monthly. That's 34 x 9 = 306 charts. Forex Trendy analyzes all the charts for you every second! This way, you get the best trending pair and time frame at any time you want.
The software runs on our powerful computers so you instantly get the result online. Therefore, you can use your favorite trading platform such as MetaTrader, NinjaTrader, TradeStation... and there is nothing you have to download or install. It is very easy to use.
The truth is that most Forex systems or robots make money with the trend, but lose money in a choppy market. For example, imagine you trade a system that makes 50% winning trades, but another 50% are losing trades. By following the trend you would dramatically increase the odds of winning. If you increase the odds of winning by only 20%, that would make 70% winning trades and 30% losing trades. This can make the difference between losing (or breaking-even) and winning. In other words, by following the best trend it can only be better.
Avoid struggling with the erratic market chaos when the trend direction is unclear. Take only confident trades in the best markets at the current time.
You would be the one knowing which one particular (even exotic) pair is trending while other traders wouldn't notice it without this tool. Knowledge is power!
Fibo Quantum – Forex Indicator Based Fibonacci Sequence & The Golden Mean
"Fibo Quantum" is a Unique Forex Indicator Based On The Age-Old Fibonacci Sequence & The Golden Mean.
Fibo-what? What is this? Forex Voodoo? No. No magic of any kind here.
To explain more about the Fibonacci sequence and the Golden Mean, we need to go a bit back into history… Bear with me because it's important for your financial well-being.
And… That's why you are here. Right?
When we look at the history of the human race, we tend to notice a lot of unmissable patterns. Wherever we look.
Man follows science. Science follows nature. And, nature follows a pattern. Keen observers have taken note of this, and some of the smarter ones are making profit from the predictable nature of this pattern.
 Here is a famous quote for you:
"There are only patterns, patterns on top of patterns, patterns that affect other patterns. Patterns hidden by patterns. Patterns within patterns. If you watch close, history does nothing but repeat itself..." ― Novel by Chuck Palahniuk, Survivor
See FIBO QUANTUM IN LIVE ACTION
It's Easy To Make Profit From Price Patterns
Did you know that everyone from the large hedge funds to investment banks have sizable trading teams that simply observe and make decisions based on patterns?
There are numerous investors from Marty Schwartz and Ray Dalio to Paul Tudor Jones that depend heavily on technical analysis to run their billion-dollar funds.
The price fluctuations may look extremely volatile to untrained eyes but over periods of time, they usually follow a set pattern. Those who KNOW this are making profit from these patterns. These people have already developed their own analysis and observation methods that have made the task much easier than it ever was.
A significant pattern that investment analysts depend on to develop their funds is the Fibonacci Sequence.
See FIBO QUANTUM IN LIVE ACTION
USING FIBONACCI IN FOREX IS VERY POWERFUL
Fibonacci Sequence is a Special Sequence of Numbers That Can Be Found In Nature As Well As in Financial Markets.
The sequence was discovered in the 13th century by Leonardo de Pisa who was amongst the most talented mathematicians of the Middle Age. Leonardo came to a conclusion that there was a pre-set series of numbers and ratios that determined the natural proportion of things in the known universe.
In a Fibonacci sequence, every number is the sum of the previous two numbers. Let me illustrate the sequence: 0, 1, 1, 2, 3, 5, 8, 13, 21, 34, 55, 89 and so on.
When taken into the context of the Forex markets, Fibonacci Ratios Indicate Powerful Price Levels that Force The Market To Move in The Expected Direction Every Single Time.
See FIBO QUANTUM IN LIVE ACTION
UNBEATABLE ACCURACY
Successful Forex traders use Fibonacci-indicated levels to pinpoint exactly where to place their orders and where to close them to make profit.
When you measure the ratio of any number to the succeeding number, you get 0.618. This is known as the "Golden Mean".
Traders following Fibonacci sequences and The Golden Mean have found ways to use this information to predict where the price will go with an unbeatable accuracy.
My team and I have spent a considerable amount of time researching, developing and optimizing Fibo Quantum, one of the best and most reliable Fibonacci Indicators we ever created.
Fibo Quantum is not complicated. It's actually much easier to use than you might you think.
See FIBO QUANTUM IN LIVE ACTION

IT'S SO SIMPLE THAT EVEN NEWBIES CAN START WINNING BIG TRADES IN JUST A FEW MINUTES!
Fibo Quantum has three trading styles that impact the speed of its signals. There are "Aggressive", "Medium" and "Conservative" trading styles. You can try all of them and choose the one that best suits your own vision of trading and your preferences. Plus, for the more experienced traders out there – there is also "Custom" trading style that allows users to manually configure signals and gives even more flexibility.
Even someone with almost no trading experience can read the simple trading rules given in the User Guide and follow the indicator's signals to consistently make good stable profit.
Instead of sitting glued-in to catch lucrative price movements like the average traders do, with Fibo Quantum you will get simple signal alerts every time there is a new trading opportunity. Fibo Quantum will also give you a signal when the BUY/SELL Entry levels are reached so that you can immediately open your trade.
The algorithm is developed in such a way that traders can make profits with their eyes closed. The signal alerts are sent via email, pop-up and mobile push notifications, so that you never miss any profitable price movements.
Fibo Quantum makes your trading exponentially successful and super convenient.
Forex Forecast and Cryptocurrencies Forecast
First, a review of last week’s forecast:
EUR/USD. The forecasts of the majority of experts (55%) included the level of 1.1725, which the pair must have achieved this week. And this was what happened. Positive economic data from Germany as well as not the rosiest statistics from the labor market in the US (NFP declined by 12.7%), and the once again inflaming trade war between the US and China side with the Euro. As a result, the pair gradually, step by step, reached the height of 1.1765. Then a small correction followed, and it completed the trading session at the level of 1.1745;
GBP/USD. Summarizing rather contradictory opinions of analysts and indicators, we assumed that the pair would continue to move to the east along the horizon 1.3200, making fluctuations in the range of 1.3050-1.3325. And, judging by the graph, this forecast turned out to be correct. Starting from 1.3200 mark on Monday night, the pair first fell to the level of 1.3093, then turned and went up, rising to the height of 1.3285.
The pound was once again supported by "hawkish" statements coming from the Bank of England, and the prospect of the interest rate raising. The growth of activity in the service sector of Great Britain also added optimism for the players;
USD/JPY. The scale that determines the quotes of this pair, on the one hand has the super soft monetary policy of the Bank of Japan, and on the other - the trade wars raging on the continents, as a result of which more and more investors choose the currency of this island state as a refuge.
Proceeding from this, most experts, supported by graphical analysis on D1, expected the continuation of fluctuations in quotations and the struggle between bulls and bears. According to their forecast, the pair had first to rise to the horizon of 111.45 (it grew to 111.15), and then go down to support 110.00 (in fact it reached the level of 110.27). Then another cycle of fluctuations followed, and the pair completed the five-day period at 110.46, confirming its strive for consolidation in zone 110.10;
Cryptocurrencies. After the jump on June 30, the pair BTC/USD continued to grow and managed to even reach $6,780, after which it rolled back down. Recall that the optimistic forecast for the past week said that if bitcoin confidently overcame the level of $6,700, it would be a strong enough signal to the long-awaited trend change. However, despite a significant growth, there has been no real breakthrough of this resistance, and the level of $6,600 can be considered as the Pivot Point of the last days.
Following the bitcoin, the Ethereum (ETH/USD) showed a certain growth, although the level of $485 can be considered the upper limit of a two-month down channel. And, in case of a rebound from it, the pair can fall to the price of 360 dollars per coin.
As for the Litecoin (LTC/USD) and the Ripple (XRP/USD), they moved into a sideways trend, ending the week in the same place where it started.
As for the forecast for the coming week, summarizing the opinions of a number of analysts, as well as forecasts made on the basis of a variety of methods of technical and graphical analysis, we can say the following:
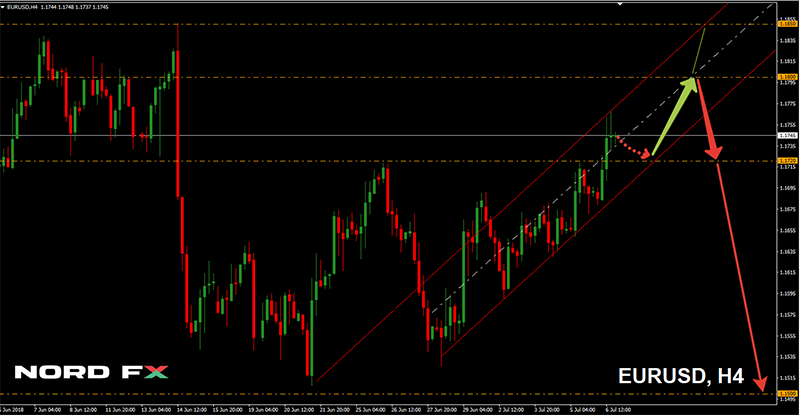
60% of experts, supported by graphical analysis on D1, believe that the growth of the EUR/USD may continue, but it will be a small one. The level 1.1800 is named as the main resistance. The next resistance is 50 points higher. Next, during July, the pair again expects a decline to the support of 1.1500 and another attempt to break through it.15% of oscillators on H4 and D1 agree with this development of events, giving signals that the pair is overbought.
No "revolutionary" news is expected next week. However, we should pay attention to Thursday July 12. On this day data on the growth rates of industrial production in the Eurozone will be published, as well as statistics on the consumer price index in the United States. According to analysts, the rate of inflation in the US over the past month has accelerated, which could push the Fed to another interest rate hike and, as a result, render additional support to the dollar;
For the pair GBP/USD the graphical analysis on H4 and D1 draws a rebound from support 1.3225, growth to the 1.3400 zone and the subsequent sharp drop to the horizon of 1.3000. As for the experts, in the current situation they are waiting for news from the UK.
Thus, on Tuesday July 10 data on the growth rates of industrial production for May will be published, and if it turns out that the April recession is completely overcome, the pound may rise above the 1.3300 mark.
Another speech by the head of the Bank of England may provide support for the British currency on Wednesday July 11, if Mark Carney again talks about the forthcoming tightening of the monetary policy.
The government of Great Britain can play against the pound. In the near future, it must submit its draft agreement on Brexit to the EU, and if it does not contain any important aspects for the economy of the country, the pound may again be under serious pressure;
USD/JPY. The trade war between the US and China is again in full swing. On July 6, the duties on imported Chinese goods mounting to 25% entered into force. Washington is expected to increase sanctions by another $200 billion, to which China threatens to respond by selling off US treasury securities.
Against this background, as already mentioned, there is a growing demand for the yen, as a safe shelter currency. The pair USD/JPY rose by about 6.7% over the past four months. As for the upcoming week, most analysts (60%) expect the continuation of its growth to the level of 111.40. The remaining 40% believe that the pair has moved to a lateral movement and will be held in channel 109.35-110.80. The next support is at the level of 108.65;
Cryptocurrencies. The major question for the near future is whether the bitcoin continues its growth or rolls back. At present, it is clearly aiming at overcoming the $7,000 mark, and buyers are not leaving the market yet. However, even now indicators show that this cryptocurrency is overbought, and, in case of any negative news, the trend can very quickly turn from bullish to bearish, returning the pair to the June lows.
On the other hand, a number of experts predict the continuation of the growth of the BTC/USD, naming as one of the numerous reasons the comeback of many investors disappointed in altcoins to this cryptocurrency, the long absence of bad news, and, paradoxically, the low volume of trading. The latter means that the desperate have already left the ship, and those who wish to sell these coins are extremely few. There remain only those who, no matter what, are ready to keep the bitcoin either till the full victory or the complete collapse. That is why the optimists keep saying that by the end of the year BTC will cost at least $50,000 (Arthur Hayes, BitMEX), or at least $25,000 (Tom Lee, FundStrat).