Sample Category Title
EUR/CHF Weekly Outlook
EUR/CHF's choppy rebound from 1.1478 extended higher last week but stayed below 1.1656 resistance. Initial bias remains neutral this week first. On the upside, break of 1.1656 will resume the corrective rise from 1.1366 short term bottom. EUR/CHF should target 61.8% retracement of 1.2004 to 1.1366 at 1.1760. But we would expect strong resistance from there to limit upside. We'd still expect at least one more falling leg before the correction from 1.2004 completes. On the downside, break of 1.1478 will turn bias to the downside for 1.1366 first.
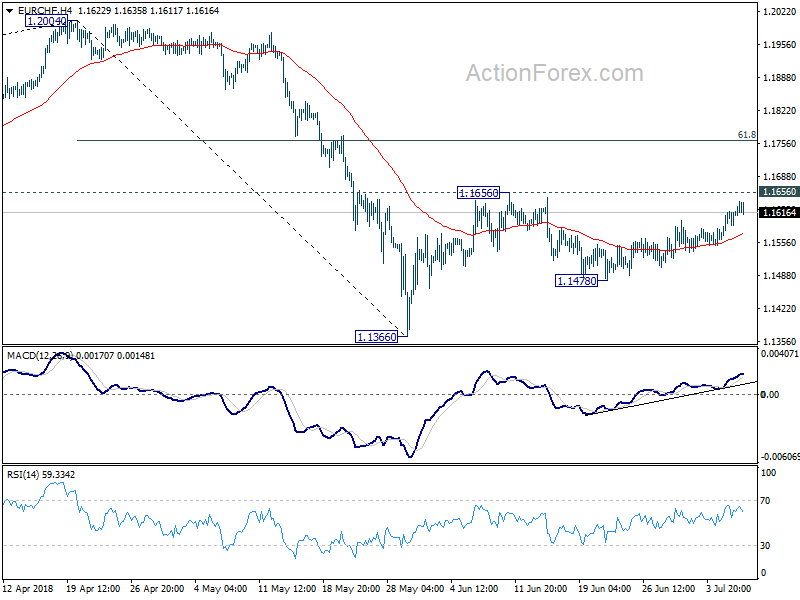
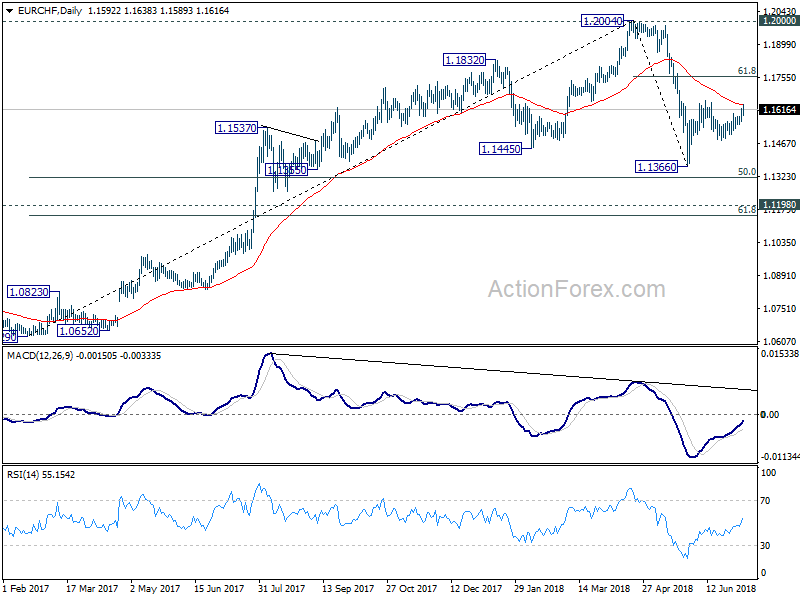
In the bigger picture, EUR/CHF was solidly rejected by prior SNB imposed floor at 1.2000. Considering bearish divergence condition in daily and weekly MACD, 1.2004 should be a medium term top. And price action from 1.2004 is correcting the up trend from 1.0629. Such correction is expected to extend for a while and therefore, we're not anticipating a break of 1.2004 in near term. Another decline cannot be ruled out yet. But in that case, strong support should be seen at 1.1198 (2016 high), 61.8% retracement of 1.0629 to 1.2004 at 1.1154 to contain downside.
US, European and Asian Markets Reacted Differently to Start of US-China Trade War
The global markets reacted rather differently as the US-China trade war formally started while there were only signs of further escalations. Over the week, NASDAQ was a star performer and rose 2.37% to 7510.30. S&P 500 rose in tandem by 1.52% to 2759.82. DOW lagged behind but also managed to gain 0.76% to 24456.48. Over the Atlantic, DAX was the best performer and gained 1.55% to 12496.17. CAC increased 0.98% to 5375.77. FTSE, however, lost -0.25% to 7617.70. And, the picture was much were in Asia with China SSE leading the way, down -3.52% to 2747.22. Hong Kong HSI suffered for its close tie to China and lost -2.21% to 28315.62. But Nikkei also performed badly and lost -2.31% to 21788.41.
US stocks rally showed little worries on trade war
The strength in in US stocks argued that investor might have priced in little impact to the economy from trade war with China. Or, they could have perceived the strength of the US economy to be strong enough to withstand the impacts. Data from the US were generally good last week as ISM manufacturing rose to 60.2 in June. ISM non-manufacturing rose to 29.1. Non-farm payroll rose more than expected by 213k. Unemployment rate rose to 4.0% but that was positive as participation rate rose from 62.7% to 62.9%. Wage growth at 0.2% mom was a miss but that would keep Fed on course with its rate path, without pushing it faster.
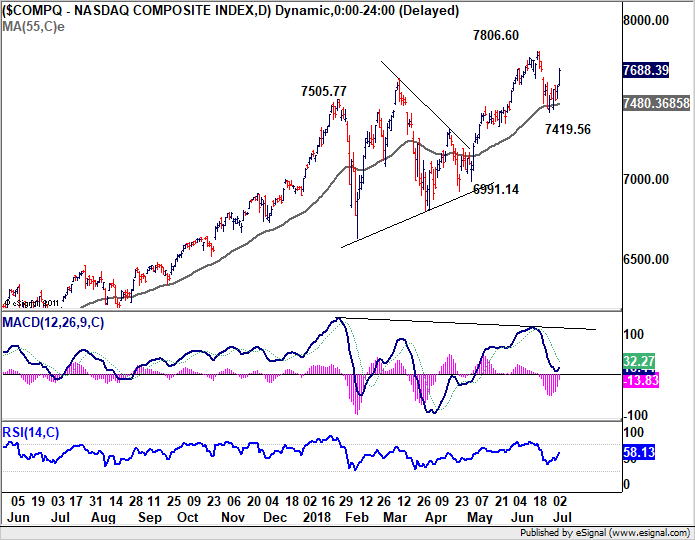
NASDAQ's rebound and strong close on Friday firstly suggest strong support from 55 day EMA. Secondly, that in turn retained near term bullishness in the index. Focus will be back on 7806.60 resistance this week and break will pave the way to 8000 psychological level.
European sentiments lifted by hope to avert car tariffs
Another factor that support US stocks, as well as European stocks too, was the hope of a point of convergence in US-EU negotiation to avoid trade war on cars. It's reported that Trump has offered to remove tariffs on, instead of raising it using section 232 national security as excuse, on EU car imports. That's in condition that EU will also remove tariffs on US cars to the EU.
German Chancellor Angela Merkel also sounded supportive but she obviously had her own version. The EU is reported to be working on a "plurilateral agreement" to reduce tariffs to between largest car supplies including the US, South Korea and Japan. Such agreement could be struck without involving all of WTO members while avoid breaking the WTO rules. European Commission President Jean-Claude Juncker bring forward a proposal to the US later in the month. And such a position is likely the preferred one of EU officials for the time being. While there are still huge differences, there is at least some chance of an agreement.
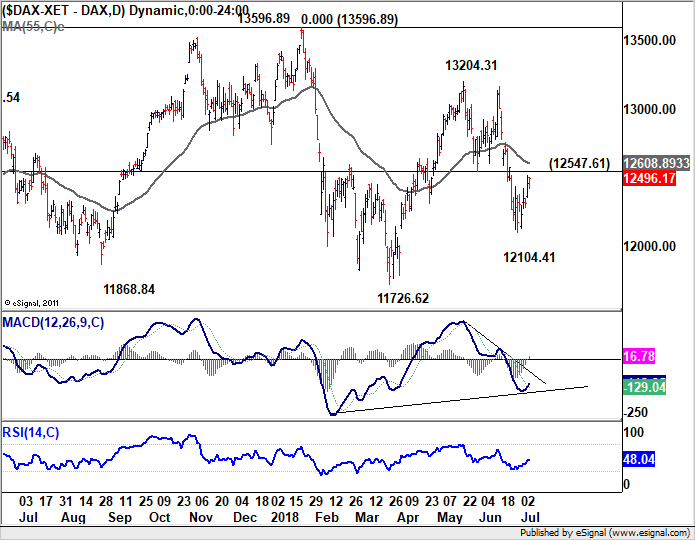
Strong rebound in DAX also indicates short term bottoming at 12104.41. Initial focus is back on 12547.61 support turned resistance. Firm break there will indicate completion of fall from 13204.31 and bring stronger rebound back to this level. For now, at least, favor is to range trading between 11726.62 to 13596.89, rather than a medium term corrective down trend.
Asian markets monitor if China SSE could defend 2700
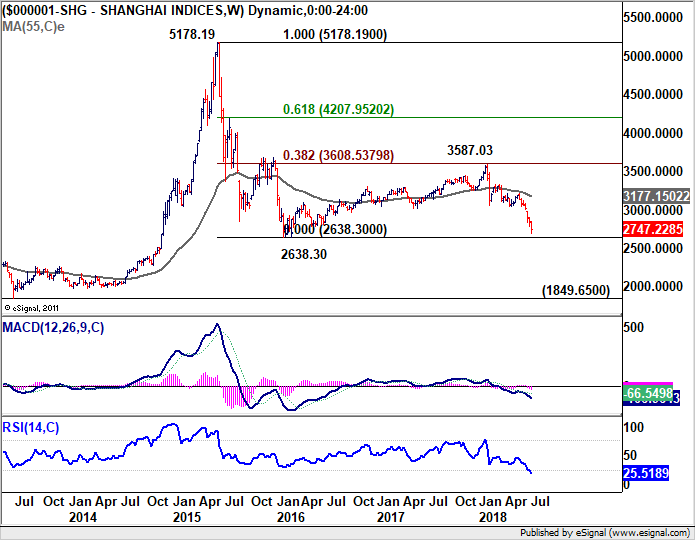
In Asian markets, that's another story. The steep selloff in the Shanghai since the so-called trade negotiation with the US collapsed showed that the markets are pessimistic on the impact on the Chinese economy. Reactions in Nikkei, HSI and even Kospi showed there would be a certain extent of spillover to other Asian countries. China has attempted to find an alliance in EU against US protectionism but hit a wall. Since the G7 drama, the EU and Canada have repeatedly said they would work with "like-minded" partners on preserving the multilateral rules-based system but China is certainly not one of them. Though, the SSE is has dipped into key support zone of 2016 low at 2638.30 and 2700 psychological level. Chance for government intervention has increased notably, which could give Asian stocks some support. Let's see.
New Zealand Dollar ended higher on technical rebound
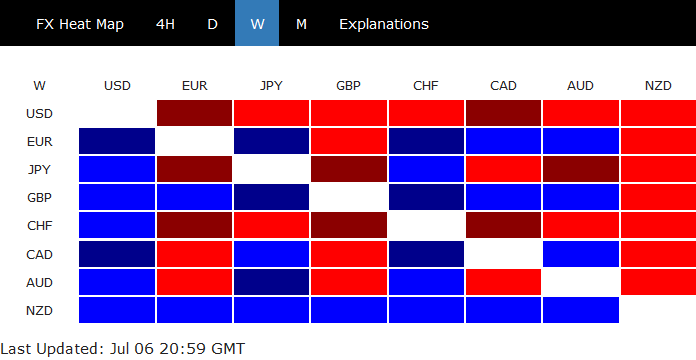
In the currency markets, New Zealand Dollar ended broadly higher, as the strongest one for the week. But it's more a technical rebound then anything, which is also reflect as it's limited below prior week's high against all others. Sterling was the second strongest one after a hat-trick of PMI upside surprise. BoE Governor Mark Carney's speech also showed he's confident that economy will develop as expected in recent inflation report. The chance of an August BoE rate hike is back on the table. Euro followed as the third strongest as supported by the above mentioned news on auto tariffs. Also, there were reports that some ECB officials were not happy as markets only priced in a full hike by December 2019, that's too late.
On the other hand, Dollar ended as the weakest one as recent consolidation continued. There was practically no change in Fed rate path expectations. Fed funds futures are pricing in around 80% chance of a September hike and around 50% of another one in December. However, 10 year yield dipped lower as recent consolidations extended. Gold is trying to bottom around 1236. These two are factors dragging down the greenback. Swiss Franc and Yen followed as the second and third weakest ones.
Dollar index extends near term correction, 93.19 support to hold
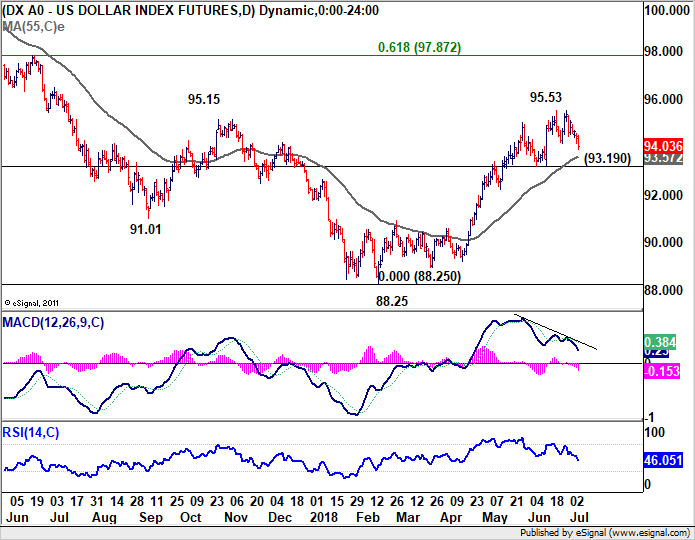
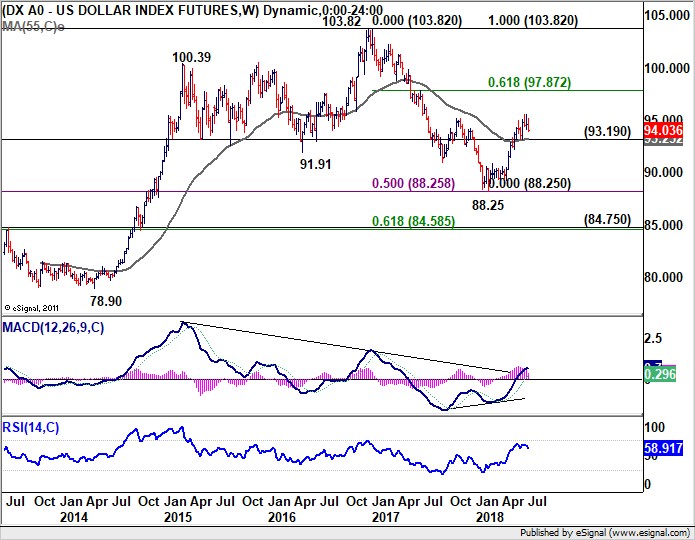
Dollar index's corrective pull back from 95.53 short term top extended last week and further fall would be seen to 55 day EMA (now at 93.57). But we'd continue to expect strong support from 93.19 to contain downside to bring rally resumption. Rise from 88.25 medium term is expected to extend to 61.8% retracement of 103.82 (2017 high) to 88.25 (2018 low) at 97.82. However, firm break of 93.19 will be a rather bearish signal and could bring retest of 88.25 low.
Gold bottomed in near term, recovery to extend
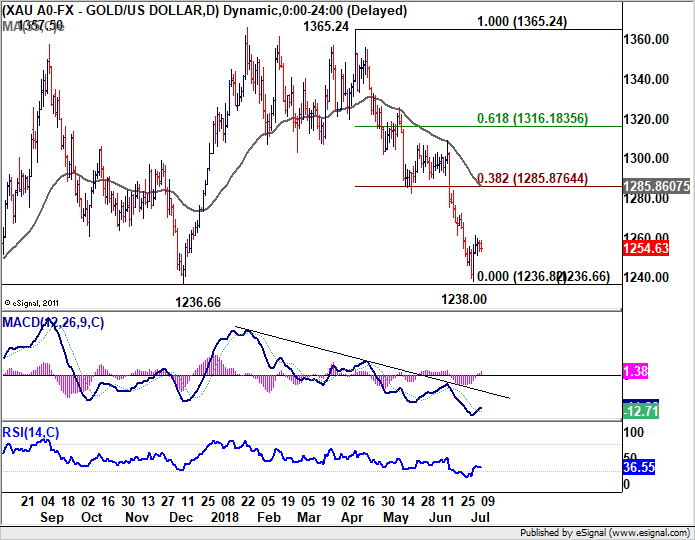
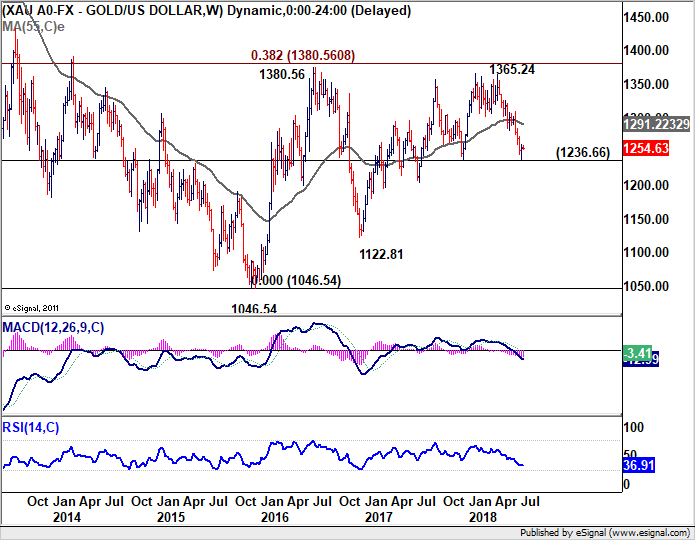
Gold's rebound last week indicates short term bottoming at 1238.00. Considering that it's close to 1236.66 key support level. stronger rebound is likely in near term. But upside should be limited by 38.2% retracement of 1365.24 to 1238.00 at 1286.60 to bring fall resumption. There are various way to interpret price actions from 1046.54 (2015 low). But in any case, for now, gold is in favor to drop further to 1046.54/1122.81 support zone in medium term.
GBP/USD Weekly Outlook
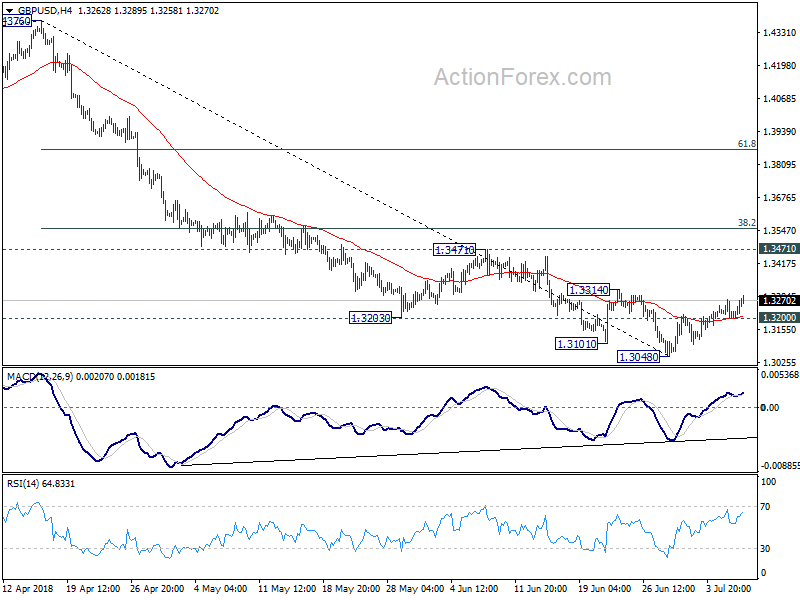
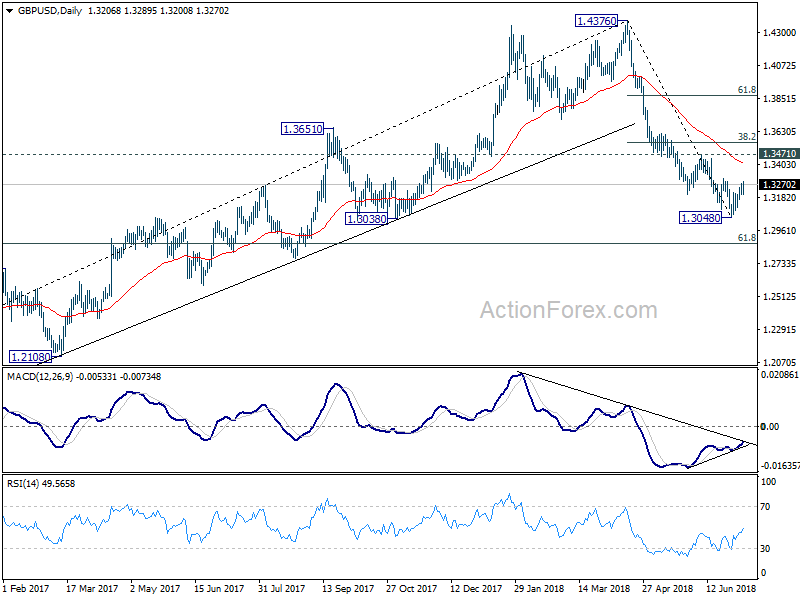
GBP/USD's rebound from 1.3048 extended higher to 1.3289 last week. The support from 4 hour 55 EMA argues that's 1.3048 is a short term bottom and rebound from there would be stronger than originally expected. Initial bias is on the upside this week for 1.3314 resistance first. Break will target 1.3471 resistance next. We'll expect strong resistance from 1.3471 to limit upside. On the downside, though, below 1.3200 minor support will turn bias to the downside for retesting 1.3048 low.
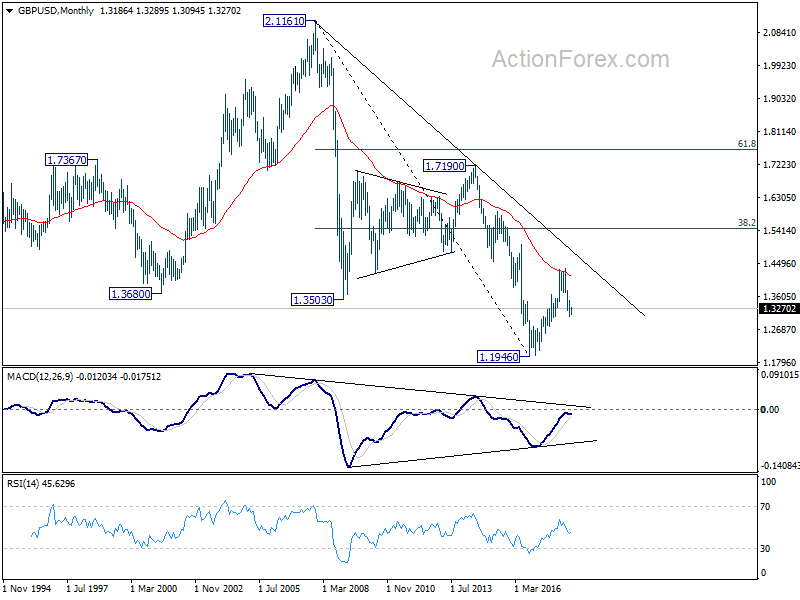
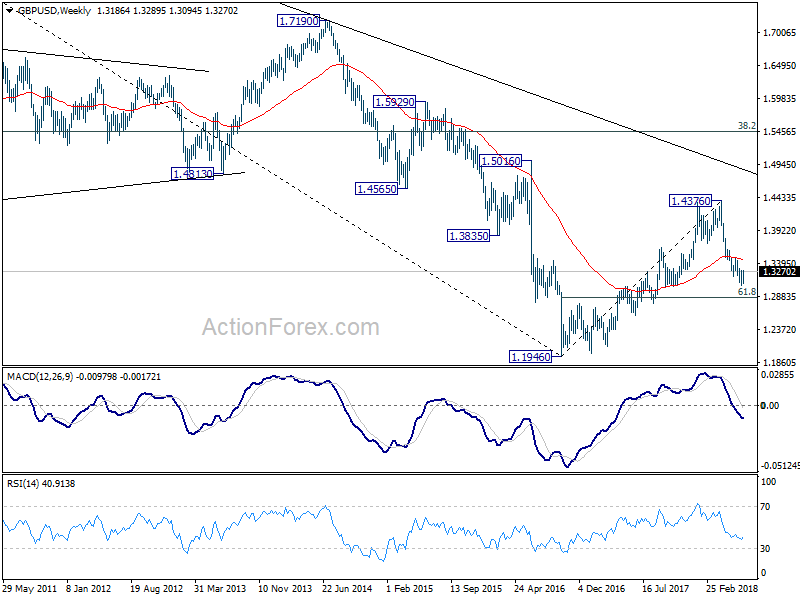
In the bigger picture, whole medium term rebound from 1.1936 (2016 low) should have completed at 1.4376 already, after rejection from 55 month EMA (now at 1.4179). Fall from 1.4376 should extend to 61.8% retracement of 1.1936 (2016 low) to 1.4376 at 1.2874 next. We'll pay attention to the reaction from there to asses the chance of long term down trend resumption. On the upside, sustained break of 38.2% retracement of 1.4376 to 1.3048 at 1.3555 is needed to indicate medium term bottoming. Otherwise, outlook will remain bearish in case of strong rebound.
In the longer term picture, rise from 1.1946 (2016 low) is viewed as a corrective move, no change in this view. Rejection from 55 month EMA argues that it might be completed already. Larger down trend from 2.1161 (2007 high) could extend to a new low. This will now be the preferred case as long as 1.4376 resistance holds.
Summary 7/9 – 7/13
Monday, Jul 9, 2018
[php_everywhere instance="1"]
Tuesday, Jul 10, 2018
[php_everywhere instance="2"]
Wednesday, Jul 11, 2018
[php_everywhere instance="3"]
Thursday, Jul 12, 2018
[php_everywhere instance="4"]
Friday, Jul 13, 2018
[php_everywhere instance="5"]
Weekly Economic and Financial Commentary: All Signs Point to Stronger Second Quarter GDP Growth
U.S. Review
All Signs Point to Stronger Second Quarter GDP Growth
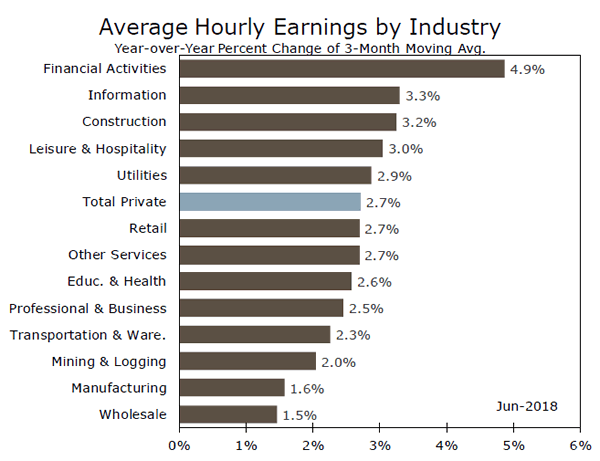
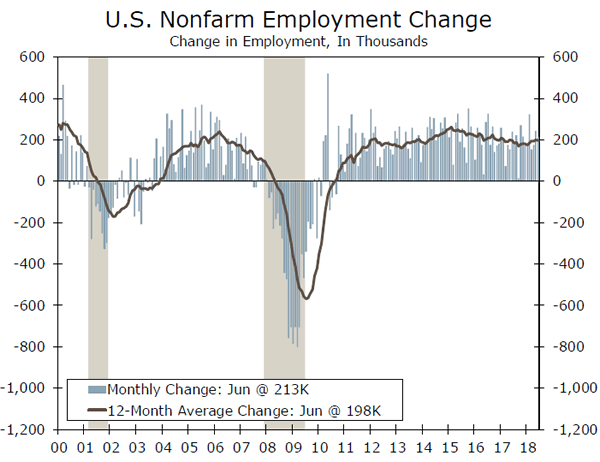
- Employers added 213,000 new jobs in June. The unemployment rate ticked up to 4.0 percent on an increase in labor force participation. Average hourly earnings grew 0.2 percent in June and are up 2.7 percent year-over-year.
- Manufacturing activity remained strong in June, as the ISM manufacturing index increased to 60.2. The production and employment indices were solid, while new orders remained elevated. Prices paid continue to rise at a solid clip.
- The trade balance narrowed to $43.1 billion in May as exports jumped 1.9 percent ahead of new tariffs. Imports also rose 0.4 percent.
All Signs Point to Stronger Second Quarter GDP Growth
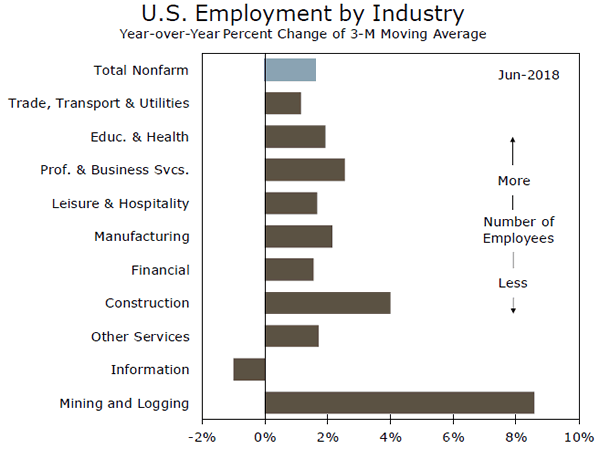
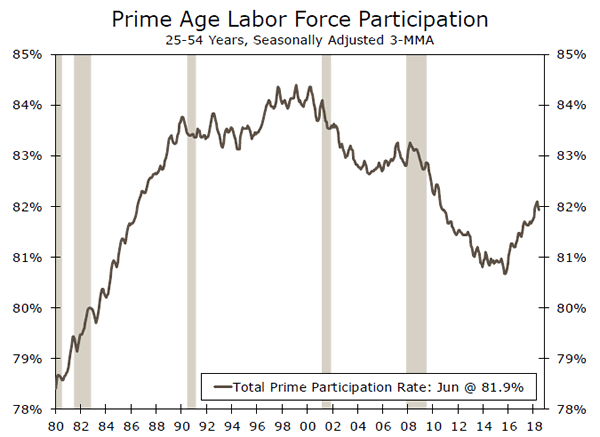
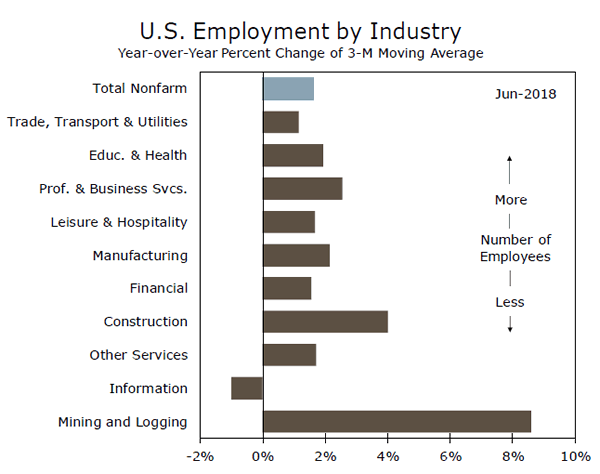
The labor market remained hot in June. Employers added 213,000 new jobs, while May's gain was revised up to 244,000 from 223,000. Gains in June were broad based, with most industries adding jobs over the month. The unemployment rate ticked up to 4.0 percent; however, the upward movement was due to a 0.2 percentage point increase in the labor force participation rate. Meanwhile, average hourly earnings increased 0.2 percent for the month and 2.7 percent on a year-over-year basis.
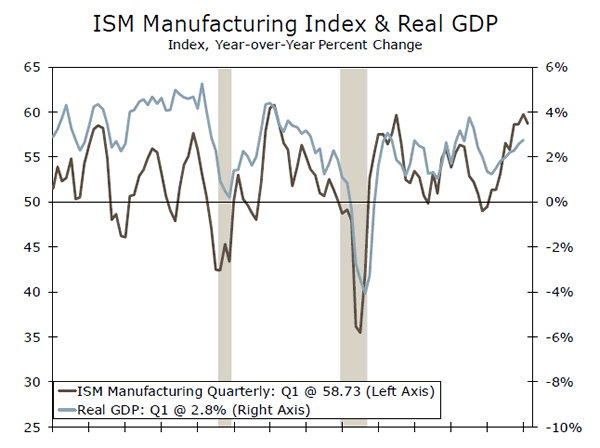
Activity in the factory sector remained strong in June as the ISM manufacturing index increased to 60.2. The production and employment indices displayed solid gains, further evidence that Q2 GDP is on track for above 4 percent growth. There was also little evidence of tariffs having an effect on the manufacturing sector in June. The new orders index fell slightly for the month; however, it remains elevated, with 16 of the 18 indices reporting growth in new orders. Manufacturing firms, however, continued to report supply chain bottlenecks that may be limiting production and putting upward pressure on prices. The prices paid measure also came in at 76.8 in June, in-line with the six-month average and a signal that input costs continue to rise.
Factory orders also increased 0.4 in May. Nondurable goods orders accounted for much of the gain and jumped 1.1 percent. Core capital goods orders were also revised up to a 0.3 percent gain from an initially-reported decline. While factory orders in May were stronger than expected, equipment spending has fallen below the double-digit pace registered in the second half of 2017. Despite the downshift, equipment investment should remain additive to second quarter GDP growth.
Activity outside of the manufacturing sector also picked up in June, as the ISM non-manufacturing index expanded to 59.1. New orders increased, while current business activity also strengthened. Supplier delivery times and backlogs moderated somewhat in June, but capacity constraints appear to remain in place. The prices paid index also came in above 60 for the sixth consecutive month. While the employment index fell to 53.6, June's rise in the overall index is consistent with a solid second quarter rebound in real GDP growth.
Construction spending increased 0.4 percent in May, falling slightly short of expectations. However, spending remains on solid footing and is up 4.3 percent year-to-date through May. The monthly gain was due to a 0.8 percent increase in residential expenditures, as multifamily, single-family and improvement spending all increased in May. Meanwhile, nonresidential outlays grew 0.1 percent, with public sector spending rising 0.7 percent and private spending falling 0.3 percent.
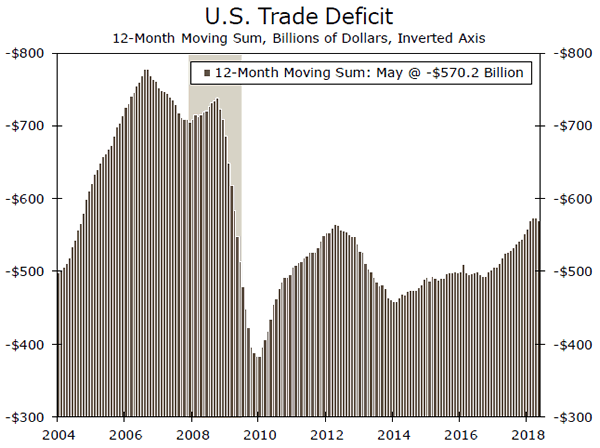
The trade balance narrowed to $43.1 billion in May. Exports looked to have jumped in anticipation of new tariffs and increased 1.9 percent. Imports also grew 0.4 percent for the month. With the trade gap falling for the third consecutive month, we expect trade to be a substantial boost to the second quarter GDP.
U.S. Outlook
JOLTS • Tuesday
The number of job openings rose above the number of unemployed workers in April for the first time, in a sign of an ever-tightening labor market. Job openings increased to 6.70 million, a record high since the series began in December 2000. There appears little reprieve in sight for employers facing difficulty hiring workers.
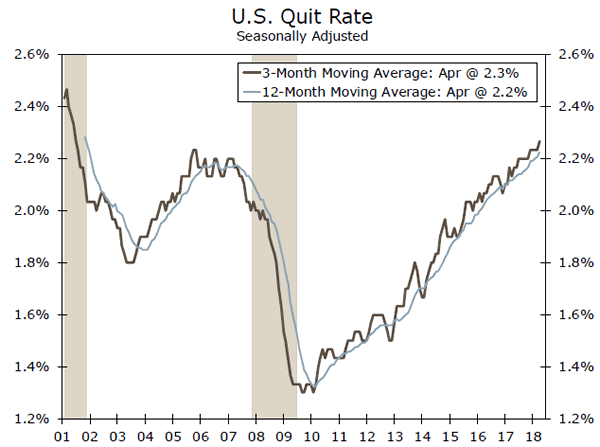
Quits stayed constant in April as a share of total employment. The volume of quits indicates confidence in the job market on the part of workers and signals upward pressure on average wages; job switching tends to reflect individuals moving up the job ladder to higher-paying positions. After being stuck between 2.1 percent and 2.2 percent for most of 2016 and 2017, the quit rate has jumped up to 2.3 percent. We will be watching the quit rate in the May release for further indication that employers are increasingly poaching employees from other firms and as an early signal of faster wage growth.
Previous: 6.70 Million Consensus: 6.66 Million
Consumer Price Index • Wednesday
The consumer price index (CPI) rose 0.2 percent in May and is up 2.8 percent year-over-year, boosted in part by higher gasoline prices. Higher core services prices mean that the core index (ex-food and energy) is also exhibiting strength, up 0.2 percent in the month and 2.2 percent over the year. On a 12-month basis, the headline and core are growing at the fastest rate in at least a year.
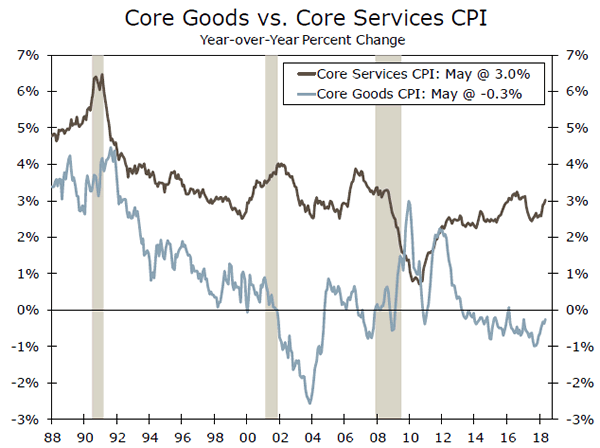
Divergence between core services and core goods price growth has continued even as inflation broadly picks up. Core services prices rose 0.3 percent in May while core goods declined 0.1 percent for a third consecutive month. This means that all the growth in core CPI is due to the services side, which was supported in April by another solid increase in shelter costs. Core goods prices were weighed down by drops in household furnishings and used auto prices. We expect headline and core CPI to be up another 0.2 percent in June.
Previous: 0.2% Wells Fargo: 0.2% Consensus: 0.2% (Month-over-Month)
Import Prices • Friday
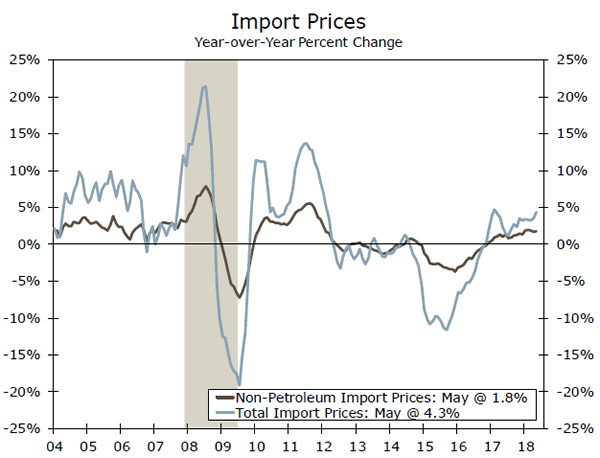
Import prices rose 0.6 percent in May, in large part due to higher fuel prices. Excluding fuels, prices rose a more muted 0.2 percent. So far this year, a stronger dollar and softening in global growth have dampened import price inflation, which was running as high as 0.5 percent ex-fuels in January. The strongest growth in May by enduse category came from industrial supplies prices, while prices for capital goods and automotive parts declined. We expect import prices to have advanced 0.2 percent in June, bringing year-over-year growth up to 4.8 percent.
Tariffs are not included in the import price index, since they are added on later. However, recent flattening in the underlying pace of import price growth should help ease the final cost burden to purchasers of imports when tariffs are applied. Steel and aluminum tariffs were extended to the European Union, Mexico and Canada on June 1 and tariffs on $34 billion of Chinese goods took effect July 6.
Previous: 0.6% Wells Fargo: 0.2% Consensus: 0.1% (Month-over-Month)
Global Review
Trade Tensions Simmer Amid Quiet Data Week
- Purchasing manager index data from the United Kingdom were generally solid, with measures of construction and manufacturing activity rising slightly.
- The Reserve Bank of Australia elected to hold its main policy rate steady at its July meeting as low-wage growth, high household debt levels and rising trade tensions prevent a turn toward tightening.
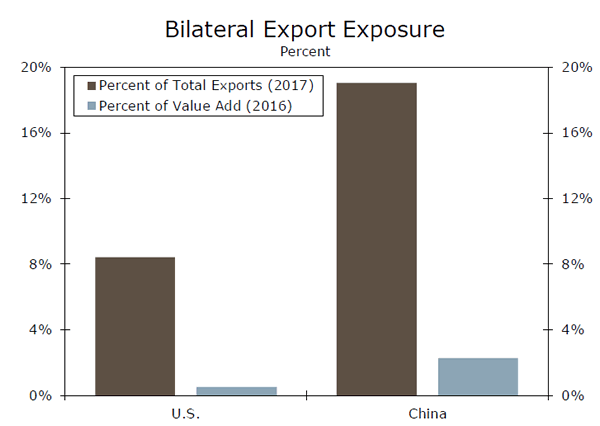
- Finally, several of the much-hyped tariffs went into place this week, including 25 percent tariffs on $68 billion worth of bilateral trade between China and the United States.
Trade Tensions Simmer Amid Quiet Data Week
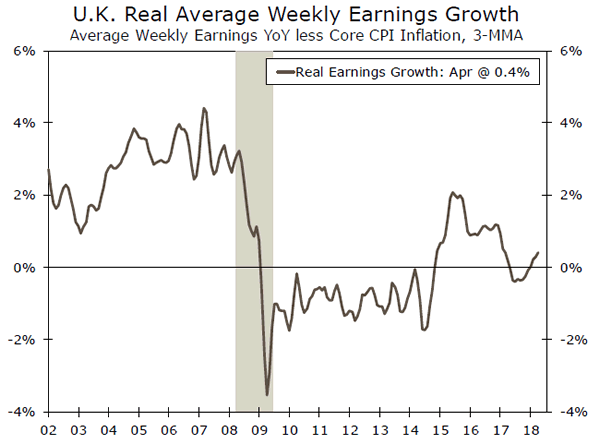
It was a relatively quiet week of international economic data amid the Fourth of July holiday in the United States. Purchasing manager index data from the United Kingdom were generally solid. The U.K. manufacturing PMI halted a streak of five straight monthly declines in May, and data released this week showed another small increase in the breadth of factory sector activity in June. Similarly, the U.K. PMI for construction rose to 53.1 in June, up from a low of 47.0 in March. Sluggish output in the manufacturing and construction sectors contributed to the meager 0.2 percent (not-annualized) pace of real GDP growth in Q1. Although growth appears far from robust in Q2, real GDP growth appears to be picking up speed rather than sliding into negative territory. Receding inflation is helping push real income growth higher, providing a tailwind to growth (top chart).
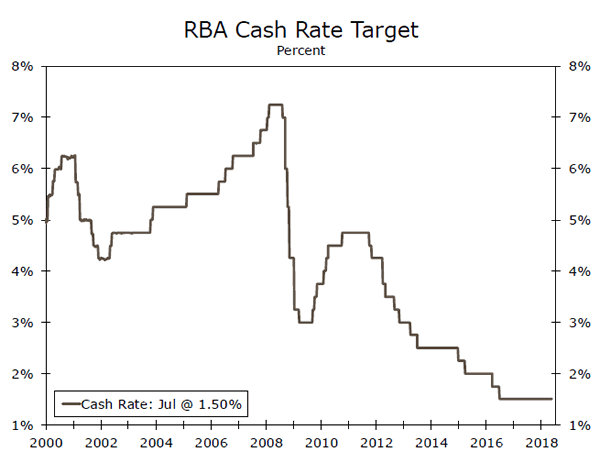
The Reserve Bank of Australia (RBA) kept its main policy rate unchanged at 1.50 percent at its July monetary policy meeting (middle graph). Unlike many other developed economy central banks, the RBA has refrained from tightening policy thus far. Unemployment is falling but is still nearly two percentage points higher than its pre-recession low. With little evidence of longawaited wage growth, rising global trade tensions and elevated levels of household debt, there is no strong impetus for the central bank to tighten policy at this point. The housing market appears to be correcting on its own, as home prices have fallen in eight consecutive months through June. We expect the RBA to eventually raise rates, but not until there is greater evidence of higher wages and inflationary pressures.
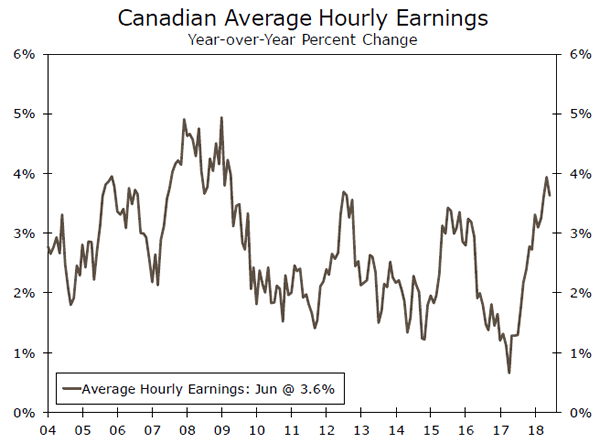
Canadian employment growth strengthened in June as employers added 31,800 jobs, the most since March. Full-time and part-time employment rose, the first time this has occurred in 2018. Goodsproducing industries added a robust 46,600 jobs, but wage growth, which had been rapidly gathering steam over the past few months, took a step back (bottom chart).
Finally, several of the much-hyped tariffs went into place this week. On July 1, Canada responded to U.S. steel and aluminum tariffs by implementing tariffs of 10-25 percent on $12.6 billion of American goods, including U.S. steel and aluminum. This morning, the United States implemented tariffs of 25 percent on $34 billion of Chinese goods, with China responding in-kind. Of the original $50 billion tariff threat made by the United States, $16 billion are still pending public comment and review and could go into effect in the near future.
As we have written previously, the direct threat to the U.S. economy from the tariffs enacted so far is relatively low. The roughly $20 trillion U.S. economy is primarily a service-oriented, consumption-based economy whose total output is predominantly derived from domestic demand. However, the threat of further contagion on the trade war front is clearly rising. In addition, the second-order effects, such as a potential decline in the stock market and corresponding fall in household net worth/consumer confidence, are another threat that could compound the direct effect on growth from a full-blown trade war.
Global Outlook
Bank of Canada Rate Decision • Wednesday
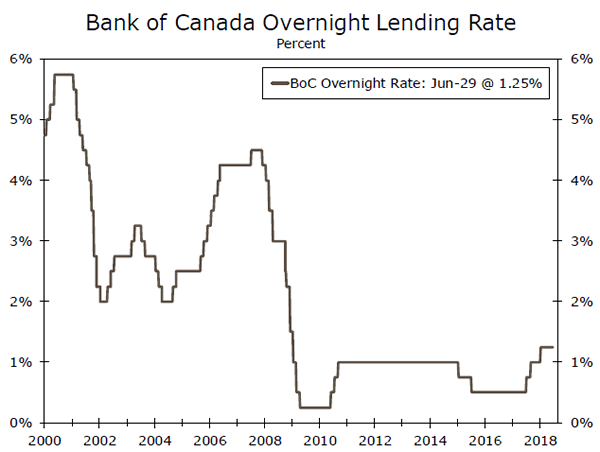
The Bank of Canada (BoC) has maintained its overnight lending rate at 1.25 percent since last hiking it 25 bps in January. Although real GDP growth slowed slightly in Q1, data released thus far in Q2 shows that the Canadian economy continues to pick up speed. Real GDP rose 0.1 percent in April, and average hourly earnings increased 3.5 percent in June following a 3.9 percent increase in May, the fastest pace of growth since 2009. Inflation also remains on target, and should support continued tightening by the BoC. While high levels of household debt and ongoing trade uncertainties remain concerns for the economy, the backdrop of solid overall economic growth should prove a tailwind for further rate hikes from the BoC.
The BoC's May 30 meeting statement was moderately more hawkish in tone, and along with solid incoming economic data thus far in Q2, we believe the BoC will raise rates 25 bps next week and once more before the end of 2018.
Previous: 1.25% Wells Fargo: 1.50% Consensus: 1.50%
Bank of Korea Rate Decision • Thursday
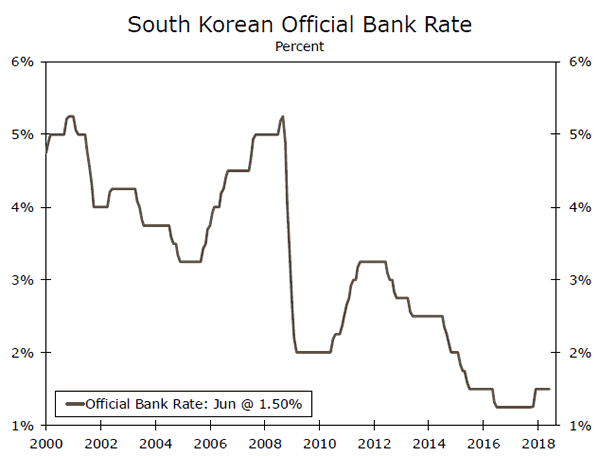
The Bank of Korea (BoK) has remained on hold since raising its key lending rate 25 basis points for the first time in six years this past November. Although economic growth remained solid in Q1, with real GDP rising 2.8 percent year over year, slowly rising inflation and ongoing trade policy uncertainties are likely to continue to restrain a more rapid pace of rate hikes from the BoK. Domestically, the consumer price index has remained below 2 percent since mid-2017, rising just 1.5 percent most recently in June, year over year. Internationally, trade disputes between the United States and China also present a risk to more rapid action from the BoK, as South Korea has an export-oriented economy and China is its top export market.
The consensus looks for the BoK to again remain on hold at next week's meeting. Should inflation move back toward target and trade concerns continue to only lurk in the background, the BoK could be better positioned to hike rates, as long as overall growth follows suit.
Previous: 1.50% Consensus: 1.50%
Eurozone Industrial Production • Thursday
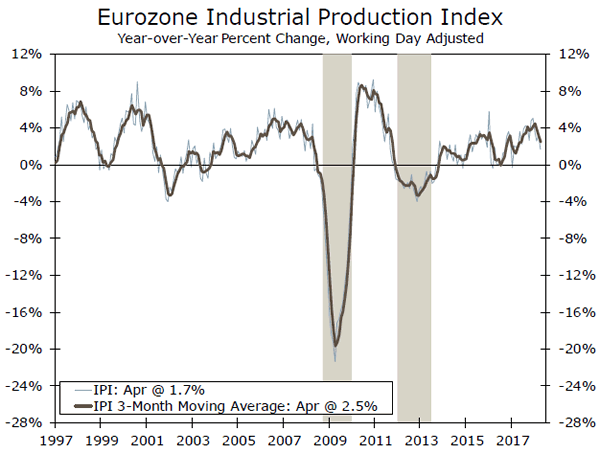
Industrial production in the Eurozone fell 0.9 percent month-overmonth in April, reversing March's 0.6 percent increase. Industrial production has been lackluster so far this year, in line with the general slowdown in overall economic growth registered in the Eurozone in Q1. Real GDP expanded a more modest 0.4 percent in the quarter, restrained in part by slower growth in gross fixed capital formation, which could also weigh on industrial output in subsequent quarters. Data released earlier this week also showed that the Eurozone manufacturing PMI continued its decline seen so far this year, falling 0.6 points to 54.9 in June.
That said, we still look for the expansion in the Eurozone to remain intact after what we view as only a temporary slowdown in Q1. The consensus looks for industrial production to rebound in May, which supports the potential for the industrial sector to regain some of its momentum in the second half of the year.
Previous: -0.9% Consensus: 1.2% (Month-over-Month)
Point of View
Interest Rate Watch
Watching and Waiting–FOMC
This week's FOMC meeting minutes highlight the issue of inflation—watching and waiting. From the earlier ISM manufacturing release this week we also have some leading indicators of the inflation issues and possible trade complications facing the FOMC.
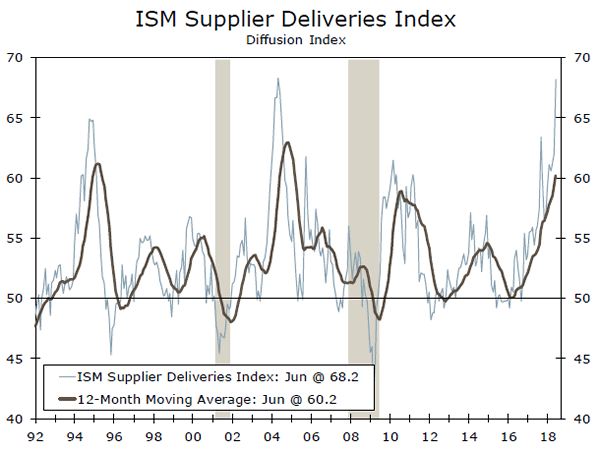
Supplier Deliveries–Supply Side Pressures
From the ISM report we saw a jump in the supplier deliveries index (top graph). This index signals a rise in the delay to deliver products. Moreover, the prices paid index came in at 76.8 which is slightly above the Q1-2018 average of 75.0. These indices indicate significant upward pressure on prices for manufacturers going forward. Our outlook is for producer prices paid on final demand products to rise in 2018 at a 2.7 percent annual pace compared to 2.3 percent in 2017. This will provide an upward bias to consumer prices in 2018 as well. This will keep the FOMC on a path to raise the funds rate in September.
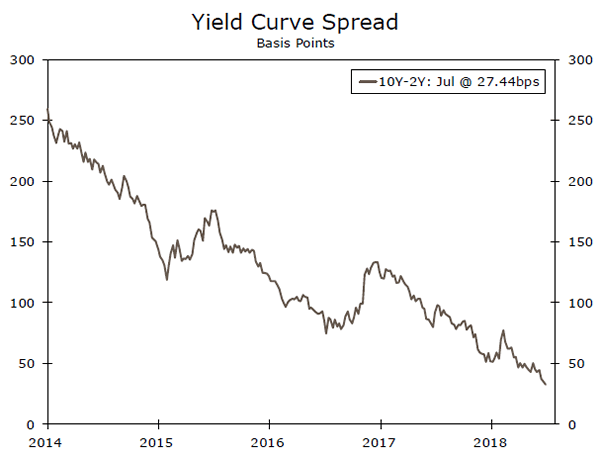
FOMC: "What a flattening of the yield curve might signal"
For us, the yield curve (middle graph) is only one factor in our recession/economic outlook and is neither a sufficient nor necessary condition for a recession pronouncement. First, we have had a recession without an inverted yield curve so the inverted yield curve is not sufficient on its own to signal a recession. Second, there are several factors that have a better forecast record of a recession. For our preferred gauge of recession predictability, please see our analysis on the topic.
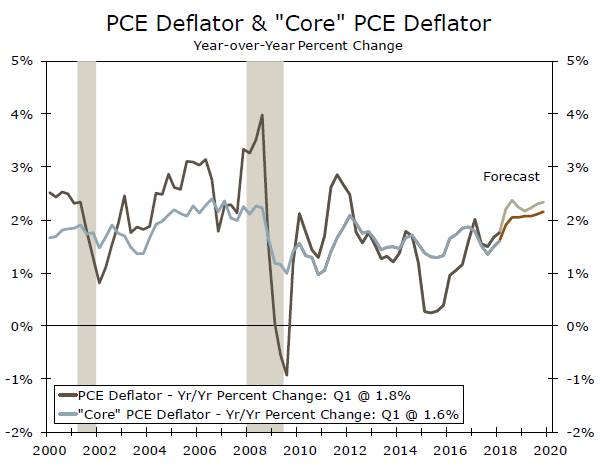
Rising Inflation, Rising Rates
The FOMC meeting minutes disclosed an interesting dynamic of sustained inflation conditions which could warrant a gradual increase in the federal funds rate above the long-run estimate (2.8-3.0 percent). As depicted in the bottom graph, we suspect core PCE to stay at 2.0 percent this year, followed by a modest overshoot of the target rate in 2019. With inflation back at target, we suspect the Fed to continue on path and raise rates two more times this year and two times throughout 2019.
Credit Market Insights
Rise in Mortgage Debt Outstanding
Commercial and multifamily (C&M) mortgage debt outstanding increased $51.2 billion in Q1 to $4.1 trillion (1.2 percent). After slowing in the first half of 2017, the year-ago growth rate has picked up in the past two quarters, reaching 6.7 percent in Q1. Multifamily mortgage debt continued to grow at a fast clip, up 9.3 percent over the year. Meanwhile, commercial mortgage debt outstanding rose 5.5 percent in Q1, versus 4.9 percent in Q4.
Life insurance companies added the most to their C&M mortgage debt holdings, while issuers of asset-backed securities (ABS), banks and governments also increased their holdings moderately. After consistent declines in commercial mortgage-backed securities following the financial crisis, the mortgage debt holdings of ABS issuers remain almost 50 percent below their level at the end of 2007.
According to the April Senior Loan Officer Opinion Survey, banks loosened standards on commercial real estate loans in Q1, but a modest net share tightened standards for multifamily. On net, banks reported easing lending standards on commercial real estate (CRE) loans over the past year, compared to net tightening in 2016. Banks cited more aggressive competition from lenders and a more favorable/less uncertain outlook for CRE fundamentals (property prices, vacancy rates, etc.) as reasons.
Commercial mortgage delinquency rates remained at 0.75 percent in Q1, the lowest level since the Federal Reserve Board began recording the series in 1991.
Topic of the Week
If Not Raising Wages, Then What?
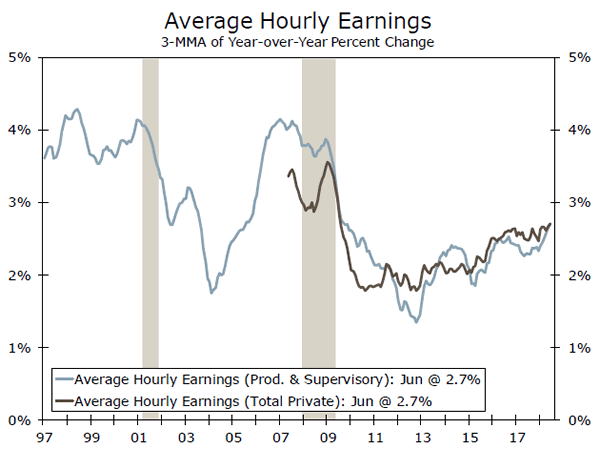
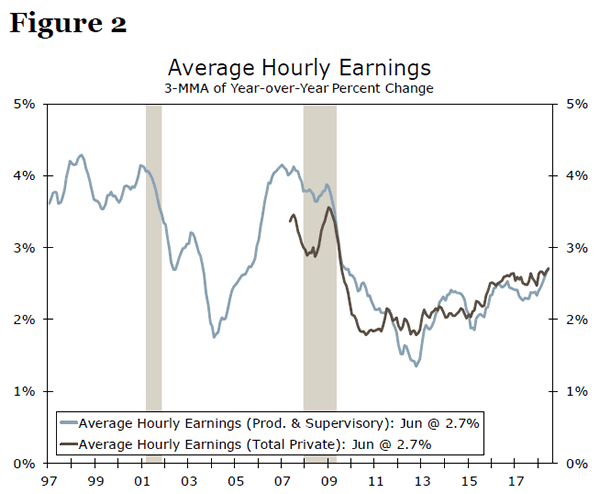
Currently, there is less than one unemployed person per job opening. The unemployment rate fell to 3.8 percent in May, matching its lowest point since 1969, though it ticked up slightly in June. Conventional economic theory suggests that employers should be raising pay to attract increasingly scarce labor. Employers, however, appear reluctant to commit to higher wages and salaries, which account for the largest share of employee compensation and are notoriously difficult to cut. Average hourly earnings growth has picked up since the early years of the expansion, but has yet to breach 3 percent (top chart).
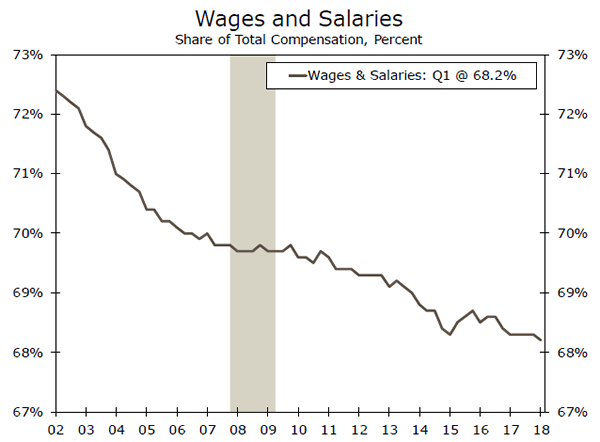
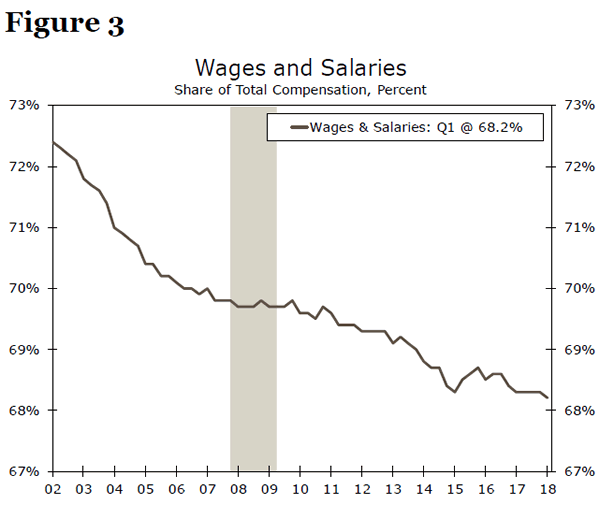
One issue with the most closely watched measure of wage growth—average hourly earnings (AHE)—is that it looks at compensation through a narrow lens. AHE only captures regularly paid wages & salaries and excludes benefits, though these have grown to nearly one-third of labor costs (bottom chart). Employers have long used benefits as a method to attract workers when they are unable or unwilling to raise wages, and appear to be pursing this strategy at present. Over the past year, benefits costs per hour worked have risen 3.3 percent versus a 2.8 percent increase in wages & salaries. Leading the charge in benefits growth has been one-time bonuses for workers, which are up 13 percent over the past year and account for a record-high share of compensation. More employers are also offering access to perks such as paid leave and wellness programs.
As fewer workers with highly-desirable skillsets are left unemployed, hiring managers are having to look farther afield and "down-skill" to fill open positions, which is likely holding back wage growth. Employers may be willing to raise wages or benefits for workers who are already qualified for a job, but not as much for workers with less relevant or recent experience. About a quarter of firms in a 2017 Federal Reserve survey of small businesses reported loosening job requirements or offering more training to address lack of qualified workers. Employers are also increasingly hiring workers with criminal histories and from other population subsets where more labor market slack remains.
The Weekly Bottom Line: China Tariffs Likely to Impede Economic Momentum
U.S. Highlights
- A holiday-shortened week was nevertheless chock-full of data releases that confirmed the U.S. economy continues to expand at a strong above-trend pace.
- Economic activity remains robust, but there are signs that trade uncertainty may be impeding further improvement.
- Tariffs on $34 billion in goods from China, and on U.S. goods to China, take effect today. Although these tariffs remain a downside risk to our economic outlook, further escalation could prove direr.
Canadian Highlights
- The holiday-shortened week was a very busy one for investors in Canada, with global political developments and economic data to digest ahead of the Bank of Canada monetary policy decision next week.
- Sentiment was soured by softer oil prices, related to higher Saudi production, as well as rising trade tensions between Canada's two most important trade partners, as the U.S. implemented additional tariffs on Chinese exports.
- Job growth was solid, but wages decelerated and unemployment rose on labour market influx. The trade deficit widened, but largely due to transitory factors, while housing data indicated diverging dynamics: GTA seeing a rebound while GVA continued to correct. Overall, the data was good enough for a hike, but risks remain.
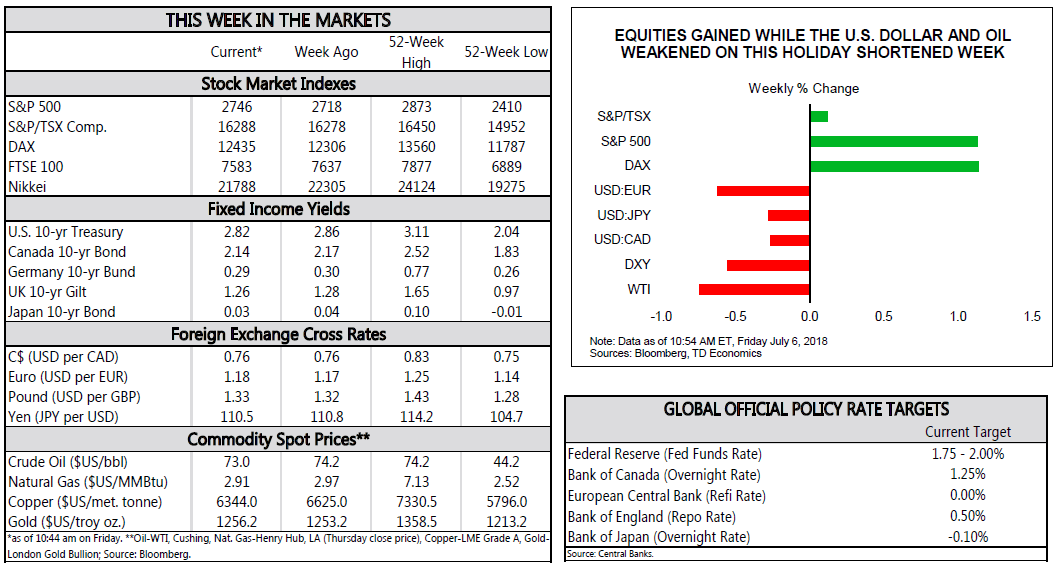
U.S. - China Tariffs Likely to Impede Economic Momentum
Although a holiday shortened week, it was nevertheless chock-full of data releases. Once again, this week's data flow confirms that the U.S. economy is continuing to experience a strong, above-trend expansion. That said, tariffs against China imports that take effect today, and reciprocal retaliatory tariffs by China on U.S. goods, could act to impede economic momentum.
Kicking off the week was a surprisingly strong headline print in the Institute of Supply Management (ISM) manufacturing survey for June. However, the details of the report revealed that not all is well in the manufacturing sector. The positive surprise was due to a surge in supplier deliveries, as trade-related uncertainty resulted in lead-time extensions for production materials, transportation delays, and component shortages. The ISM services survey also surprised to the upside on the back of a rebound in business activity and new orders. However, respondents expressed a fair degree of anxiety about trade-related uncertainty that is creating price volatility. Still, both surveys overwhelmingly relayed the theme of a strong U.S. economy heading into the second half of the year, but one in which unresolved challenges – namely labor shortages and new tariffs – could act to impede further improvement.
June new car sales continued the theme of strong U.S. demand. At 17.4 million units, car sales were above expectations of 17 million units, but still well below the 18 million unit pace from last June. The current pace of sales is largely in line with fundamentals, and tightening credit standards should continue to contain any further upside.
Lastly, this morning's payrolls data rounded out the positive data for the week. Non-farm payrolls rose by 213k in June, above market expectations for 195k. A strong increase in the labor force and an uptick in job seekers combined to push up the unemployment rate to 4.0%. Although usually associated with a weak economy, in this case a rising unemployment rate is a sign that strong job growth and rising wages is encouraging more people to enter the labor market, acting to further absorb what little labor market slack remains.
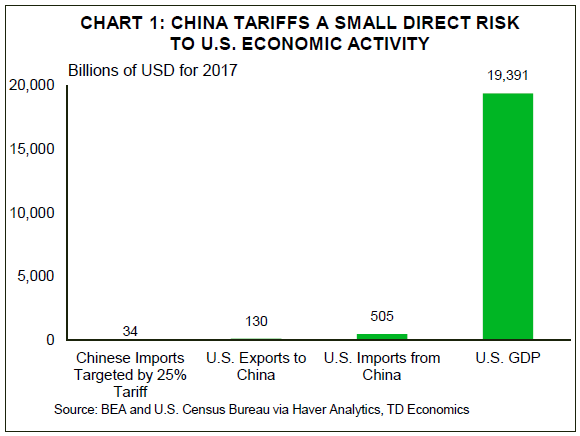
With the U.S. economy on such a solid economic footing it should be able to withstand some drag from escalating protectionist trade actions. Effective today, the U.S. has imposed a 25% tariff on $34 billion of annual Chinese imports of industrial machinery, aerospace, and transportation goods. China has retaliated in kind, largely against U.S. agricultural products, vehicles, and aquatic products. Another $16 billion in goods are expected to be targeted by tariffs by both sides in the coming weeks.
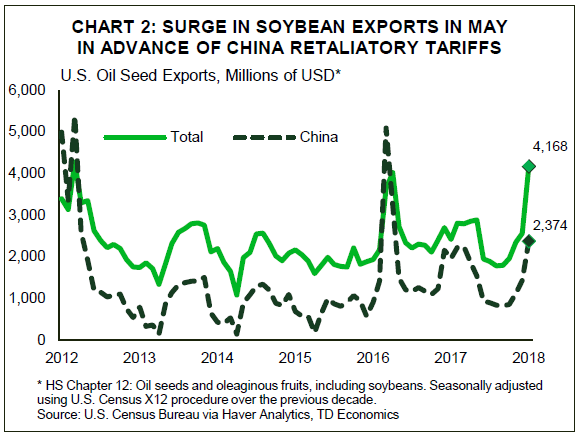
All told, the tariffs and counter-tariffs imposed by the U.S. and their trading partners, respectively, remain a downside risk to our U.S. and global economic growth outlook (Chart 1). Trade data are already showing signs that tariffs are affecting activity (Chart 2). An escalation in tensions, such as a 25% tariff on automotive imports, could ultimately cost the U.S. economy more than $100 billion in lost output, stoke inflation, and put about 250k jobs at risk. We remain hopeful that such a scenario never materializes, and that ongoing discussions between the U.S. and its major trading partners prove fruitful.
Canada - Good Enough For a Hike
The holiday-shortened week was a very busy one for investors in Canada, with global political developments and economic data to digest. Equities faded late in the week on oil prices, pushed lower on higher Saudi production and trade tensions, but a broad-based recovery took hold, with a positive end to the week looking like at the time of writing. The U.S. implemented additional $34bn in tariffs on Chinese exports taking relations to a new low and weighing on the greenback – down 0.5% on Friday vis-à-vis most majors.
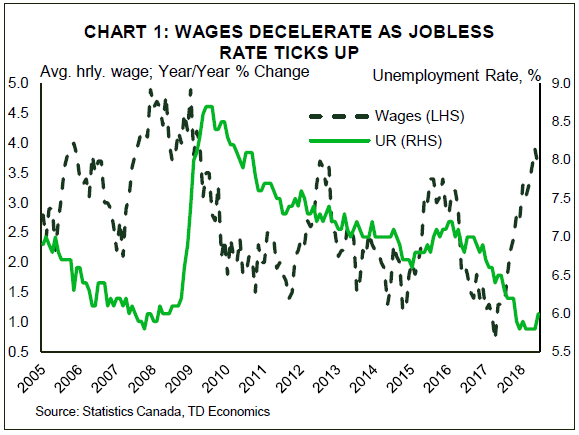
Escalating tensions between Canada's two most important trade partners weighted on sentiment, but economic data has so far remained intact. Hiring resumed in June with the Canadian economy adding 32k jobs last month. Gains were led by construction and manufacturing, while services disappointed, losing jobs on net for the first time in five months. Despite the job creation, unemployment ticked higher by 20bps to 6.0% as more than 75k people entered the labour force – a six year high. Average wages decelerated, down some 30bps, but at 3.6% y/y remains near a decade-high (Chart 1).
Canadian trade figures were less inspiring with the deficit in May widening to $2.8bn. Imports were up 1.7% and 1.2% in nominal and real terms, respectively. They were somewhat boosted by airliner and gasoline imports, but strength was broad-based across categories, indicative of healthy domestic demand. Exports, on the other hand were weak, remaining flat in nominal terms while volumes fell 1.0%. While much of the weakness was related to transitory factors including supply disruptions in automotive parts and work stoppages in iron mines, exports are unlikely to surge going forward. Alongside ongoing NAFTA uncertainty, the imposition of tariffs in June will have a severe impact on the Canadian metals industry, with potential for downstream effects a real risk.
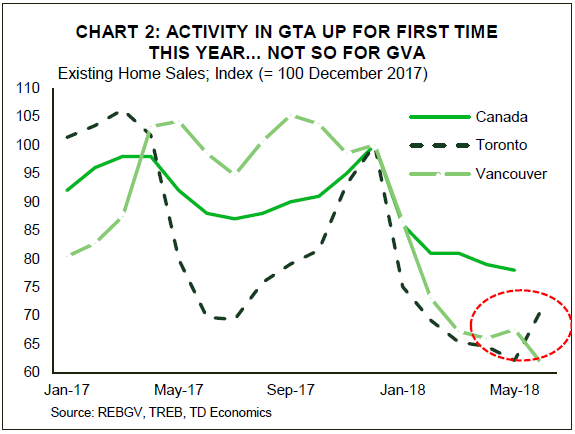
Another risk central to the Canadian economy is the housing market. This week we got June real estate board data for the two most closely watched markets in Canada. Figures from TREB suggested the recovery in the GTA market has begun in earnest. Sales rose for the first time this year (Chart 2), surging by nearly 18% in June according to TREB figures, but remaining well below historical norms. New listings, meanwhile, pulled back, helping rebalance the market. The tighter conditions led prices higher, with the HPI up about 0.2% while average prices rose over 3% - on account of increased activity in the most expensive single-detached segment. The GVA by contrast, saw both activity and new listings pull back around 10% apiece in June, according to REBGV figures. The decline in sales was the fifth in six months, with the softness manifesting in prices. The HPI was down 0.5% in June, the third consecutive decline and the weakest performance since late-2016, which also followed a provincial policy change.
Risks related to trade and housing will surely be top of mind for the Governing Council when it meets next week to discuss monetary policy. But, until they are seen as likely to materialize they will not drive monetary policy. This is set on incoming data and the outlook, which are relatively sanguine. From that standpoint, another 25 basis point hike next week is the most appropriate move.
U.S.: Upcoming Key Economic Releases
U.S. Consumer Price Index - June
Release Date: July 12, 2018
Previous: 0.2% m/m; core 0.2% m/m
TD Forecast: 0.3% m/m; core 0.2% m/m
Consensus: 0.2% m/m; core 0.2% m/m
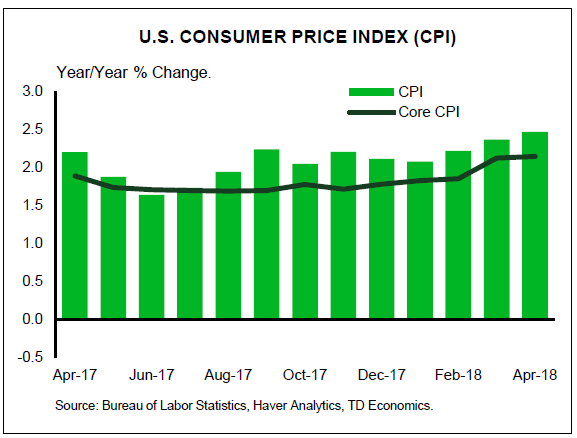
We expect CPI to hit 2.9% y/y in June, with prices up 0.3% m/m, while core inflation should rise to 2.3% on a 0.2% m/m increase. Steel and aluminum tariffs are unlikely to create a meaningful lift to goods categories but risks are generally tilted to the upside on the back of firmer imported consumer goods prices. Meanwhile, a rebound in shelter costs should underpin core services.
Canada: Upcoming Key Economic Releases
Canadian Housing Starts - June
Release Date: July 10, 2018
Previous: 195k
TD Forecast: 210k
Consensus: N/A
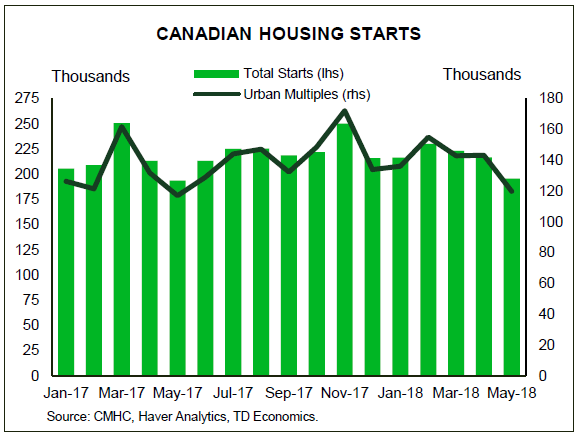
TD looks for housing starts to rebound to a 210k pace in June on a recovery in apartments and other multi-unit projects. Multifamily dwelling starts printed at a 12m low in May which flies against continued strength in building permits (through April) and strong demand in the resale market. On the other hand, we expect single family starts to decline in June following a steady grind lower in permit issuance.
Bank of Canada Rate Decision
Release Date: July 11, 2018
Previous: 1.25%
TD Forecast: 1.50%
Consensus: 1.50%
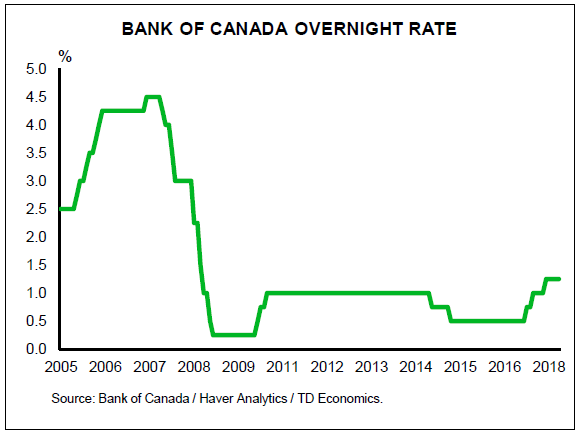
We expect the Bank of Canada to lift the overnight rate by 25 bps next week, which is broadly in line with consensus. The Bank's description of recent economic activity should be constructive which may give the communique a hawkish tinge, but we emphasize that the BoC will remain intensely data dependent going forward. As such, next week's communique will not constrain the Governor in September or October. Both growth and inflation have evolved roughly in line with the BoC's forecast from April, so we don't anticipate any significant changes in their economic outlook. Governor Poloz has stated that they will only incorporate announced trade measures into their projection and not the threatened auto tariffs, so the impact from trade uncertainty should be fairly small relative to prior assumptions. Still, the tightening path will remain very gradual, and if the economy decelerates into 2018H2 they could easily stay on the sidelines for the rest of the year.
Trade Uncertainty Hits Dollar’s Confidence
The US dollar fell against major pairs on Friday despite a strong June jobs report due to the impending start of tariffs against Chinese goods and the retaliation from the Asian nation on US exports. The US economy added 213,000 jobs and wages rose 0.2 percent but it is the threat of trade war escalation that put pressure on the US currency.The Canadian dollar advanced against its southern neighbour ahead of the Bank of Canada (BoC) rate statement on Wednesday. The BoC could hike rates to keep up with American interest rates. The weekend will bring a major showdown in England as Theresa May will present a soft Brexit strategy to her party that might prompt some of the more hardline Brexiteers to quit, jeopardizing May’s position as leader of the party.
- UK Manufacturing expected to bounce back
- Bank of Canada (BoC) to hike interest rate to 1.50%
- US inflation to keep rising at 0.2% m/m
EUR Rises on Zero Tariff and Stronger Data
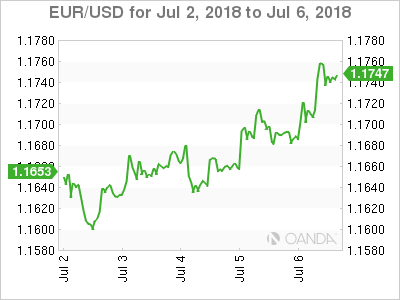
The EUR/USD gained 0.55 percent last week. The single currency is trading at 1.1738 as the USD is dragged down by a loss in confidence after the start of the tariffs on Chinese goods. The EUR had appreciated after reports pointed to a zero tariff on European autos and continued its upward trend as China announced its retaliation to the tariffs on Friday . The Trump administration is working on a $16 billion additional tariffs to be announced in the next two weeks.
German factory orders impressed on Thursday with a 2.6 percent gain and industrial production hit a 2.6 percent shocking gain with a low forecast of 0.3 percent. The USD was hit by the negative sentiment from investors as the first shots in a trade war are live. The European calendar will feature the German trade balance on Monday July 19 and the testimonies of European Central Bank (ECB) President Mario Draghi.
The U.S. Federal Reserve remains on track with two more rate hikes later in the year. US employment remains strong and even the rise in the unemployment rate translates to more people looking for jobs. The main hurdle for the dollar going forward will be geopolitics. The economy and the Fed are already priced in with global trade the biggest uncertainty.
Loonie Higher on Strong Jobs and Soft Dollar
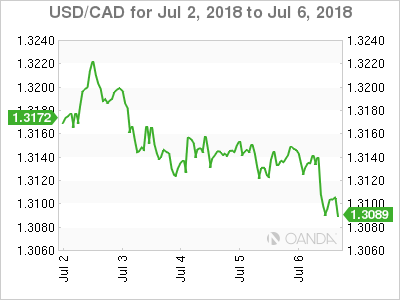
The USD/CAD lost 0.32 percent in the last five sessions. The currency pair is trading at 1.3092 and continues to hold under the 1.31 price level after a strong jobs report in Canada could be enough for the Bank of Canada (BoC) to announce a rate hike on July 11. Uncertainty on trade after the first shot in the US-China trade war was officially fired and promptly answered, will continue to pressure the loonie. Canada is no stranger to trade spats with the US and with the fate of NAFTA still up in the air will be looking to the Trump administration in any changes to its trade strategy.
Monthly GDP at the end of June surprised to the upside and with a positive business outlook added to a strong jobs report the Canadian central bank will be looking to close the gap with the U.S. Federal Reserve funds rate. Fed members have signalled that more rate lifts are coming and two have already been priced in. The BoC is in no hurry to hike, but there is pressure to act later in the second half of the year if it decides to hold in July.
Hawkish comments from BoC Governor Stephen Poloz are taken into consideration for the meeting next week which could end up with an interest rate of 1.50 percent, 25 basis points higher than the current rate.
GBP Rises as Softer Brexit Plan Moves Forward
The GBP/USD gained 0.62 percent this week. The currency pair is trading at 1.3259 after Theresa May won the approval for her new softer Brexit strategy. The showdown with the more eurosceptic opposition is finished and now the next step will be to present a paper next week. The plan envisions a UK-EU free trade area adopting the EU rules for goods.
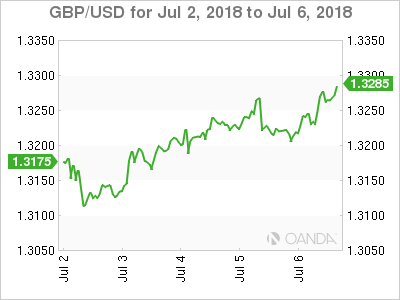
The pound will await the reaction from Brussels after reviewing the yet to be published document. The Bank of England (BoE) could offer some support for the GBP with a rate hike in August but only if economic conditions continue to improve. The political risk premium continues to be high as this was just a hurdle on the divorce between the UK and the EU. The GBP/USD will look to the 1.33 price level and beyond as more information is known during the week.
Market events to watch this week:
Tuesday, July 10
- 4:30am GBP GDP m/m
- 4:30am GBP Manufacturing Production m/m
Wednesday, July 11
- 10:00am CAD BOC Monetary Policy Report
- 10:00am CAD BOC Rate Statement
- 10:00am CAD Overnight Rate
- 10:30am USD Crude Oil Inventories
- 11:15am CAD BOC Press Conference
- 11:35am GBP BOE Gov Carney Speaks
Thursday, July 12
- 7:30am EUR ECB Monetary Policy Meeting Accounts
- 8:30am USD CPI m/m
- 8:30am USD Core CPI m/m
*All times EDT
Week Ahead – Loonie Eyes BoC Rate Hike; UK Starts Publishing Monthly GDP
A policy meeting by the Bank of Canada looks set to be the most exciting item on next week’s calendar as it will be a somewhat muted five days for economic indicators. US inflation will be the data highlight but the introduction of monthly GDP numbers by the UK’s statistics office may also attract quite a bit of attention. Meanwhile, oil traders will be eyeing the latest monthly reports by OPEC and the IEA to evaluate the impact of the recent output increase decision by major producers on the oil market.
Battered aussie hoping for data lift
The Australian dollar may have regained some positive footing after tumbling to a 1½-year low of $0.7308 earlier this week but is still down by 5% in the year-to-date. And with the growing trade uncertainty and rising US interest rates, it’s unlikely to snap out of its bearish phase just yet. However, next week’s data out of Australia and China may help the currency extend its bullish correction. Domestic data will include the NAB business conditions gauge for June on Tuesday, and May housing lending figures and the July consumer sentiment index by Westpac on Wednesday.
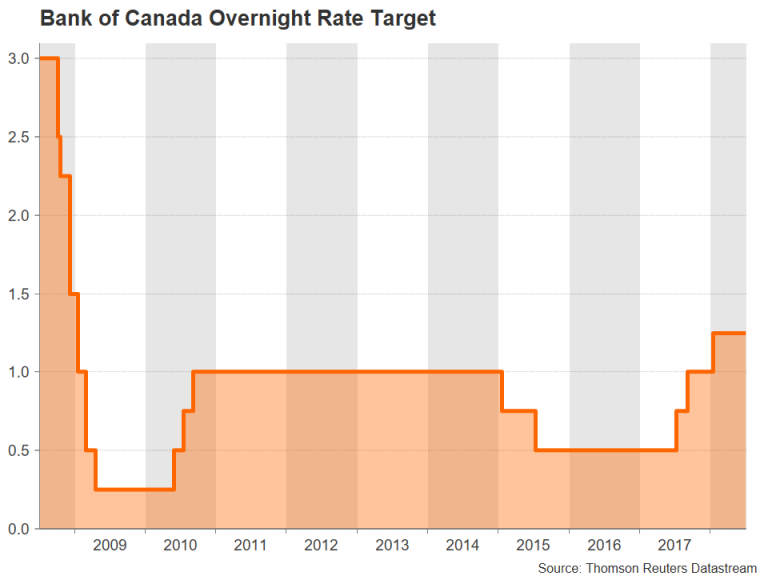
China’s major releases will comprise measures of prices on Tuesday and trade figures on Friday. Both producer and consumer prices are forecast to accelerate in June, rising by 4.5% and 1.9% respectively on an annual basis. Higher producer prices are generally seen as an indication of strengthening factory demand for raw materials, suggesting rising output. A strong PPI reading could boost market sentiment. But the main focus will be on the trade numbers as investors will nervously be looking for early signs that the US tariffs on Chinese imports are hurting shipments from China. Exports are forecast to have risen by 10.2% year-on-year in June, below May’s 12.6% growth but still a very healthy figure if realized. Imports are expected to have increased by 22%, down from 26% in the prior month.
ECB minutes may provide more clarity on rate path
It will be relatively quiet on the data front for the European calendar, but the ECB minutes of the June meeting should keep the euro in the spotlight. German trade numbers will start the week on Monday. Exports from the Eurozone’s largest economy are forecast to have risen by 0.75% month-on-month in May. German exports have fallen in three out of four months this year so a positive figure for May would add to the growing evidence that growth picked up towards the end of the second quarter. Also to watch from Germany is the Ifo ZEW economic sentiment index for July on Tuesday, while data for the euro area will contain the sentix business survey on Monday and industrial output figures on Thursday.
A more important driver for the single currency though will be the ECB account of the June policy meeting, due on Thursday. The ECB decided in June to end its asset purchase program by the end of the year and signalled that interest rates will remain at current levels through the summer of 2019. This led investors to push back expectations of a rate rise to the end of 2019. However, it appears that some ECB policymakers are not happy with the market pricing and are viewing September or October as a more probable timeframe. The euro got a boost from those reports and could enjoy additional gains if the minutes confirm a slightly steeper rate path projection.
UK data to be watched for BoE rate clues
The United Kingdom will see a batch of important releases on Tuesday, which, after this week’s series of better-than-expected PMIs for June, could further boost the odds of a rate hike by the Bank of England as early as August. Figures on industrial and manufacturing output will be watched for signs of a rebound in May after a dismal April. For the first time, the UK will also be publishing monthly numbers on the services sector as well as on GDP. The GDP data will consist of both month-on-month and a 3-month average estimate for May, giving policymakers a timelier picture of economic growth. Trade data will also be released on Tuesday. A strong set of figures would almost certainly give the pound another leg up, helping cable advance further above $1.32, though gains are likely to be limited if the UK government fails to find a solution on a customs partnership with the EU after Brexit.
US CPI getting close to hitting 3%
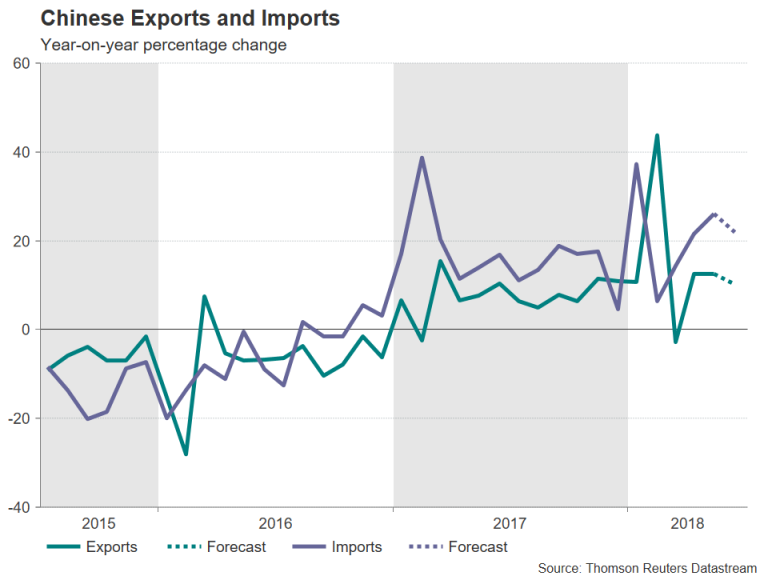
June producer and consumer prices will be the main data from the United States next week. PPI numbers are out on Wednesday and will be followed by the CPI report on Thursday. The 12-month CPI rate is forecast to edge up 0.1 percentage points to 2.9% in June, with the core rate rising to 2.3%. Although the consumer price index is not the Fed’s preferred inflation gauge, the fact that it is headed for the 3% mark nevertheless signifies that inflationary pressures, whilst modest, are present in the US economy, laying the risks firmly to the upside. On Friday, June import prices will be the final barometer on inflation, and the University of Michigan’s preliminary print on consumer sentiment for July will also be watched. While stronger-than-expected readings have the capacity to push the US dollar higher next week, developments on Sino-US trade relations will most likely remain the biggest driver for the greenback.
Bank of Canada to raise rates, probably
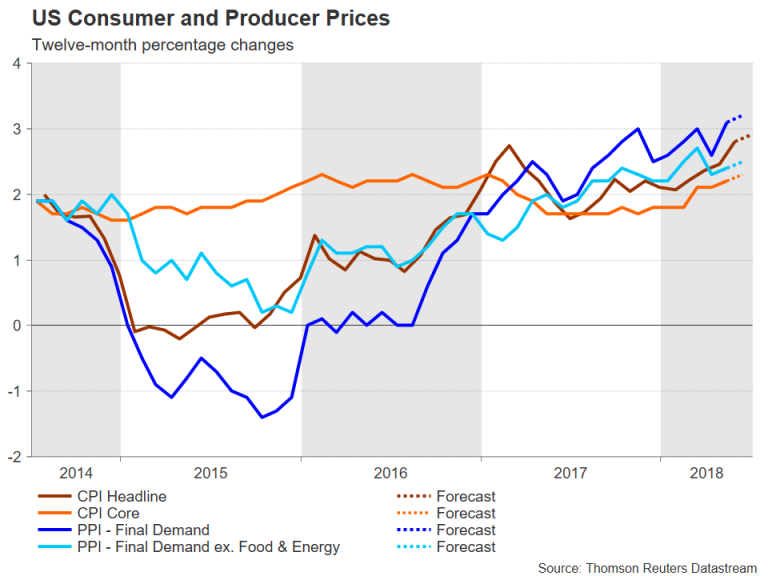
With relations between the US and Canada at a low point and the future of NAFTA looking uncertain, most investors had been expecting the Bank of Canada to wait for the tensions to diffuse before raising rates again. However, following recent hawkish remarks by the Bank’s Governor, Stephen Poloz, a July rate hike has moved back into the frame. But given the BoC’s history of surprising the markets, there is still a reasonable chance of no change in July, especially when considering the somewhat mixed data out of Canada recently. The Canadian dollar scaled 3-week highs this week on the expectations of a BoC rate hike, recovering from one-year lows. Further gains are likely if the BoC raises its overnight rate from 1.25% to 1.50% on Wednesday.
The loonie could also see reaction to movements in oil prices. After the recent decision by OPEC and some non-OPEC countries to raise output, the monthly reports by OPEC and the International Energy Agency could shed some light on how the increases will affect supply in view of the ambiguity of the actual announcement.
Australia & New Zealand Weekly: Falling Power Bills & Moderating Housing Costs are Holding Back Inflation
Week beginning 9 July 2018
- Falling power bills & moderating housing costs are holding back inflation.
- Australia: Westpac-MI consumer sentiment, housing finance, NAB business survey.
- NZ: retail card spending, REINZ house prices.
- China: CPI, trade balance, credit data.
- Europe: Sentix investor confidence.
- US: CPI, Monetary Policy Report to Congress.
- Central Banks: BOE Governor Carney speaks, BoC, BoK and BNM policy decisions.
- Key economic & financial forecasts.
Information contained in this report current as at 6 July 2018.
Falling Power Bills & Moderating Housing Costs are Holding Back Inflation
With the ABS to publish Q2 CPI on July 25 we turn our focus to inflation trends in Australia and what to expect in the Q2 update.
We noted in the Q1 CPI review searching for Australian inflation continues to be as fruitless as Vladimir and Estragon's wait for Godot. The Q1 2018 CPI printed 0.4%qtr holding the annual rate flat at 1.9%yr a small moderation from the 2.1%yr pace in 2017 Q1. The average of the core measures rose 0.5%qtr for an annual pace of 2.0%yr a slight uptick from 1.9%yr in Q4/Q3 2017 and 1.8%yr in Q2.
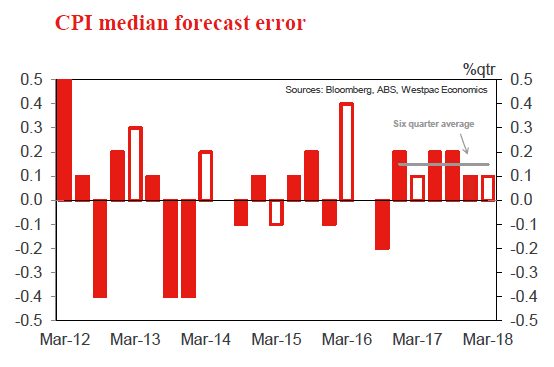
We have now seen six consecutive quarters where forecasters have over-estimated the CPI print. The average error since the December quarter 2016 is +0.15ppt. As a group, market forecasters have been overestimating the inflationary impulse in the Australian economy. We also noted the outright deflation being experienced in the retail sectors with prices falling in the year for clothing (–5.5%yr), footwear (–3.1%yrs), textiles (–2.7%yr), appliances (–2.5%yr), furniture (–1.9%yr) and nondurables (–1.4%yr).
The average error on core inflation over the same period of time is just 0.025ppt so the error appears to be around missing some of the more extreme discounting in certain expenditure classes rather than a general over estimation of the underlying price momentum. We would expect that, just like ourselves, most forecasters are incorporating an ongoing margin squeeze for clothing, footwear and broader household goods. As such, we would be surprised to see a market median forecast significantly higher than our own. Of more concern, however, would be a low median estimate (on par or less than ours) that is still meaningful higher than the final ABS print as this would suggest that the deflationary pulse is deepening.
For the June quarter there are some solid 'knowns' but, as always, many 'unknowns'
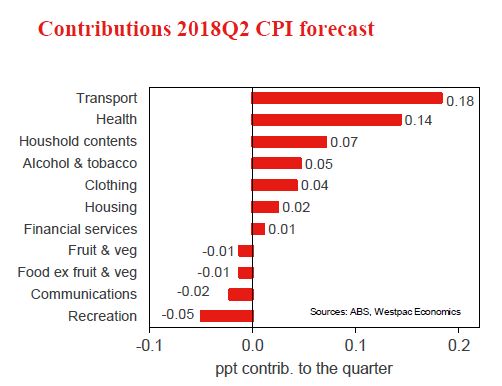
For the June quarter, the most obvious standout is the jump in the pump price for petrol and the ongoing price gains in the health sector. Our market data points to fruit & vegetable prices falling in the quarter (with a fall in fruit outweighing a small rise in vegetable prices) while prices for tobacco continue to climb. We also get a guide from BITRE data on domestic travel that suggests the seasonal discounting for domestic travel in the June quarter might not be as great as it has been.
However, outside the above, a large number of unknowns remain. We don't have data that is comparable to CPI dwelling prices and rents so these components remain educated guesses. We also don't have access to a lot of the data the ABS uses and, in many cases, it is not possible to replicate the ABS survey process causing many small errors along the way. We use many alternative sources and surveys as a guide but our forecasts are, in the end, based on significant subjective judgement.
June is a seasonally soft quarter
Westpac's forecast for the June quarter headline CPI is 0.4%qtr with base effects lifting the annual pace to 2.1%yr from 1.9%yr. Westpac's forecast takes the two quarter annualised pace to 2.1%yr from 1.9%yr in Q1.
June quarter is a seasonally soft quarter with the ABS projecting a seasonal factor of –0.23ppt. However, this exceeds the June quarter seasonal factor for the past two years (average –0.18) so a downward revision to this estimate would not surprise.
Core inflation is forecast to print 0.5%qtr (0.50% at two decimal places) seeing the annual pace ease to 1.9%yr from 2.0%yr. The trimmed mean is forecast to rise 0.52% while the weighted median forecast is 0.49%. The two quarter annualised pace lifts modestly to 2.1%yr from 2.0%yr – at the bottom of the RBA's target band.
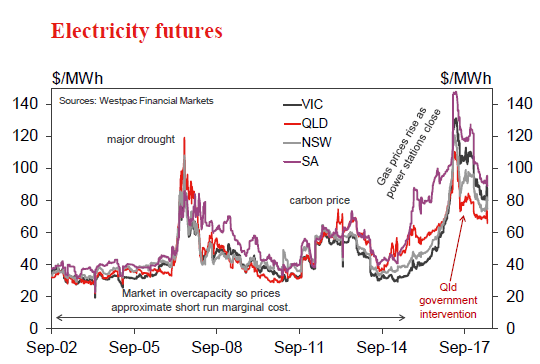
Falling wholesale electricity prices has led to a downward revision to our forecasts
Through 2017, the big story for housing costs was the rise in energy bills, particularly for electricity but also gas. There are timing issues with how electricity bills are repriced in the different capital cities and in the June quarter we are expecting a small seasonal negative driven by falling prices in SA (as demand falls but renewable power remains robust).
However, the more significant change has been the ongoing fall in wholesale prices as renewable generation expansion exceeds expectations and power storage facilities enter commercial application. Some discounting of power bills has been reported and we are expecting this to continue through the remainder of 2018. For Sydney we are looking at electricity prices falling by around 6%yr by end 2018 while in Melbourne the same fall will be experienced in early 2019. For Brisbane electricity price will be falling around 7%yr in the second half of 2018 while in Adelaide we are expecting electricity price to be down –4%yr by end 2018.
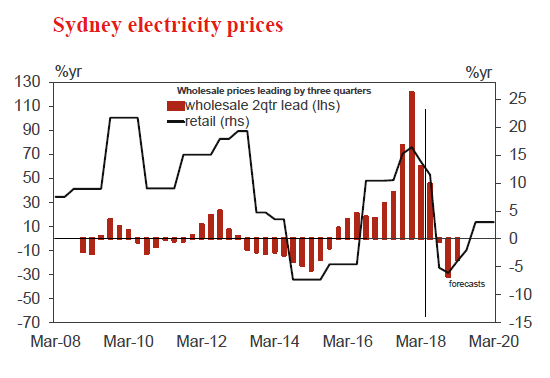
The estimates above are all preliminary estimates and a lot will depend on the direction of wholesale electricity prices from here. Wholesale prices have been broadly flat so far in 2018 which is why we are not looking for even larger declines in power bills. However, as at July start, wholesale electricity prices took a dip lower which if it continues, or is even extended, will place further downwards pressure on our forecasts.
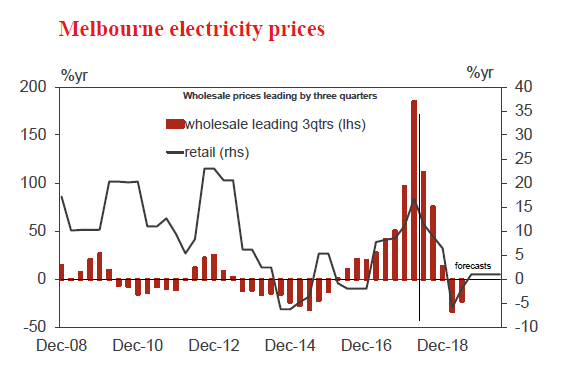
Falling power bills are also a key reason for our downgrade to our medium term inflation profile, for both headline and core, out to the end of 2019. We have downgraded our Q2 forecast, it was 0.6%qtr. The fall in wholesale electricity prices has been greater, and longer, than we originally anticipated forcing us to downwardly revise our utilities inflation forecasts. CPI headline inflation is now forecast to peak at 2.1%yr in September 2018 rather than 2.5%yr. End 2019 is now 1.8%yr vs 1.9%yr.
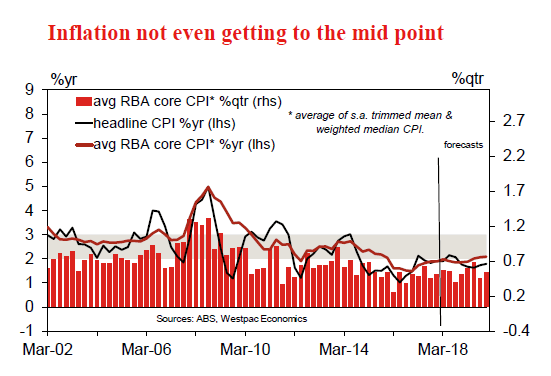
Core measures to remain benign even out to end 2019
Traded prices are forecast to rise 0.7% in the quarter to be up 0.6%yr, while non-traded prices are forecast to rise just 0.2%qtr/2.9%yr as housing costs moderate.
Core inflation remains below the bottom of the RBA target band with household energy bills moderating, and dwelling purchases prices easing through 2018. Overlay a competitive deflationary cycle in consumer goods and it makes it hard to see core inflation breaking much higher. Looking further out, core inflation is forecast to end 2018 at 1.9%yr, while by end 2019, a modest lift to 2.1%yr.
Will market forecasters over estimate the CPI again for a seventh consecutive quarter? Westpac has applied a downward bias to our estimates so it will be interesting to see who else has (or has not) done so and by how much if they have.
Core measures to remain benign even out to end 2019
Traded prices are forecast to rise 0.7% in the quarter to be up 0.6%yr, while non-traded prices are forecast to rise just 0.2%qtr/2.9%yr as housing costs moderate.
Core inflation remains below the bottom of the RBA target band with household energy bills moderating, and dwelling purchases prices easing through 2018. Overlay a competitive deflationary cycle in consumer goods and it makes it hard to see core inflation breaking much higher. Looking further out, core inflation is forecast to end 2018 at 1.9%yr, while by end 2019, a modest lift to 2.1%yr.
Will market forecasters over estimate the CPI again for a seventh consecutive quarter? Westpac has applied a downward bias to our estimates so it will be interesting to see who else has (or has not) done so and by how much if they have.
The week that was
In contrast to the last few, this week had a strong focus on Australia. The RBA met, and we received updates on retail sales; house prices; and dwelling approvals.
Beginning with the RBA, the decision statement of the July meeting carried an unchanged core expectation of above-trend growth in 2018 and 2019 and a consequent gradual firming of wage and inflation pressures. However, a number of nuanced changes to the statement give credence instead to our own view that growth will disappoint and remain sub-trend.
Regarding the global economy, growing trade tensions and instability in the emerging world's financial markets led to less confidence in the global economy, the RBA statement's focus shifting from momentum having "strengthened over the past year" to merely "continuing". On the abnormally high short-term interest rates that Australia has been experiencing, there was (rightful) recognition that this is not solely due to developments in the US, with "other factors at work as well". What these other factors are continues to be debated by market participants, but it seems likely that much weaker growth in deposits than credit is playing a part.
The consequences of weak deposit growth, also evinced by the historically low household savings rate, range far beyond market rates however. Suffice to say, consumers in a tight financial position are highly unlikely to accelerate their spending; as a result, businesses in related sectors also have little reason to upgrade their investment plans.
Supporting this view, May retail sales underwhelmed this week. At 0.4%, the headline monthly gain beat expectations; but excluding a bounce in clothing and department stores, sales were actually flat in the month. Going forward, a further headwind for consumption growth is likely to develop as declining wealth is increasingly recognised by households.
Key to the wealth narrative, CoreLogic price data indicates June was the ninth consecutive monthly price decline. The correction remains shallow and heavily concentrated in the cities that previously saw the greatest gains (Sydney and Melbourne). But the auction clearance detail suggests this downtrend will continue in coming months. This persistent weakness in prices and tighter financing conditions will also weigh materially on dwelling approvals and thus residential investment through to (at least) the end of 2019.
Turning overseas, China's PMIs again showed that current momentum in our largest trading partner remains robust. However, two negative trends bear close monitoring. These are abating external demand and continued disappointing employment growth. The deterioration to date is largely as we anticipated and is thus consistent with our sub-consensus view for GDP growth (6.3% and 6.1% in 2018 and 2019). But a further loss of momentum is a risk, particularly given authorities remain focused on the long-term 'quality' of growth and are therefore unlikely to spur current momentum with active policy easing as they have in the past.
Across the rest of Asia, PMI data for June indicated that the growth pulse in developed nations such as Japan and South Korea is finding a base after softening in prior months. Emerging Asia is also weathering financial instability well, though there are growing growth risks for nations like Indonesia where policy makers have been forced to react to weakening currencies with sharp interest rate hikes.
Finally to the FOMC minutes from the June meeting. Here we saw the Committee remain committed to their positive view of growth and inflation as well as the consequent need to continue gradually raising the fed funds rate. That said, downside risks emanating from trade frictions and Europe were brought into sharper focus by the Committee, particularly for business investment. Liaison reports from across the US have given the FOMC cause to be vigilant, but it is too early to tell to what degree growth could be affected.
For those in search of some weekend reading, our July Market Outlook has just been released. This edition delves into the growing uncertainty evident in the global growth narrative, both in aggregate and country by country for Australia; the US; Europe and China. For Australia, the evolving structure of our labour market is assessed by state; industry and gender. And from the HILDA survey, there is also a timely profiling of Australia's interest only borrowers.
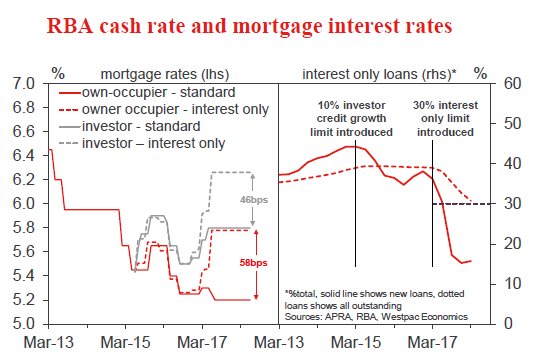
Chart of the week: Interest only loans
While the Australian economy has been chugging along with modest strength recently, a point of weakness has been around the uncertain outlook for consumers. Within the household sector, there is a segment coming under particular stress - those with 'interest only' mortgages.
As lending conditions have tightened recently, mortgage rates on interest only loans have widened considerably, now sitting 46-58bps higher than their standard counterparts.
Some have subsequently rolled on to standard 'principal and interest' loans, and others may be considering a similar move once their interest only periods end. In many cases, these borrowers will be facing increased repayments and may encounter difficulties refinancing against a backdrop of tighter lending criteria. This transition therefore represents a potential downside risk factor to the already sluggish Australian household sector. See our monthly Market Outlook for further detail.
New Zealand: week ahead & data wrap
Recent developments continue to highlight the flagging momentum in the New Zealand economy. While that's in line with our own forecasts, it has been a surprise to financial markets more generally. As a result, we've seen the New Zealand dollar losing ground in recent weeks. In addition, financial market pricing for the Official Cash Rate has been pushed out, and has now caught up with our forecasts for an extended pause from the Reserve Bank.
Momentum in the economy has continued to ease
As we've been highlighting for some time, conditions in the New Zealand economy have come off the boil. That's been highlighted most recently in the latest Quarterly Survey of Business Opinion. General business confidence has fallen to its lowest level since 2011. In addition, businesses across a number of sectors have reported a softening in activity recently, with gauges of trading conditions signalling some downside risk to our forecast for 0.7% GDP growth in the June quarter.
Looking to the back half of the year, businesses remain downbeat about their own prospects and conditions in the economy more broadly. This has seen them scaling back plans for capital expenditure, consistent with our expectations for a lull in investment activity this year.
The past week also saw a sharp 5% drop in dairy prices, effectively taking them to the lower bounds of what we were expecting to see over the course of this season. Prices can be volatile in the fortnightly auctions, and the size of this latest fall was a surprise. Consequently, we're treating this result with a degree of caution. Nevertheless, we have been warning of the prospect of weaker dairy prices on the back of slowing growth in China for some time. That's been the key reason our own payout forecast of $6.40 has been sitting below Fonterra's $7 estimate for the 2018/19 season.
While the wind is coming out of the economy's sails, that's not to say that the New Zealand economy is weak. As we've been highlighting for some time, the mixed nature of economic developments in recent months reflects that the economy has now moved into a more 'mature' phase of the economic cycle. In the wake of the financial crisis, the combination of lingering spare capacity and accelerating population growth provided ample capacity for expansion, with low interest rates helping to stoke demand. However, New Zealand is now into its eighth year of continued expansion, and the economy is encountering some growing pains. Those include difficulties sourcing staff and rising wage costs as the labour market has tightened. At the same time, some of the key drivers of recent economic growth, including rising house prices and construction activity, have moved into new phases, and are no longer providing the same boost to demand that they once did. Balanced against those headwinds, however, demand is continuing to be supported by strength in export earnings (including tourism). And looking ahead, increases in fiscal spending will also provide a significant boost over the coming years.
This changing mix of economic conditions has seen the pace of GDP growth taking a step down. Nevertheless, we still expect the economy will continue growing at a respectable pace over the coming years, with annual GDP growth expected to average a little below 3% through 2019/20.
Changing financial conditions
While the slowdown in the economy has been in line with our expectations, it has come as a surprise to financial markets more generally. As a result, we've seen the NZ dollar losing some altitude over the past few weeks, and at the time of writing it was trading a little below US$0.68. We expect that it will fall further over the coming year, as interest rates offshore push higher and the RBNZ stays pat for some time yet.
Interest rates have also fallen, and financial market pricing is now broadly consistent with our long held expectation that the RBNZ will keep the Official Cash Rate on hold until the final quarter of 2019.
There have even been some suggestions that the RBNZ might look at cutting the OCR again over the coming year. However, we don't think that conditions in the economy warrant a further cut at this stage. Rather than weakness in economic activity, part of the reason that growth has slowed is that spare capacity has been eroded. Even so, GDP is still expanding at a moderate pace, and a substantial increase in fiscal stimulus is planned over the coming years. The drop in the NZ dollar is also helping to buffer the economy, boosting export returns and cushioning the effects of slowing activity in other sectors
The inflation backdrop also looks quite different from when the RBNZ last cut rates. Over the past decade, consumer price inflation often struggled to reach even 1%. However, inflation has now picked up again, and in this week's QSBO businesses reported a large increase in input costs. Some of this is no doubt related to the rise in petrol prices. More generally, businesses are reporting stretched capacity. They are also reporting increases in wage costs as the labour market has tightened and minimum wage rate has risen.
This increase in cost pressures is consistent with our forecast for a near-term rise in consumer prices, with CPI inflation expected to briefly reach the 2% mid-point of the RBNZ's target band later this year. With much of this increase related to a rise in oil prices, we do expect that inflation will ease back again next year. Nevertheless, inflation is still expected to remain well within the RBNZ's target band.
Data Previews
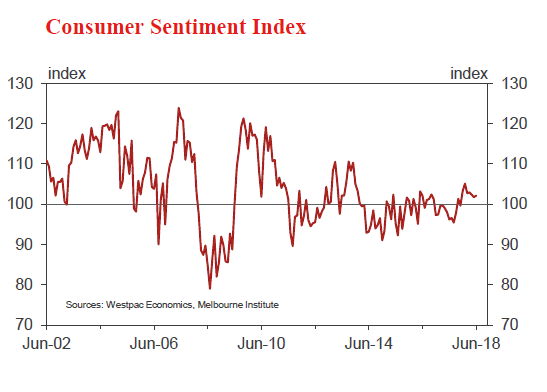
Aus Jul Westpac-MI Consumer Sentiment
- Jul 11 Last: 102.1
The consumer mood improved marginally in 2018, the first half of the year marking the best run of sentiment reads since 2014. That said, the Index has not built on the gains seen at the start of the year and remains well below the levels typically associated with a robust consumer. While there has been a clear lift in confidence around the economy, this has had a muted impact on views around family finances, which remain downbeat.
The July survey is in the field from July 2-7. Factors that may influence this month include: the RBA's decision to leave official rates on hold, recent comments emphasising that any move is still a long way off; the passage of the Federal government's tax cuts into legislation and a proposed reconfiguration of GST allocations that sees 'no state worse off'; continued slippage in dwelling prices, now down 1.6%yr. Financial markets have had a mixed, the ASX up 2.8% but the AUD down 2.3c vs the USD. Offshore, global trade tensions have again been to the fore.
Aus May housing finance (no.)
- Jun 11, Last: –1.4%, WBC f/c: –2.0%
- Mkt f/c: -2.0%, Range: -2.5% to -0.2%
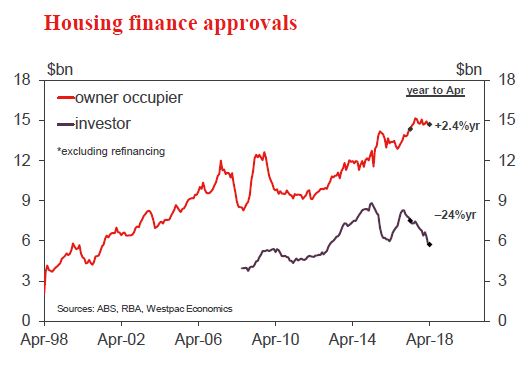
After holding relatively steady through most of 2017 and early 2018, Australian housing finance approvals showed a notable pull back in recent months. The total number of owner occupier approvals declined a further 1.4% in April with the value of investor loans down 0.9%. Conditions were soft across most of the detail. Combined, the total value of approvals ex refi fell 0.4%mth to be down 5.8%yr.
Industry figures point to a further decline in owner occupier approvals in May – we expect the official figures to show a 2.0% drop. Auction data showed a clear further weakening in the Sydney and Melbourne markets through May and early June. Some of this likely reflects tightening lending standards which may have had multiple effects including longer processing times for loan approvals, a higher decline rate for loan applications and reduced assessments of borrowing capacity. The May finance approvals should help confirm some of these aspects.
NZ Jun retail card spending
- Jul 10 Last +0.4%, WBC f/c: +0.4%
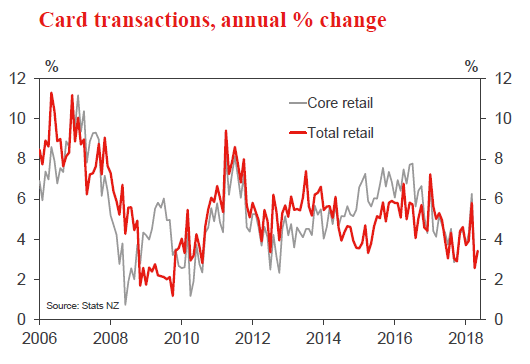
After a large 2.2% fall in April, retail spending only rose by a modest 0.4% in May. Smoothing through the month-tomonth volatility, it looks like after a solid start to the year, the momentum in retail spending has faded. In fact, except for a holiday related rise in March, retail spending has essentially been flat since January.
Much of the softness in household spending is likely to stem from policy changes aimed at cooling the housing market. We expect house price inflation will remain muted through mid-2018.
We expect that spending growth will remain weak in June and are forecasting a 0.4% gain. That will leave us with a picture of essentially flat spending levels through the first half of the year.
NZ Jun REINZ House Price Index (s.a.)
- Jul 10 (tentative date) Last: -0.2%
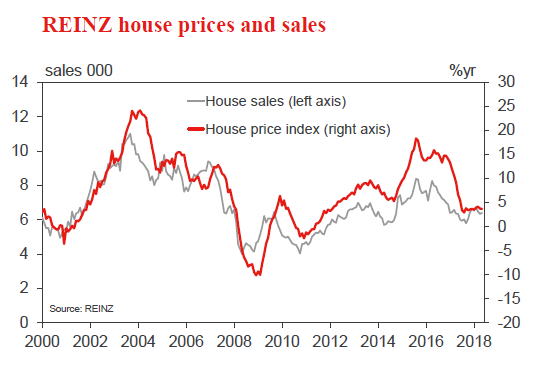
After a brief resurgence around the turn of the year, the New Zealand housing market has cooled. Prices are now falling in Auckland, Wellington and Christchurch, and rising slowly elsewhere. Measured nationwide, house prices have been roughly flat.
The Bright Line Test for taxing capital gains was extended to five years in late March, and this is impacting the market at present. The next negative factor for the market will be the foreign buyer ban, set to become law within a month. However, one offsetting positive for the market at present is falling mortgage rates.
June REINZ data is expected to continue the recent trend of slowing sales and flat prices.
If Not Raising Wages, Then What?
How Employers Are Addressing Hiring Difficulties
Stubbornly slow wage growth has been one of the most lamented aspects of the current expansion. The historically weak pace of wage gains comes despite a tight labor market, as indicated by most employment measures. Conventional economic theory suggests that employers should be raising pay to attract increasingly scarce labor.
Employers, however, appear reluctant to commit to higher wages and salaries, which account for the largest share of employee compensation and are notoriously difficult to cut. Instead, businesses are sweetening the deal for workers around the edges. Benefits, especially one-time bonuses, are outstripping wages, while more employers are offering access to perks such as paid leave and wellness programs.
Rather than competing for already-qualified workers, employers are also "down-skilling." By easing job requirements, employers have held the line on wages, but are increasingly shelling out for training. Those labor-related costs do not show up as earnings, but provide workers with skills that will support future wages. In this report, we explore how employers' emphasis on benefits and their hiring of more marginal workers are contributing to tepid wage growth, even as the chorus of complaints about labor availability grows louder.
Why Aren't Wages Strengthening More?
By most measures, the labor market is tight.1 Currently, there is less than one unemployed person per job opening. The unemployment rate fell to 3.8 percent in May, matching its lowest point since 1969, though it ticked up slightly to 4.0 percent in June. Against this backdrop, employers are increasingly voicing difficulty in finding and retaining workers. The share of small businesses reporting they have at least one job that is hard to fill hovers near the high-water mark of the 1991-2001 expansion, while small businesses most frequently cite labor quality as their number one problem (Figure 1).
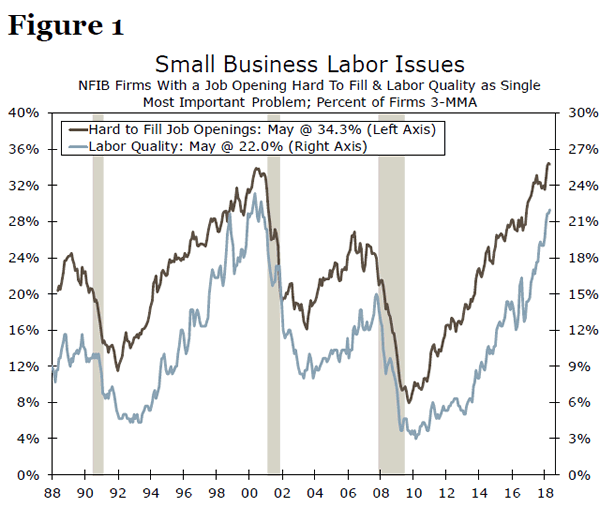
Despite the ubiquitous concerns about finding workers, wage growth remains historically weak. Average hourly earnings growth has picked up since the early years of the expansion, but has yet to breach 3 percent (Figure 2). In previous work, we have highlighted some fundamental and technical factors holding down wage growth this cycle.2 Slow productivity growth over the past decade has made it difficult for companies to raise real wages rapidly, while low inflation means workers have less need to push for higher nominal wages. In addition, composition shifts in the types of jobs being added to the economy and the age of workers are holding down average hourly wages.
Yet, given the seemingly tight state of the labor market, the lack of cyclical pressures on wage growth continues to surprise many. Conventional economic theory tells us that labor scarcity leads to higher wages, and once the labor market has surpassed "full employment," wage growth accelerates. Moreover, many businesses touted the cut to corporate tax rates from the Tax Cuts and Jobs Act as a way to raise employee pay, which further fueled expectations of stronger wage growth. If they are not raising wages meaningfully, what then are employers doing to address hiring difficulties?
Reluctance to Commit: Stepping Up Bonuses and Other Benefits
One issue with the most closely watched measure of wage growth—average hourly earnings (AHE)—is that it looks at compensation through a narrow lens. AHE only captures regularly paid wages & salaries and excludes benefits. Benefits have long been a method through which employers have tried to attract workers when they were unable or unwilling to raise wages. For example, employer-sponsored health care sprang out of the wage freezes of World War II and the need for employers to differentiate themselves. Benefits are also used as a way to target a specific type of worker, such as student loan repayment benefits to attract young college graduates.
The distinction between total compensation and wages & salaries has become increasingly important as benefits have grown to account for nearly one-third of labor costs (Figure 3). The steady rise in the share of employment costs devoted to benefits illustrates that for much of the past 15 years, benefits growth has outpaced wages & salaries. That has been the case over the past year as well, with benefits costs for each hour worked rising 3.3 percent versus a 2.8 percent increase in wages & salaries, according to the Bureau of Labor Statistics (BLS) survey on Employer Costs for Employee Compensation.
With years of explosive health care costs, it is tempting to assume that healthcare has been driving benefits costs higher, despite many workers not using (or appreciating) the full value of the cost covered by employers. Health insurance, however, has been trailing other employee-benefits.
Leading the charge in benefits growth has been one-time bonuses for workers. Nonproduction bonuses, i.e., those not directly related to a worker's output, are up 13 percent over the past year and account for a record-high share of compensation (Figure 4). These include any one-off bonuses offered in response to the Tax Cuts and Jobs Act as well as signing bonuses. For example, the share of employers offering singing bonuses to new college graduates is at a five-year high.3 Yet, the use of bonuses underscores employers' hesitancy to raise compensation on a sustained basis. With nominal wages notoriously difficult to cut, the financial risks associated with raising pay "permanently" still appear too great for many employers.
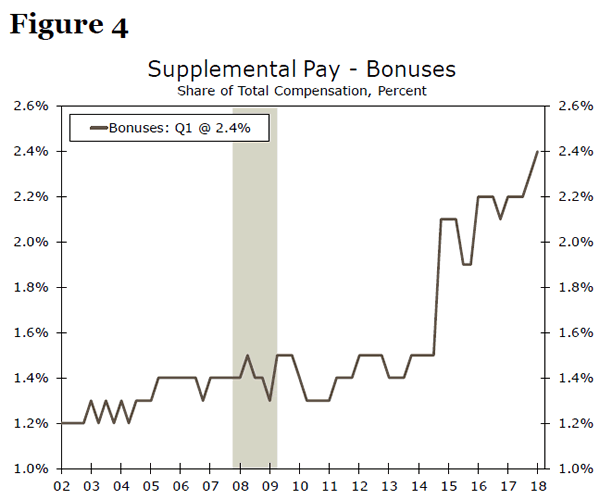
Access to other non-wage benefits has been increasing over the past decade, but the trend has accelerated as the labor market has tightened. According to the National Compensation Survey, access to wellness programs4 and paid sick leave is up 9 and 5 percentage points, respectively, between 2010 and 2017, with most of the increase over the past three years. Moreover, recent indications suggest that this trend is set to continue. A survey by the Society for Human Resource Management found that 34 percent of employers increased benefits in the past 12 months, with 60 of the assessed benefit categories showing an increase on the year versus only 20 in the year prior.5 Employers are also recently expanding vacation time and flexible scheduling to attract labor, according to a May report by the Federal Reserve Bank of Atlanta.6
Marginal Wage Growth and Marginal Workers
As fewer workers with highly-desirable skillsets are left unemployed, hiring managers are having to look farther afield and "down-skill" to fill open positions, which is likely holding back wage growth. Employers may be willing to raise wages or benefits for workers who are already qualified for a job, but not as much for workers with less relevant or recent experience. The need to hire more marginal workers as the pool of available labor shrinks is not unique to this cycle. However, the depth of the Great Recession and the protracted recovery that followed left many Americans unemployed for extended periods of time (Figure 5) and skillsets out-of-date. Therefore, employers in this cycle may be more resistant to raising wages if new hires require additional time and training to get them up to speed and on par from a production standpoint with more experienced employees.
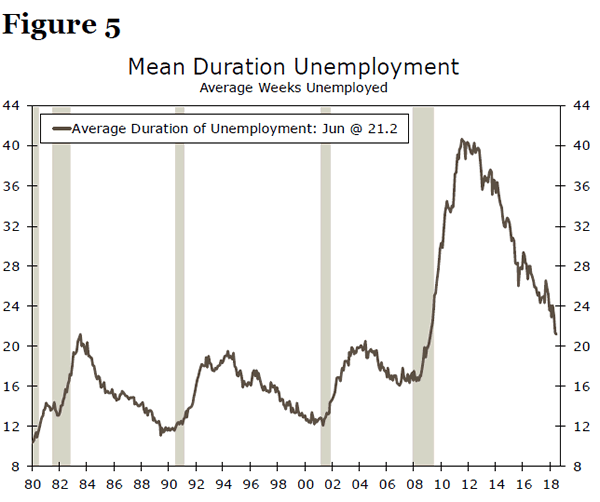
The most common reason for hiring difficulties is a lack of job-specific skills, education or experience, according to a 2017 Federal Reserve survey of small businesses.7 To help address this problem, about a quarter of firms surveyed reported loosening job requirements or offering more training. The number of registered apprentices has risen 42 percent since 2013 (Figure 6) and more than 3,000 new apprenticeship programs have been established over the same period. Workers in training are less likely to be able to command large pay raises than experienced workers. However, over time, training should boost productivity and wages. Expanded workforce development programs may be contributing to the recent uptick in labor productivity growth (Figure 7).
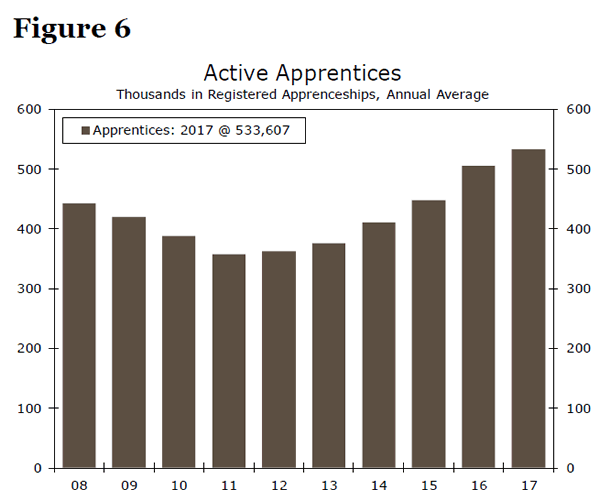
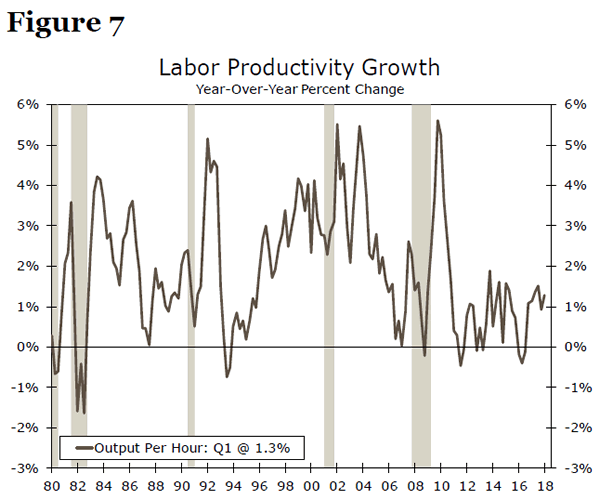
To ease hiring difficulties, employers are also expanding their job search to workers who have typically been less attached to the labor market. While unemployment has crossed below 4 percent for the civilian population as a whole, more slack remains among certain sub-groups, such as individuals with disabilities and criminal records. Employers are increasingly tapping these pools to fill open positions. Over the past year, the unemployment rate has fallen to 9.2 percent from 9.8 percent for those aged 16-64 with disabilities, compared to a drop of 0.3 percentage points for the same age group without disabilities (Figure 8).
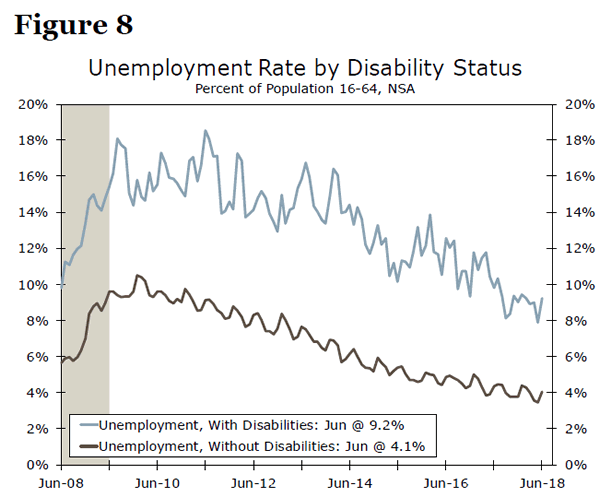
The BLS does not track employment by criminal history. However, anecdotal evidence suggest that more businesses are hiring workers with criminal records. Officials at the Federal Reserve Bank of St. Louis, for instance, reported that some employers in their district are "reducing restrictions on hiring convicted felons in order to alleviate labor shortages."8 According to a recent national survey, 33 percent of managers reported being willing to hire individuals with criminal records (and another 41 percent are ambivalent), though only 5 percent actively recruit these workers.9 With more than 600,000 individuals released from state and federal prisons each year, former convicts represent a largely untapped pool of labor that would limit the need for employers to raise going wages.
Conclusion: It's Not All About Wages
With the labor market about as a tight as it has been at any point over the past two decades, concerns over finding workers have become more strident. The most obvious response, according to economic theory, would be to raise wages, which is what many firms have done. Average hourly earnings are up 2.7 percent over the past year compared to an average annual increase of 2.1 percent during the first five years of the expansion. Survey responses from the Federal Reserve's 2017 small business survey also showed that more than any other single change, firms are raising starting pay to address hiring difficulties. Nevertheless, firms are taking a number of non-wage measures to fill the void or attract workers, which has dampened the pace of wage growth. More than a quarter of businesses are easing job requirements, while one-fifth report enhancing benefits or raising non-wage compensation.
The use of non-wage measures, such as irregular bonuses and paid leave, suggests reluctance for firms to commit to higher labor costs on a long-term basis. While firms may have enough confidence about the state of the expansion to bring on more workers, confidence in the ability to pass on higher costs on a sustained basis still appears shaky. The good news is that businesses are increasingly willing to commit resources to training workers. That helps extend the labor market recovery to workers that would have otherwise been left out of the expansion. Although such "down-skilling" provides less immediate benefit to workers' wallets than an increase in wage rates, it stands to benefit productivity growth—the slow pace of which has been a fundamental factor behind the historically weak wage environment.
1 "Cut the Unemployment Rate Some Slack" (May 29, 2018).
2 "525,600 Metrics: How Do You Measure a Year in Income Growth" (Oct. 24, 2017).
3 National Association of Colleges and Employers, "Job Outlook 2018," November 2017.
4 A structured plan, independent from health insurance that offers employees benefits including smoking cessation programs, exercise or physical fitness programs, weight control programs, etc.
5 Society for Human Resource Management, "2018 Employee Benefits: The Evolution of Benefits," June 2018.
6 Federal Reserve Board, "The Beige Book: Summary of Commentary on Current Economic Conditions by Federal Reserve District," May 2018.
7 Terry, Ellyn and Mels de Zeeuw. "How Do Firms Respond to Hiring Difficulties: Evidence from the Federal Reserve Banks' Small Business Credit Survey," Federal Reserve Bank of Atlanta Community & Economic Development Discussion Paper, No. 01 (2018).
8 Federal Reserve Board, "The Beige Book: Summary of Commentary on Current Economic Conditions by Federal Reserve District," May 2018.
9 Society for Human Resource Management and Charles Koch Institute, "Workers with Criminal Records," May 2018.
Jobs, Wages and the Participation Rate: Fed Full Speed Ahead
June job gains came in at 213,000. Maintaining the momentum of the tight labor market, wages were up 2.7 percent and the unemployment rate rose to 4.0 percent. Fed to raise rates in September.
Job Gains Broad-Based with June Jobs at 213,000
Nonfarm payrolls rose 213,000 in June with the three-month average at a solid 211,000 jobs. The broad-based character of the labor market is evidenced by the rise in the diffusion index to 65.5 for all private industries and at 65.8 for manufacturing firms (compared to 59.2 a year ago). These job gains are consistent with 3.0 percent plus economic growth in the current quarter and a FOMC September rate hike.
Jobs gains appeared broad-based, with most sectors experiencing gains over the month (top graph). Manufacturing jobs continue to show upward momentum—up 36,000 in June and up an average of 28,000 over the past three months. Construction jobs also showed a gain of 13,000 and are up 19,000 on average over the past three months. Over the past three months, aggregate hours worked are up 2.3 percent, annualized, which is very solid and consistent with continued growth in personal income and consumption.
Diversity in Wage Growth – And Real Wage Gains
The theory that workers and employers respond to higher inflation is revealed in the rise in wages, consistent with the recent rise in inflation. However, there is a significant diversity in wage gains (middle graph). Not surprisingly, the service sectors of finance and information appear at the top. What is interesting is that the common perception of low-paid service jobs in leisure & hospitality show evidence of good gains over the past year. Also encouraging are the gains in earnings for construction workers. Finally, real wages are up in many sectors as total CPI inflation is up 2.5 percent through May—note particularly finance, information and construction.
Unemployment Rebounds, but Labor Pool Still Challenging
After falling to 3.8 percent in May, the unemployment rate rebounded to 4.0 percent in June as just over 600,000 workers joined the labor force. That drove the participation rate back up to 62.9 percent and ended a three-month slide in participation rate for prime-age workers (ages 25-54). Despite the influx of workers to the labor force last month, employers are increasingly voicing concerns about finding workers. The number one problem most commonly cited by small businesses is finding qualified labor. While prime-age participation has been improving over the past three years, the rate is only about halfway back to its pre-recession peak, and 2.6 points below its peak in the late 1990s (bottom graph). The pool of available labor—workers officially counted as unemployed plus those not in the labor force but want a job—continues to hover at the lowest rate since 2001.
The dwindling availability of workers should resume downward pressure on the unemployment rate and upward pressure on wages, as some businesses try to attract workers via higher pay. Yet, with fewer workers on the sidelines and slowing population growth, we expect to see payroll growth moderate from the nearly 200,000 monthly average over the past year.