Sample Category Title
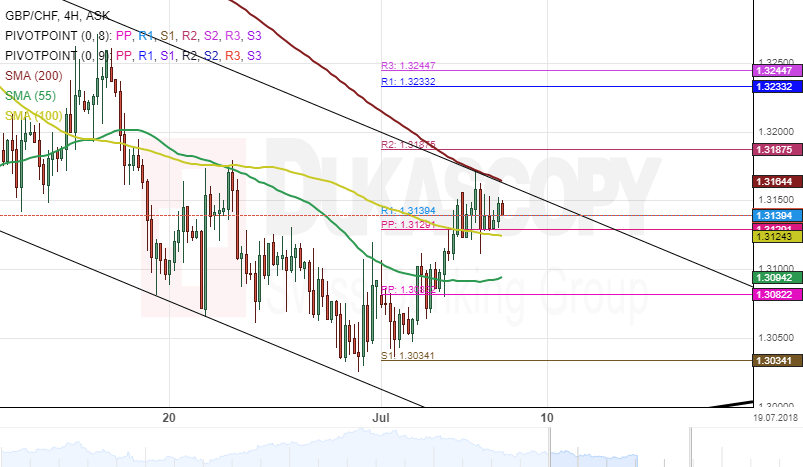
GBP/CHF 4H Chart: Restricted By 200-Hour SMA
The GBP/CHF currency pair has been guided by three months descending channel pattern. This channel was formed early April and have driven the rate lower toward the bottom border of a dominate ascending pattern.
Following a test of the southern boundary of the dominate ascending pattern on June 29, bulls are gradually introducing their dominance in the market. However, the 200-hour simple moving average is limiting the bulls from further gain.
Everything being equal, it is likely that the currency exchange rate strengthens during the following trading sessions. Nevertheless, the pair needs to surpass the aforementioned resistance level.
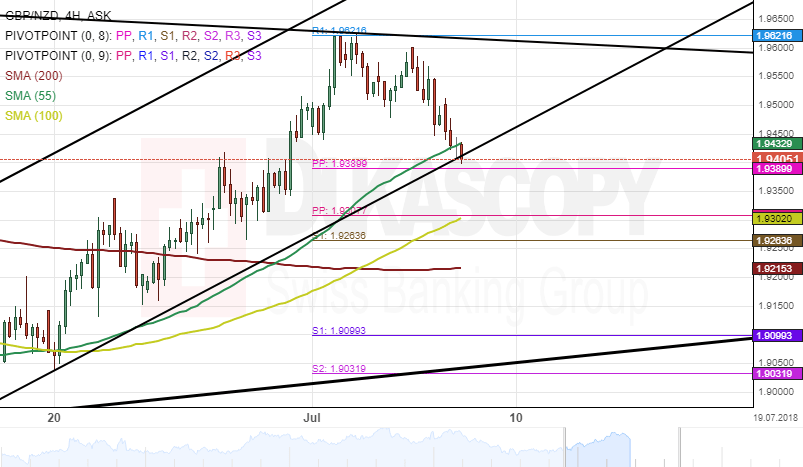
GBP/NZD 4H Chart: Likely Breakout
Upside risks have dominated the British Pound against the New Zealand Dollar, thus sending the exchange rate to gained 677 pips or 3.57% since mid-June. The currency pair hit a strong resistance set by the monthly pivot point at 1.9621 on July 2 and reversed south.
The GBP/NZD currency pair has been moving along a junior ascending pattern since June 19 and has currently tested the lower boundary of the pattern.
Given that the currency exchange rate has moved closer to the bottom border of the ascending pattern, a breakout could be expected today. However, technical indicators suggest that bulls are likely to prevail in the market during the following trading sessions.
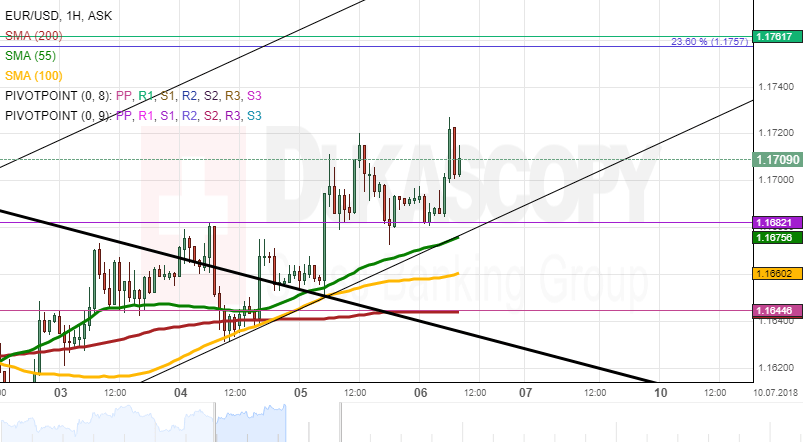
EUR/USD Analysis: Continues Its Path Higher
The chart of the EUR/USD has not changes much since Thursday. Namely, the same patterns remain active.
The currency exchange rate is continuing its surge, as new high levels are booked in the medium scale ascending channel pattern. However, there is one new notable aspect.
It was spotted on Friday morning that the 1.17 mark is providing psychological support to the Euro against the Greenback.
Meanwhile, the same target of 1.1760 is aimed at.
GBP/USD Analysis: Breaks Junior Pattern
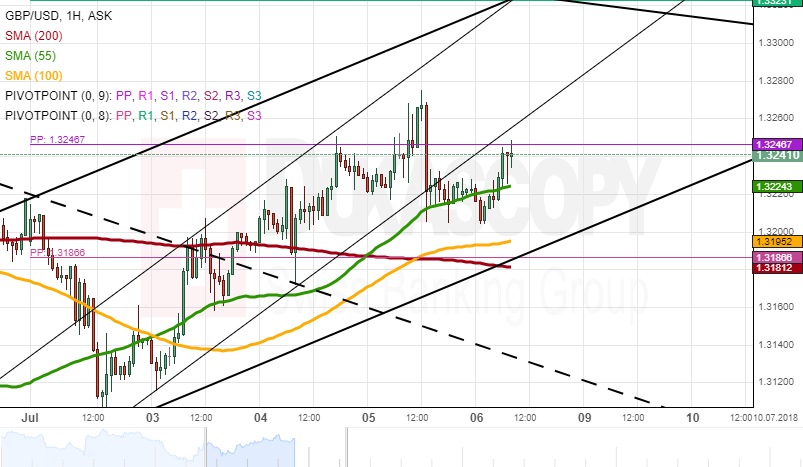
Due to political fundamental the GBP/USD pair has declined and broken the junior ascending pattern. Namely, the German Chancellor Angela Merkel slammed the Prime Minister of the United Kingdom in a way that the markets saw as destructive for the British currency.
Such events usually ignore all technical indicators. This was no exception. However, if one practices proper risk management by using stop losses, large losses are avoided.
Meanwhile, note that the 55-hour SMA did manage to provide support .
USD/JPY Analysis: Trades Horizontally
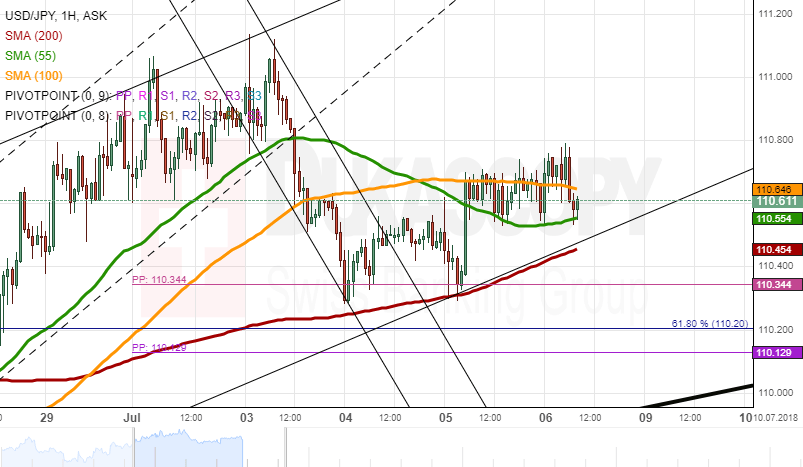
There are almost no changes on the USD/JPY currency exchange rate's hourly chart. Namely, the pair has traded sideways while being supported by the 55-hour SMA and being restricted from surging by the 100-hour SMA.
However, note that the 100-hour simple moving average was pierced on early morning of Friday's trading session.
In general, the rate is set to continue trading sideways until it reaches the additional support of the 200-hour SMA and the lower trend line of the medium term ascending pattern.
XAU/USD Analysis: New Pattern Gets Broken
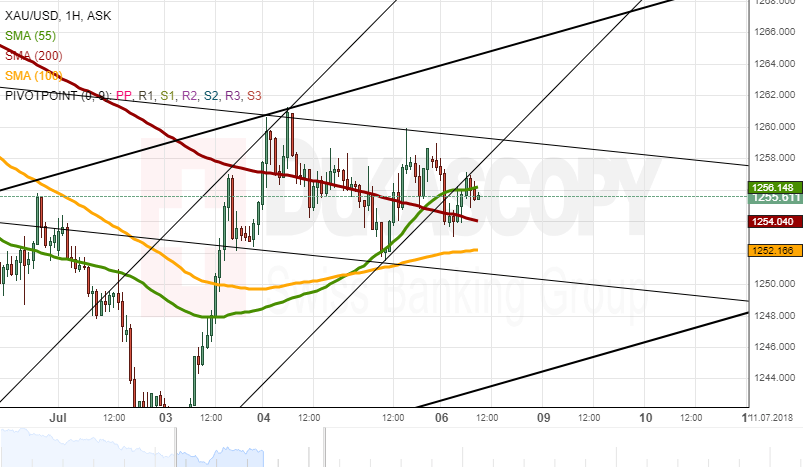
The recently, experimentally drawn pattern on the yellow metal's charts has been broken. However, note that this provides an opportunity for more charting.
First of all, if one looks at the recent almost horizontal decline, it can be spotted that there exists a short term descending pattern. Due to that reason it can be deducted that the previous pattern represented the previous junior move.
By using these facts one can draw a speculative medium scale ascending pattern, which the previous charts lacked. This chart combined with the close by simple moving averages can be used for guidance.
Chinese Premier Li: Trade war is never a solution
In response to the start of US section 301 tariffs on USD 34B in Chinese import, Chinese Foreign Ministry spokesman Lu Kang said in a daily media briefing that "after the United States unfairly raised tariffs against China, China immediately put into effect raised tariffs on some U.S. goods." Lu also reiterated that "On the specifics of the trade issue, from the start China's position has been very clear and consistent. The United States at all levels is very clear on China's position,"
Commenting on the issue, Chinese Premier Li Keqiang said in Bulgaria that trade war is "never a solution" and there will be no winner. And, "it benefits no one and it would undermine the multilateral free trade process,” he said. “If one insists on waging a trade war it would hurt others and themselves.”
He reiterated that China is committed to further opening up its markets. But, "if any party resorts to increase of tariffs, china would take measures in response to protect china development interests and safeguard multilateral trade regime and rules."
Trade War Begins
Trade war is on
The last ADP report came in weaker than expected as US companies added fewer job than expected. June private payroll increased by 177k versus 190k forecast, while previous reading was upwardly revised to 189k. Initial jobless claims rose 3k to 231k last week, while market participants were looking for a print closer to 225k. June Nonfarm payrolls are due for release later today and should have eased to 195k (versus 223k in May). According to the latest forecast, the unemployment rate should have remained at 3.8%. As usual, investors will closely look for any signs of improvement in wages. Indeed, wage growth is the only missing piece of the full employment puzzle. Indeed, despite significant improvement in the labour market, wage growth barely matched inflation. When adjusted for inflation, labour costs have increased over the last twelve months (only 0.3%y/y in May).
However, in these troubled time, investors will pay less attention to hard data and focus on trade war developments between the US and China. The White House took a first stab on Friday as Donald Trump imposes new tariffs on $34bn of Chinese imports and threats it could reach $550bn should China retaliates. The US administration is also maintaining its plan to extend tariffs on another $16bn worth of goods. There is little China will back down; therefore, things will only get worse.
Financial markets were relatively stable this morning, which suggests that investors don’t really know where to stand on the prospect of a global trade war. The dollar index was down 0.10% to 94.30, the single currency rose 0.20% to 1.1715, while the Swiss franc and Japanese yen were treading water. The Chinese yuan was down only 0.10%. Equities were blinking green across the screen, while bond yields were relatively stable on both side of the Atlantic.
Forex Technical Analysis: EUR/USD, USD/JPY, GBP/USD
EUR/USD
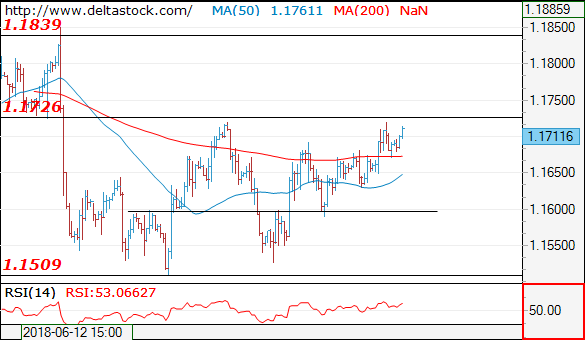
Current level - 1.1711
The pair is currently testing 1.1730 resistance area and I favor a break through the mentioned hurdle to allow a rise towards 1.1830. Initial intraday support lies at 1.1670, followed by the crucial 1.1630.
| Resistance | Support | ||
| intraday | intraweek | intraday | intraweek |
| 1.1730 | 1.1730 | 1.1670 | 1.1510 |
| 1.1830 | 1.1830 | 1.1600 | 1.1300 |
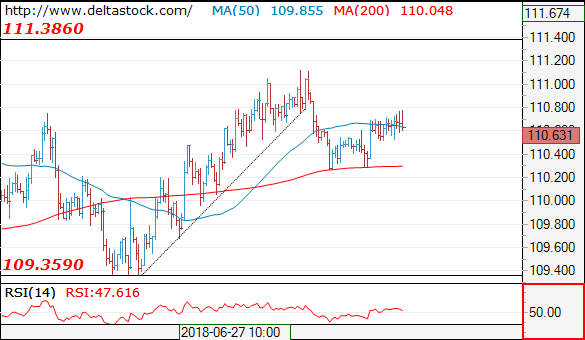
USD/JPY
Current level - 110.63
The outlook is bearish below 110.80, for a break through 110.25, towards 109.40.
| Resistance | Support | ||
| intraday | intraweek | intraday | intraweek |
| 110.80 | 111.40 | 110.25 | 107.80 |
| 111.40 | 114.40 | 109.40 | 106.70 |
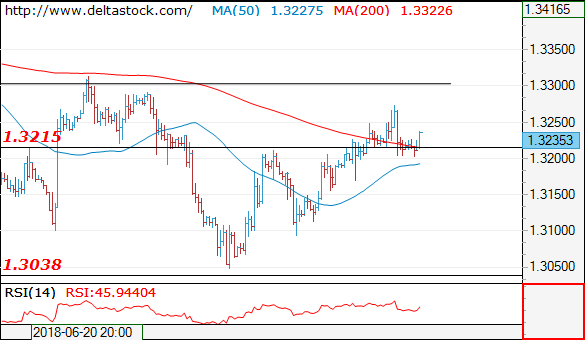
GBP/USD
Current level - 1.3235
My outlook remains positive for a rise towards 1.3310. Crucial is 1.3160.
| Resistance | Support | ||
| intraday | intraweek | intraday | intraweek |
| 1.3310 | 1.3618 | 1.3200 | 1.3040 |
| 1.3310 | 1.3990 | 1.3160 | 1.2770 |
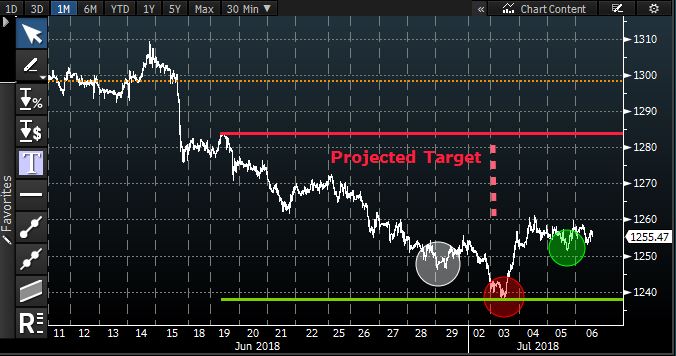
Gold Traders Cautious Ahead Of US NFP
- Bullish Pattern formed
- Price could test $1280
Traders are extremely cautious when it comes to gold. The trading range for gold is nearly six dollars today, this shows that capitulation may happen soon. The intraday price-action has a bullish setup and it shows that the price has the potential to test the level of 1280 in the coming days if the dollar weakness continues.