Sample Category Title
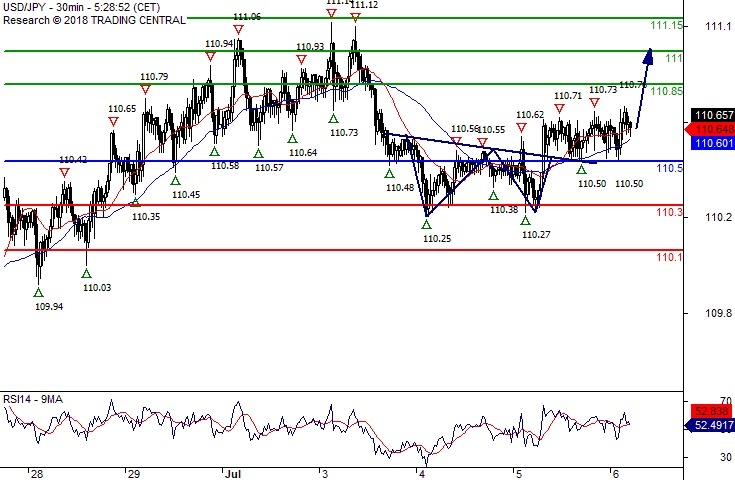
USD/JPY The Upside Prevails
Pivot (invalidation): 110.50
Our preference Long positions above 110.50 with targets at 110.85 & 111.00 in extension.
Alternative scenario Below 110.50 look for further downside with 110.30 & 110.10 as targets.
Comment A support base at 110.50 has formed and has allowed for a temporary stabilisation. The pair validated a Double Bottom: a bullish reversal pattern calling for a rebound.
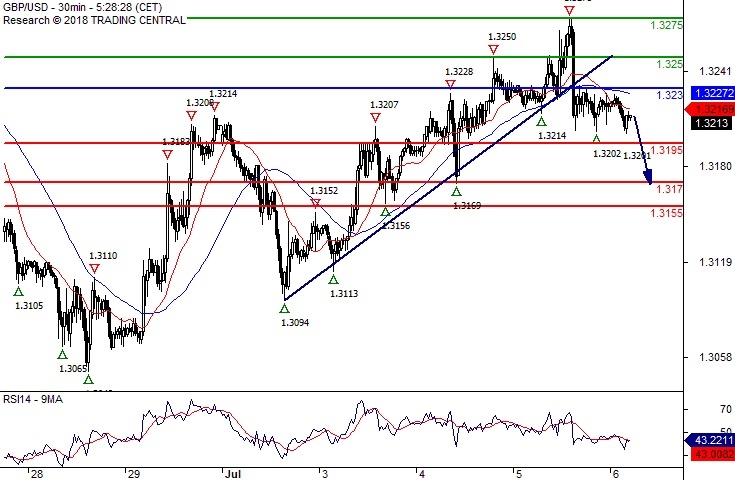
GBP/USD Under Pressure
Pivot (invalidation): 1.3230
Our preference Short positions below 1.3230 with targets at 1.3195 & 1.3170 in extension.
Alternative scenario Above 1.3230 look for further upside with 1.3250 & 1.3275 as targets.
Comment Technically the RSI is below its neutrality area at 50.
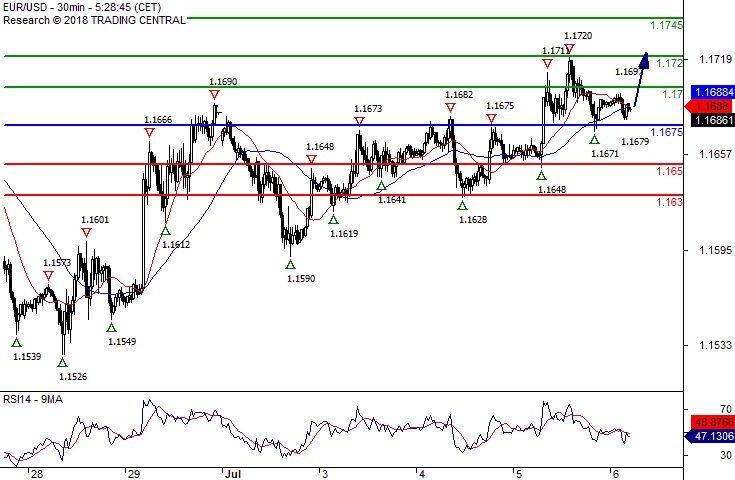
EUR/USD Bullish Bias Above 1.1675
Pivot (invalidation): 1.1675
Our preference Long positions above 1.1675 with targets at 1.1700 & 1.1720 in extension.
Alternative scenario Below 1.1675 look for further downside with 1.1650 & 1.1630 as targets.
Comment A support base at 1.1675 has formed and has allowed for a temporary stabilisation.
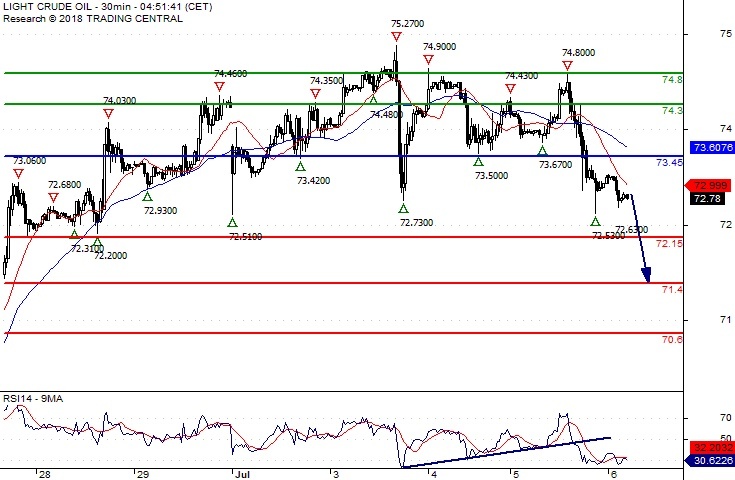
Crude Oil The Downside Prevails
Pivot (invalidation): 73.45
Our preference Short positions below 73.45 with targets at 72.15 & 71.40 in extension.
Alternative scenario Above 73.45 look for further upside with 74.30 & 74.80 as targets.
Comment The RSI advocates for further decline.
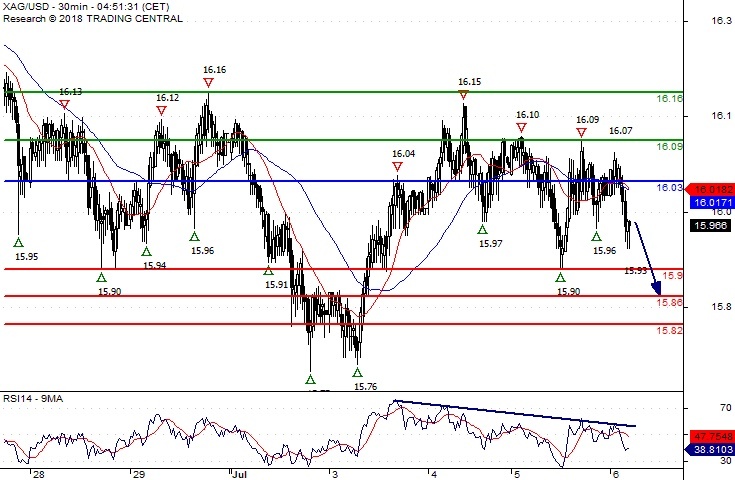
Silver Spot Under Pressure
Pivot (invalidation): 16.0300
Our preference Short positions below 16.0300 with targets at 15.9000 & 15.8600 in extension.
Alternative scenario Above 16.0300 look for further upside with 16.0900 & 16.1600 as targets.
Comment The RSI calls for a new downleg.
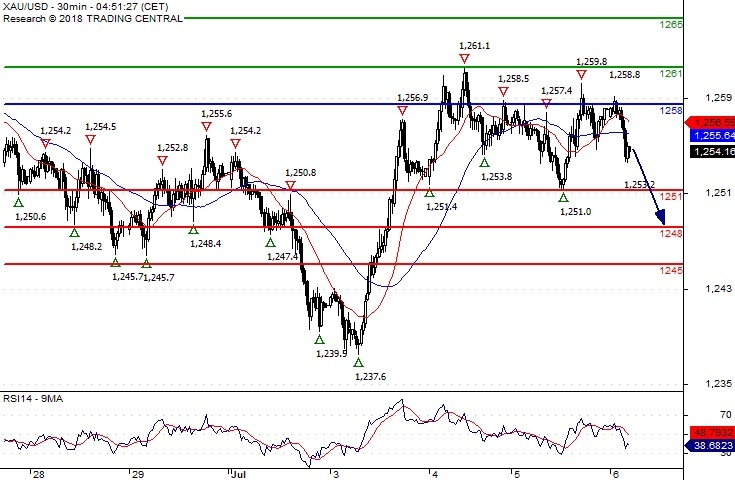
Gold Spot Turning Down
Pivot (invalidation): 1258.00
Our preference Short positions below 1258.00 with targets at 1251.00 & 1248.00 in extension.
Alternative scenario Above 1258.00 look for further upside with 1261.00 & 1265.00 as targets.
Comment The RSI shows downside momentum.
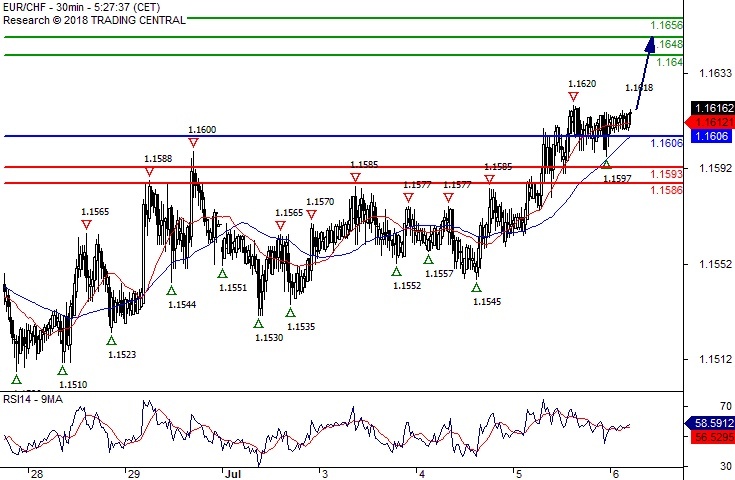
EUR/CHF As Long As 1.1606 Is Support Look For 1.1640
1.1606 is our pivot (invalidation) point.
Our preference As Long as 1.1606 is support look for 1.1640.
Alternative scenario The downside breakout of 1.1606 would call for 1.1593 and 1.1586.
Comment The RSI is above its neutrality area at 50. The MACD is positive and below its signal line. The pair could retrace. Moreover, the pair is trading above both its 20 and 50 MAs (respectively at 1.1614 and 1.1607).
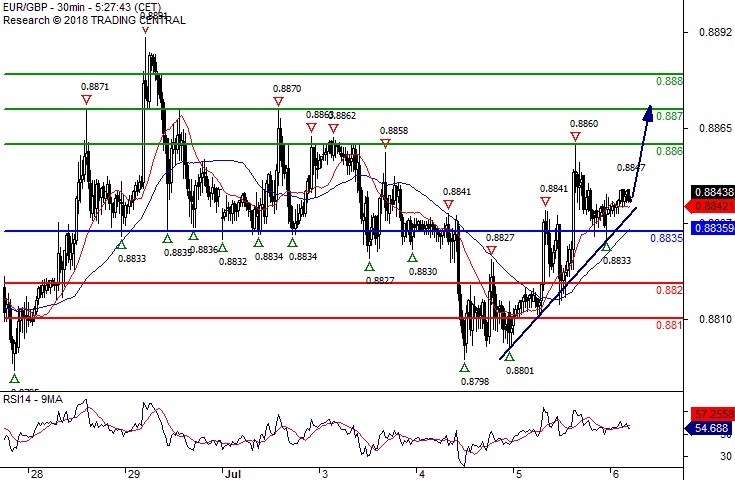
EUR/GBP The Upside Prevails
Pivot (invalidation): 0.8835
Our preference Long positions above 0.8835 with targets at 0.8860 & 0.8870 in extension.
Alternative scenario Below 0.8835 look for further downside with 0.8820 & 0.8810 as targets.
Comment The RSI lacks downward momentum.
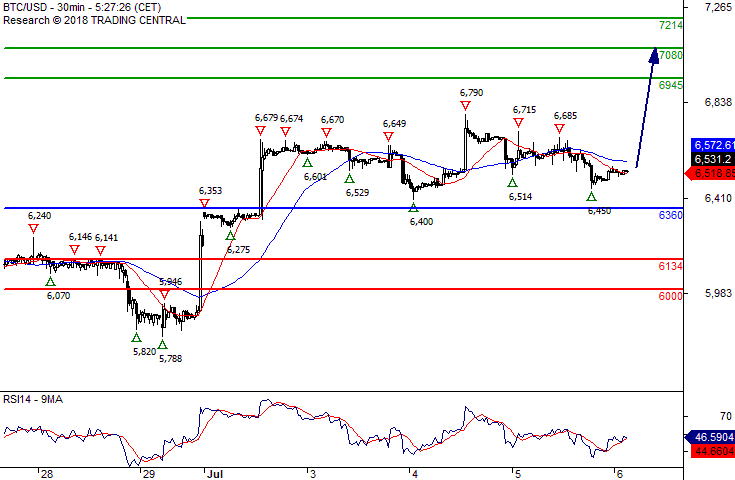
Bitcoin/Dollar Rebound Towards 6945
Our pivot (invalidation) point stands at 6360.
Our preference rebound towards 6945.
Alternative scenario The downside breakout of 6360 would call for 6134 and 6000.
Comment The RSI is below its neutrality area at 50. The MACD is above its signal line and negative. The configuration is mixed. Moreover, the pair stands above its 20 MA (6521) but below its 50 MA (6574).
USDCAD Bears Retake Control In Short-Term, Possibility Of Downside Retracement
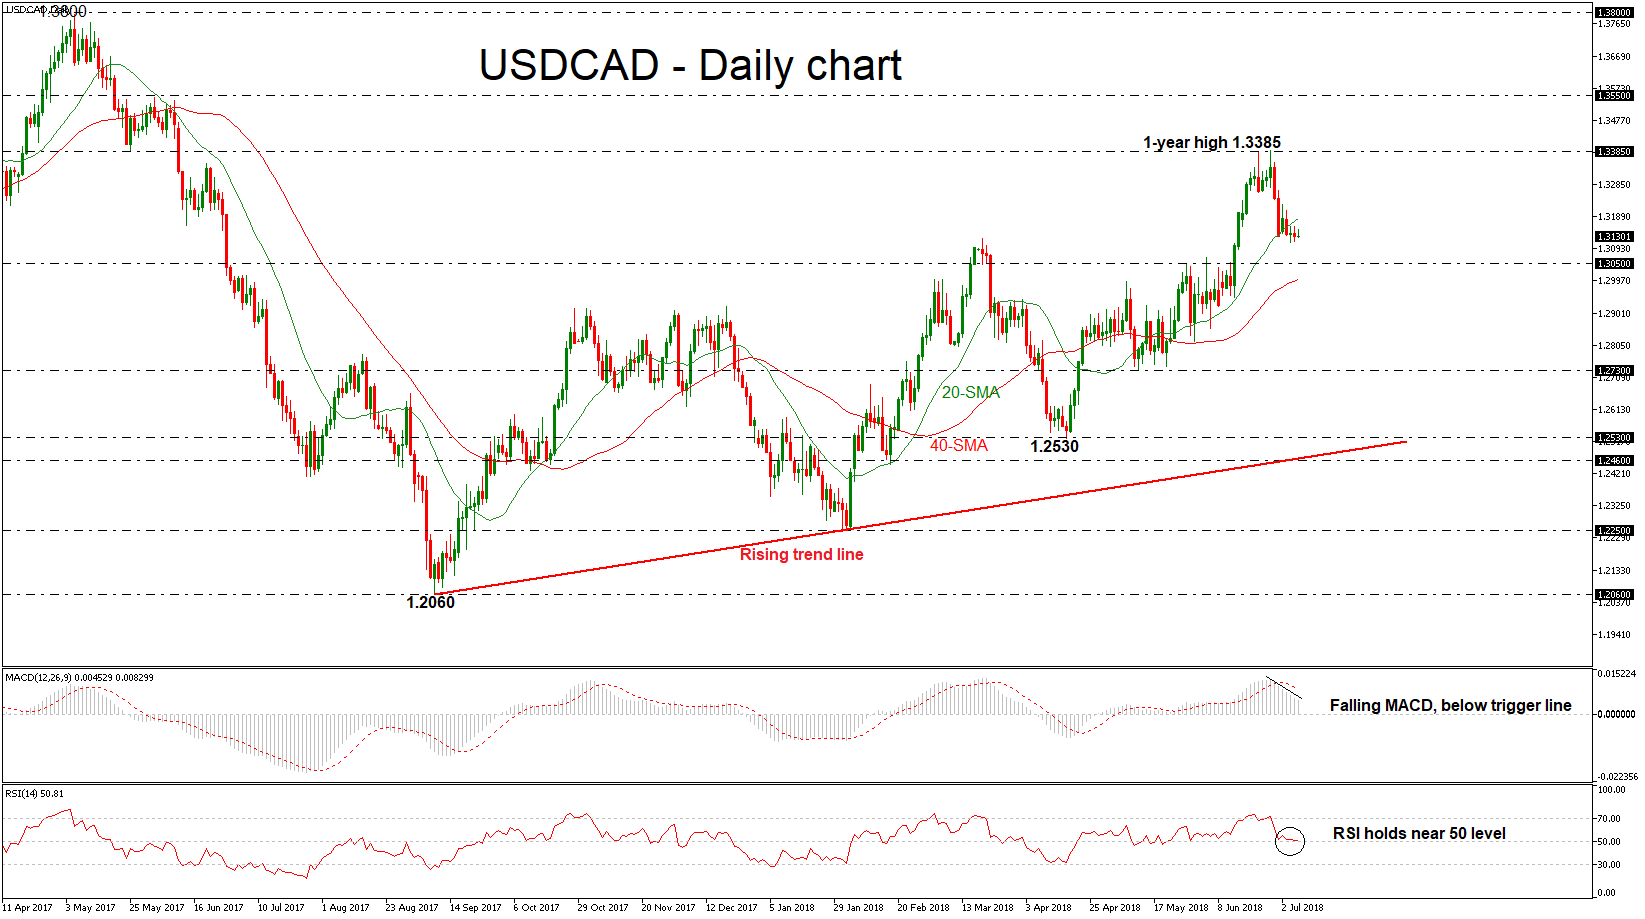
USDCAD continues the negative movement that started in the previous week following the pullback on the one-year high of 1.3385. The bearish run has not shifted yet the positive medium-term outlook to negative as it is still developing above the ascending trend line. The technical indicators, though are sending bearish signals in the near-term, suggesting that a downward correction is near.
Having a look at the daily chart, momentum indicators, they suggest further downside pressures may be on the cards in the short-term. The RSI is hovering near the neutral threshold of 50 detecting negative momentum and is also pointing downwards. The MACD, already negative, lies below its trigger line.
If the pair remains below the 20-day simple moving average (SMA), immediate support may be found at 1.3050. Furthermore, if bears manage to push the price below that hurdle that would mark a touch of the 1.2730 support, increasing the probability for further bearish extensions, but would first need to slip below the 40-day SMA near 1.3000 at the time of writing.
Alternatively, if the bulls drive USDCAD above the 20-day SMA, it could open the way towards the previous high of 1.3385. A potential upside violation of this zone would drive the price until the 1.3550 resistance barrier, identified by the June 2017 highs.
To sum up, the greenback seems to be in a strong bullish rally against the loonie in the medium-term as it is still holding above the ten-month rising trend line.