

Sample Category Title
Crude Oil: Oil Trading On A Weaker Footing This Morning
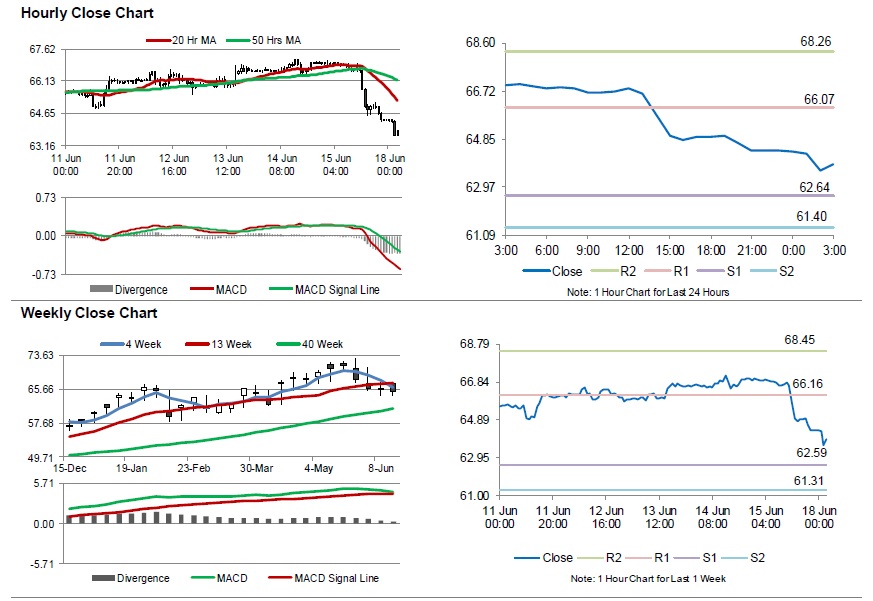
For the 24 hours to 23:00 GMT, Crude Oil declined 3.35% against the USD and closed at USD64.67 per barrel on Friday, after Baker Hughes reported that the US oil rigs count advanced by 1 to 863 in the week ended 15 June 2018.
In the Asian session, at GMT0300, the pair is trading at 63.88, with oil trading 1.22% lower against the USD from Friday’s close, amid expectations that Russia and Saudi Arabia will raise production.
The pair is expected to find support at 62.64, and a fall through could take it to the next support level of 61.40. The pair is expected to find its first resistance at 66.07, and a rise through could take it to the next resistance level of 68.26.
Crude oil is trading below its 20 Hr and 50 Hr moving averages.
EUR/USD Bullish Retracement Back To 38.2% Fib Resistance
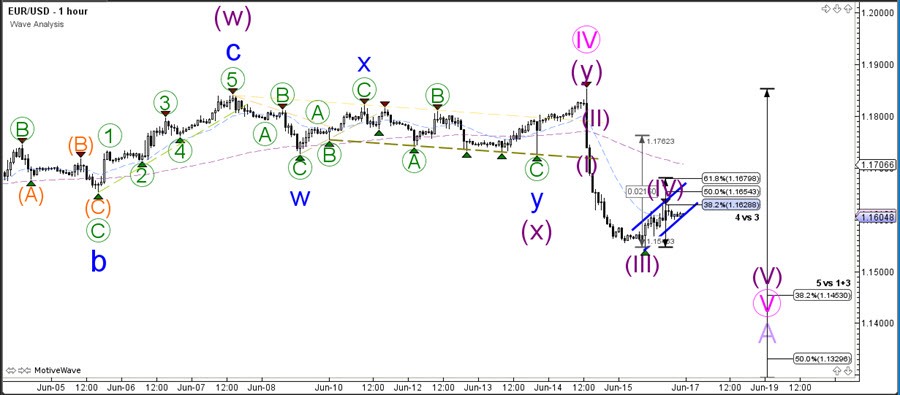
The EUR/USD bearish breakout is developing a bullish retracement, which could be a pullback within the larger downtrend.
The EUR/USD could continue with the downtrend if it makes a bearish bounce. Strong bullish price action could invalid the bearish continuation.
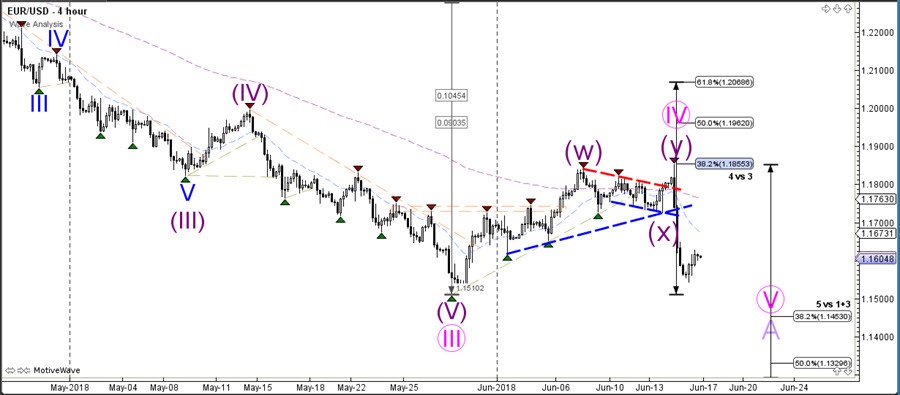
The EUR/USD seems to be building a wave 4 (purple) at the moment. The Fibonacci levels of wave 4 could be resistance spots for a downtrend continuation. A breakout above the 50-61.8% Fib makes a wave 4 pattern less likely. The 1.1450 is a strong support zone due to a 50% Fib from the weekly chart.
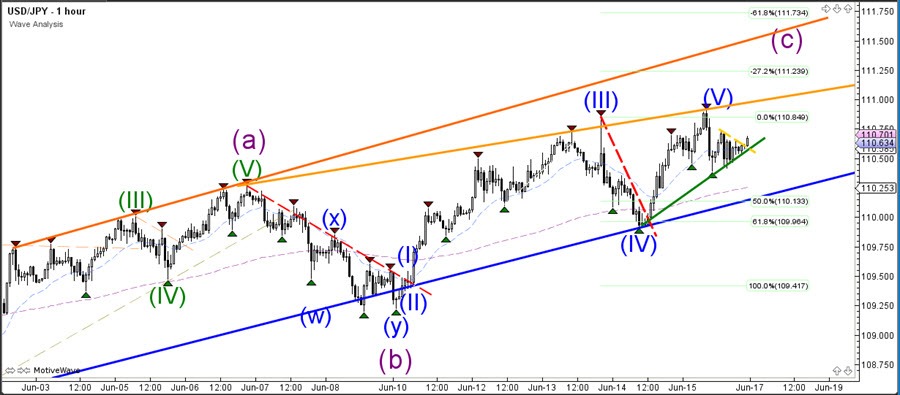
USD/JPY Bullish Continuation In Wave C Above 111 Tops
The USD/JPY is in a bullish wave C (purple) momentum which could be strong enough to break above resistance and reach the Fibonacci targets at 113.50.
The USD/JPY needs to break above the trend lines for an uptrend continuation. But the current momentum could be strong enough to achieve this. A bearish break below the uptrend channel invalidates the bullish wave C.
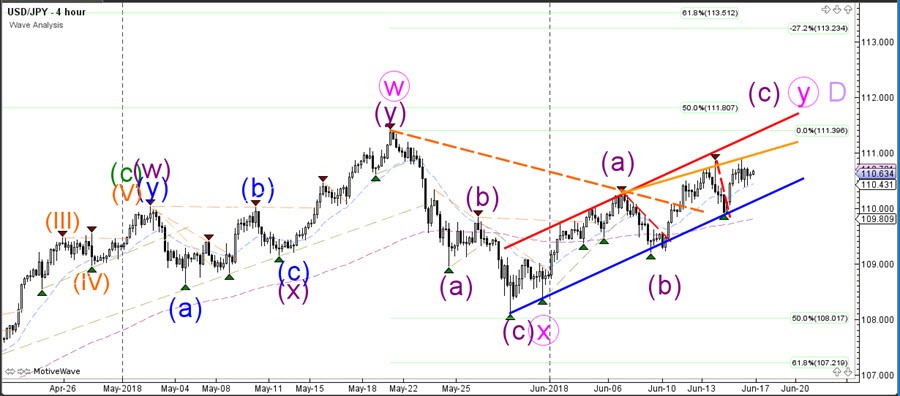
The USD/JPY broke a small resistance trend line but will also need to break above the larger 111 round level and previous tops before more upside becomes likely.
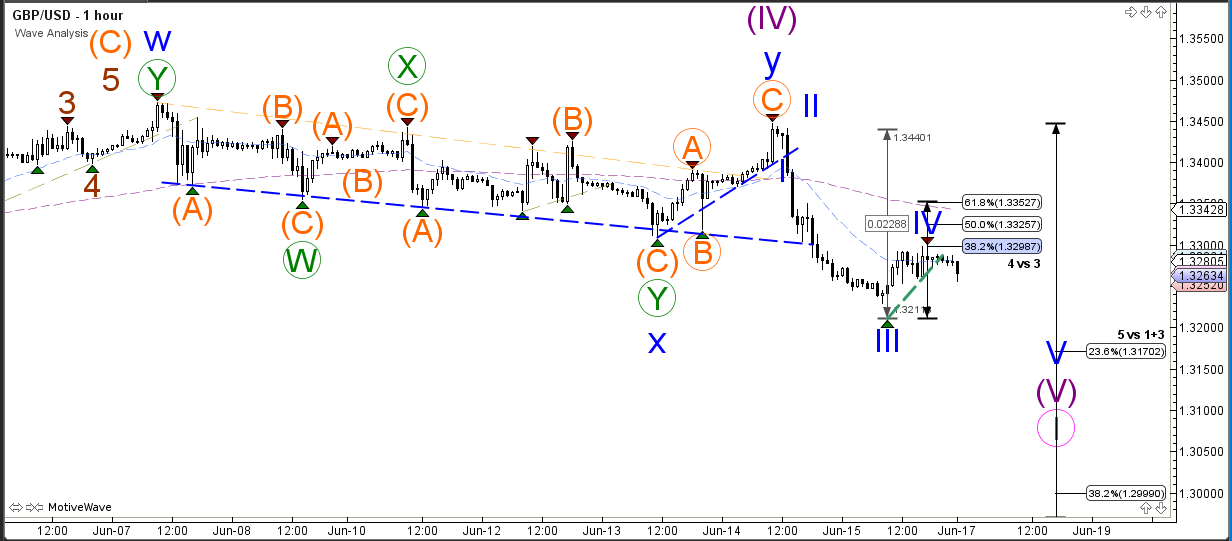
GBP/USD Wave 4 Bounce At 38.2% Fib Challenges 1.32
The GBP/USD bearish breakout is seeing a bullish retracement at the moment but the downtrend could continue if the price manages to break below 1.32. In that case the next target could be at 1.30.
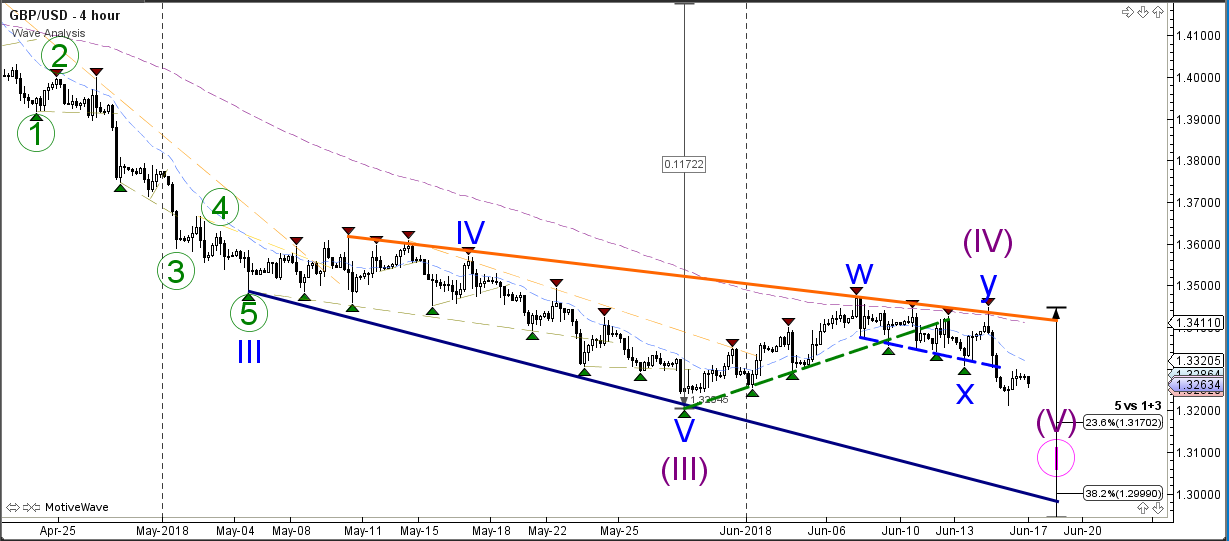
The GBP/USD seems to be building a wave 4 retracement. The price has respected and turned at the 38.2% Fibonacci retracement levels, which could indicate the start of a wave 5.
EUR/JPY Daily Outlook
Daily Pivots: (S1) 127.92; (P) 128.22; (R1) 128.73; More....
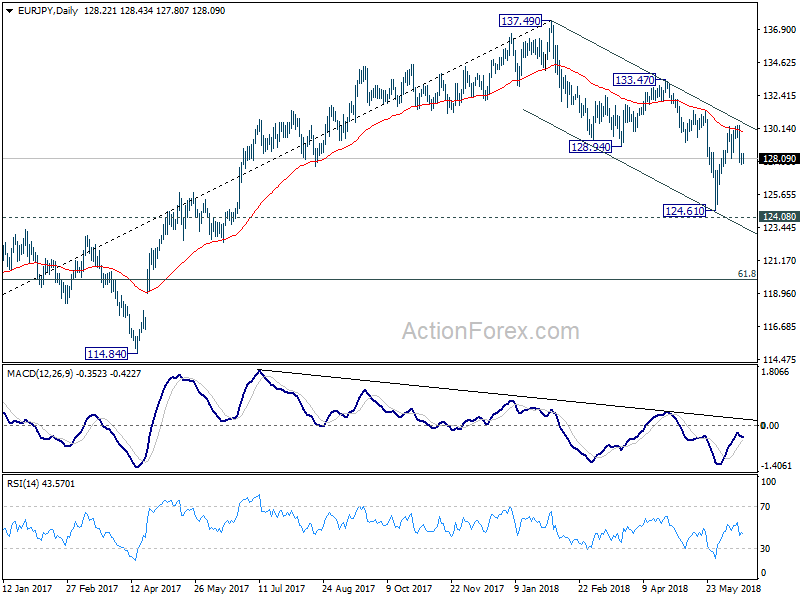
Intraday bias in EUR/JPY remains neutral for the moment, with focus on 127.69 support minor. Break there will indicate completion of rebound from 124.61, after rejection by 55 day EMA. Deeper fall would be seen back to retest 124.61, with prospect of resuming larger decline from 137.49. On the upside, though, break of 130.33 will resume the rebound from 124.61 to retest 133.47 resistance.
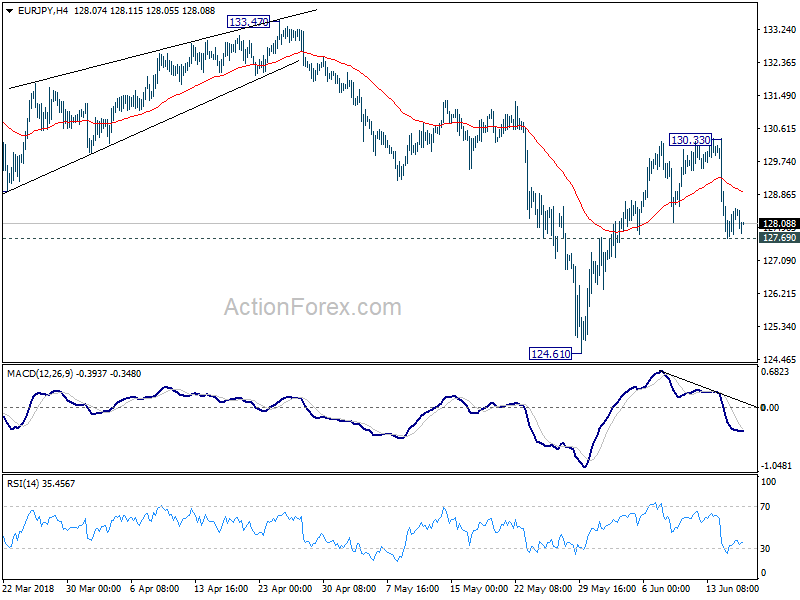
In the bigger picture, despite rebounding strongly ahead of 124.08 resistance turned support, there was no clear follow through buying. Note again that there is bearish divergence in daily MACD. Firm break of 124.08 will confirm trend reversal. That is, whole rise from 109.03 (2016 low) has completed at 137.49 already. In that case, deeper fall should be seen back to 61.8% retracement of 109.03 to 137.49 at 119.90 and below. Nonetheless, decisive break of 133.47 key resistance will likely extend the rise from 109.03 through 137.49 high.
Yen Higher as Sentiments Weighed Down by Trade Tensions and Osaka Earthquake
Yen trades generally higher in Asian session today on mild risk aversion. Escalation of trade tension between US and China is a factor weighing on sentiments. The 6.1 earthquake in Osaka also pressures Japanese stocks. Nikkei is trading down -0.8% at the time of writing. Euro is broadly lower on ECB rate outlook and is set to weakens further. Sterling follows as the second weakest. In other markets, Gold trades mildly lower but is capped well below 1300 handle. WTI crude oil also trades low and is pressured before 64 handle.
Economic calendar is light today. UK Rightmove house prices rose 0.4% mom in June. Japan surprising recorded JPY -0.30T trade deficit in May. US will release NAHB housing market index later in the day. Though, a number of central banks are scheduled to speak, including Fed's William Dudley, Raphael Bostic, John Williams; BoC's Lynn Patterson and ECB's Mario Draghi
Technically, while Dollar was strong last week, EUR/USD is holding above 1.1509 near term support. GBP/USD is also held above 1.3203. These two levels are critical on whether Dollar can resume recent up trend in near term.
A quick recap on US-China trade war
Here's a quick recap on US-China trade war. Last Friday, the US Trade Representative formally announced the section 301 tariffs on Chinese imports, targeting products related to the Made in China 2025 policy. There are two set of tariffs lines. The first set contains 818 lines of the original 1,333 lines announced in April. This set covers around USD 34B of Chinese imports. 25% tariffs will be imposed starting July 6, 2018. The second set contained 284 proposed tariff lines, covering around USD 16B in Chinese goods. This set will undergo further public view before finalizing.
Soon after, China announced the retaliation measures, targeting USD 50B of US products. The first set of productions include soybean, agricultural products, automobiles. These products are valued at around USD 34B, will be subjected to 25% tariffs, starting July 6, 2018. China would also impose 25% tariffs on other products, valued at around USD 16B, including chemicals, medical equipment, and energy products. Effective date is to be determined.
Stopping war games could weaken US rationale to ask South Korea to pay more
The Yonhap news agency reported that South Korea and the US would announce suspension of large scale joint military exercises this week, amid the negotiations with North Korea on denuclearization. A "snapback" clause, though, would be included if North Korea fails to deliver its promises.
Yonhap also reported that suspension of the exercises could "weaken Washington's rationale for an increase in Seoul's share of the cost for the upkeep of 28,500 U.S. troops in the country." And the US has been demanding the South to pay more. There will be a fourth round of so-called burden sharing costs negotiations in Seoul later this month.
Meanwhile, Trump also made clear it's his request to stop the "war games" as they are "very expensive" with his tweet.
BCC: UK economy in a torpor amid Brexit uncertainties, rate hikes, trade war and oil prices
The British Chambers of Commerce slightly downgraded UK growth forecasts for 2018 to 1.3%, from 1.4%. For 2019, growth projection was downgraded to 1.4%, from 1.5%. And it said that, if realized, 2018 would be the weakest year since 2009. And it warned that the economy is in a " torpor, with uncertainties around Brexit, interest rate rises, and international developments such as a possible trade war and rising oil prices" all having an impact.
BCC said in a statement that "the downgrades have been largely driven by a more lacklustre outlook for consumer spending, business investment and trade". And, growth in real wages is not expected to "translate into materially stronger spending over the forecast horizon". And "weak productivity" would continue to limit wage growth. Household finances will remain "stretched amid historically low household savings and high debt levels."
Business investment growth is expected to slow sharply to 0.9% in 2018, down from 2.4% in 2019 on Brexit uncertainties. Next trade position is also expected to "weaken over the next few years". Services growth is projected to slow to 1.2% in 2018, weakest since 2010.
NZIER: Growth and NZD expectations lowered
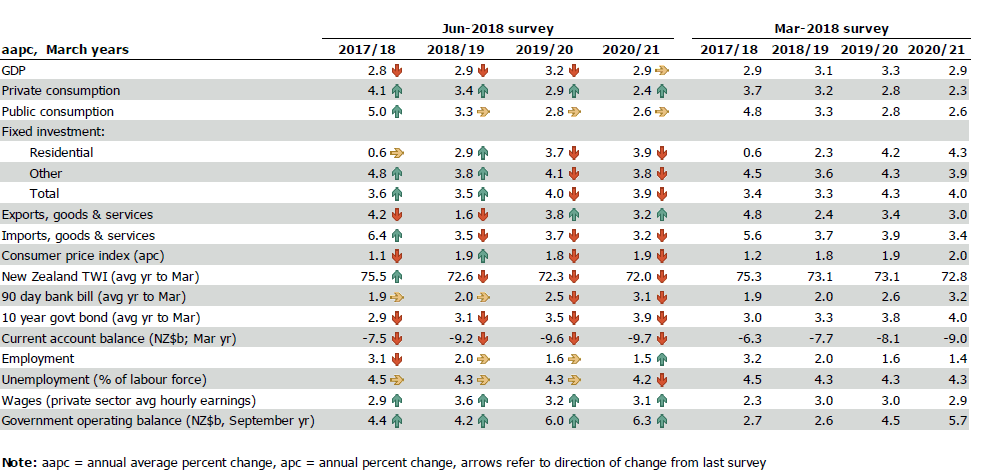
The NZ Institute of Economic Research downgraded growth forecast for the New Zealand economy. Weaker exports "drive much of this downward revision in near term". But from 2019 onwards, "expectations of weaker growth in investment explain the softer growth outlook". Though, NZIER noted that expectations for growth remain reasonably healthy through to 2021.
Real GDP growth is projected to be 2.8% in 2017/18, 2.9% in 2018/19, 3.2% in 2019/20 and 2.9% in 2020/21. That compares to March survey result of 2.9% in 2017.19, 3.1% in 2018/19, 3.3% in 2019/20 and 2.9% in 2020.21. .
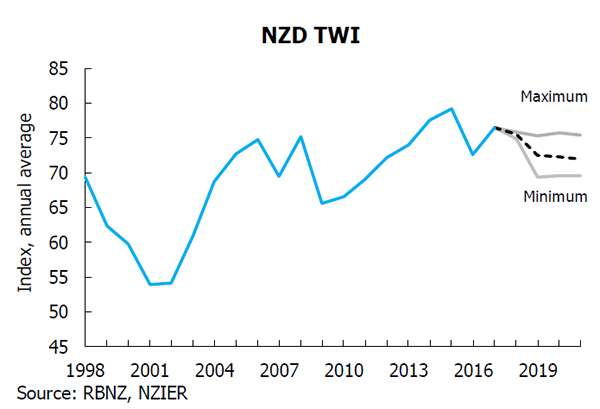
NZD expectations were also revised lower. NZIER pointed to Fed's rate hike in the coming year. Meanwhile, RBNZ is expected to keep OCR on hold "until at least the middle of next year". And, "this should reduce the yield attractiveness of the NZD, and hence weigh on the currency.
New Zealand Dollar TWI is projected to average at 75.5 in 2017/18, 72.6 in 2018/19, 72.3 in 2019/20 and 72.0 in 2020/21. That compares to March survey result of 75.2 in 2017/18, 73.1 in 2018/19, 73.1 in 2019/20 and 72.8 in 2020/21.
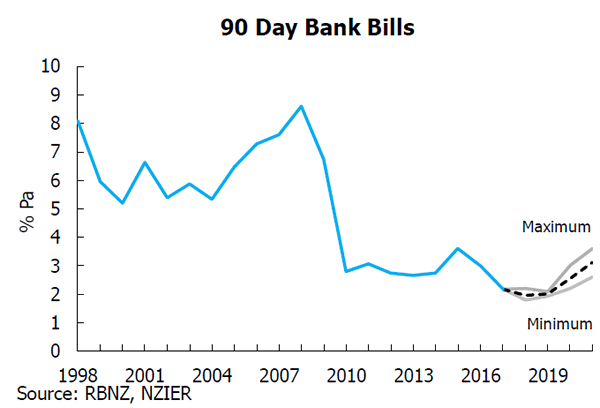
NZIER also noted that RBNZ's May MPS indicates that "interest rates were just as likely to go down as up." Nonetheless " the central bank's forecasts indicate the OCR is likely to increase, although not till later in 2019. Consensus Forecasts for interest rates have been revised slightly lower from 2019."
BoE, SNB and OPEC to highlight a relatively light week
Looking ahead, BoE and SNB rate decisions are two major focuses this week. Both are expected to stand pat on monetary policies. It's uncertain whether BoE is ready for a rate hike in August, but we're not expecting any hint from this week's announcements. RBA and BoJ minutes will also be watched. Economic data is a bit on the light side with major ones scheduled towards the end of the week. New Zealand GDP, Eurozone PMIs, Japan CPI, Canada retail sales and CPI are the more important ones. Also, OPEC's decision on raising production could have a negative impact on oil price and Canadian Dollar.
- Monday: US NAHB housing market index
- Tuesday: RBA minutes, house price index; Swiss SECO economic forecasts; Eurozone current account; US housing starts and building permits
- Wednesday: BoJ minutes; German PPI; US current account, existing home sales
- Thursday: New Zealand GDP; Swiss trade balance, SNB rate decision; UK public sector net borrowing, BoE rate decision; Canada wholesale sales; US Philly Fed survey, jobless claims, house price index, leading indicators
- Friday: Japan national CPI core, PMI manufacturing, all industry index; Eurozone PMIs; Canada retail sales, CPI; US PMIs
EUR/JPY Daily Outlook
Daily Pivots: (S1) 127.92; (P) 128.22; (R1) 128.73; More....
Intraday bias in EUR/JPY remains neutral for the moment, with focus on 127.69 support minor. Break there will indicate completion of rebound from 124.61, after rejection by 55 day EMA. Deeper fall would be seen back to retest 124.61, with prospect of resuming larger decline from 137.49. On the upside, though, break of 130.33 will resume the rebound from 124.61 to retest 133.47 resistance.
In the bigger picture, despite rebounding strongly ahead of 124.08 resistance turned support, there was no clear follow through buying. Note again that there is bearish divergence in daily MACD. Firm break of 124.08 will confirm trend reversal. That is, whole rise from 109.03 (2016 low) has completed at 137.49 already. In that case, deeper fall should be seen back to 61.8% retracement of 109.03 to 137.49 at 119.90 and below. Nonetheless, decisive break of 133.47 key resistance will likely extend the rise from 109.03 through 137.49 high.
Economic Indicators Update
| GMT | Ccy | Events | Actual | Forecast | Previous | Revised |
|---|---|---|---|---|---|---|
| 23:01 | GBP | Rightmove House Prices M/M Jun | 0.40% | 0.80% | ||
| 23:50 | JPY | Trade Balance (JPY) May | -0.30T | 0.14T | 0.55T | 0.45T |
| 14:00 | USD | NAHB Housing Market Index Jun | 70 | 70 |
China Growth Weakened Significantly in May. Crackdown on Credit is Biting
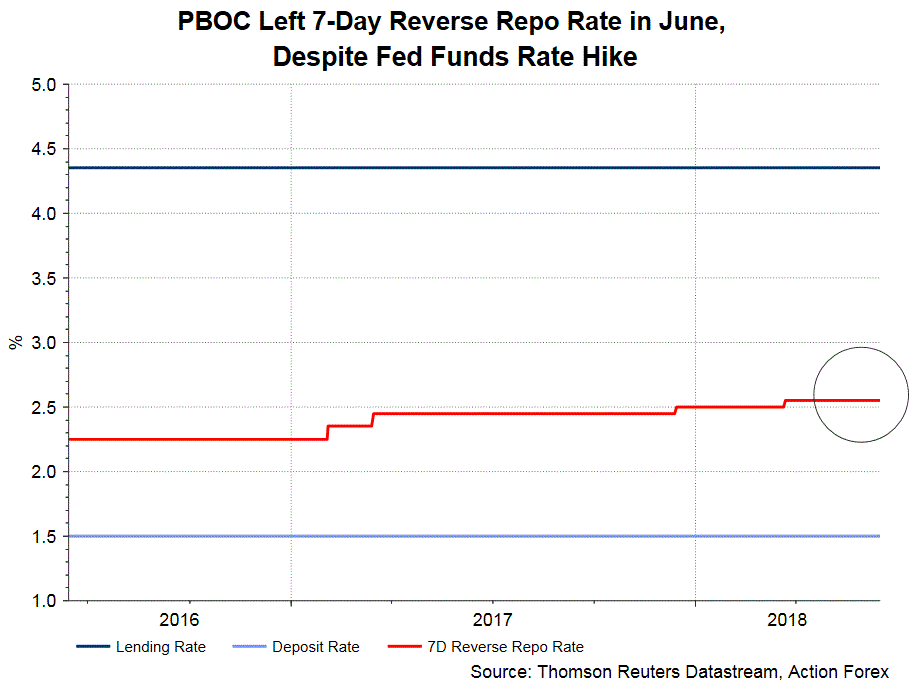
We expect the slowdown in China’s economic growth would be increasingly evident in coming months, reflecting the rapid moderation in credit growth in the first half of the year. PBOC left its policy rate unchanged, although FOMC lifted the Fed funds rate by +25 bps, in June. This was in contrast with the actions in December 2017 and March 2018, when PBOC raised interest rates in sync with the Fed’s moves. Recent economic developments and PBOC’s actions have been consistent with our assessment that China’s growth is slowing down and the government has tilted its focus of monetary stance to growth stability from deleveraging. If the government fails to contain the current situation, risk is skewed to the downside for full-year GDP growth to reach the “about +6.5%” target.
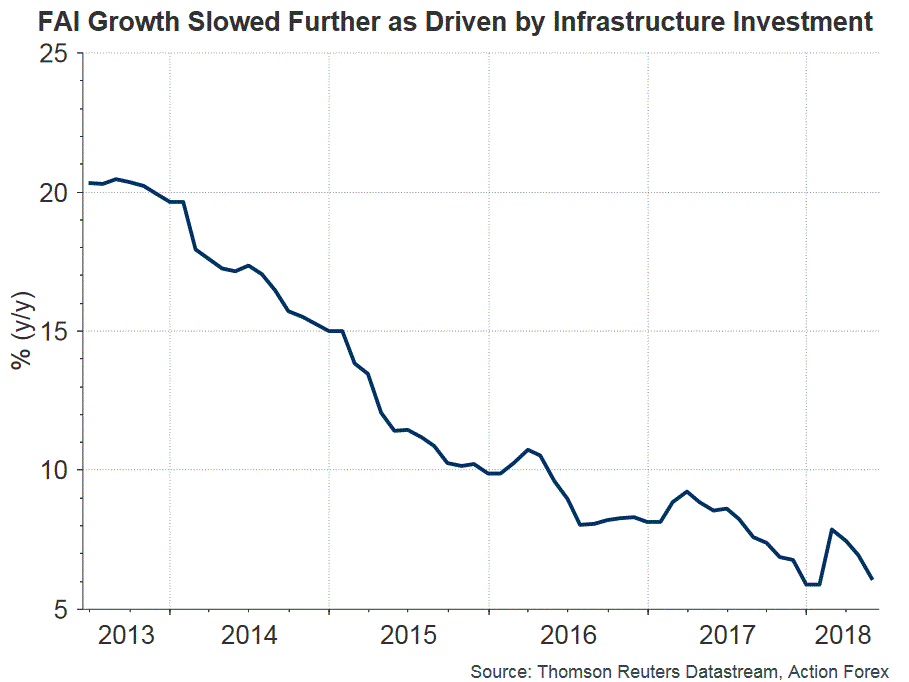
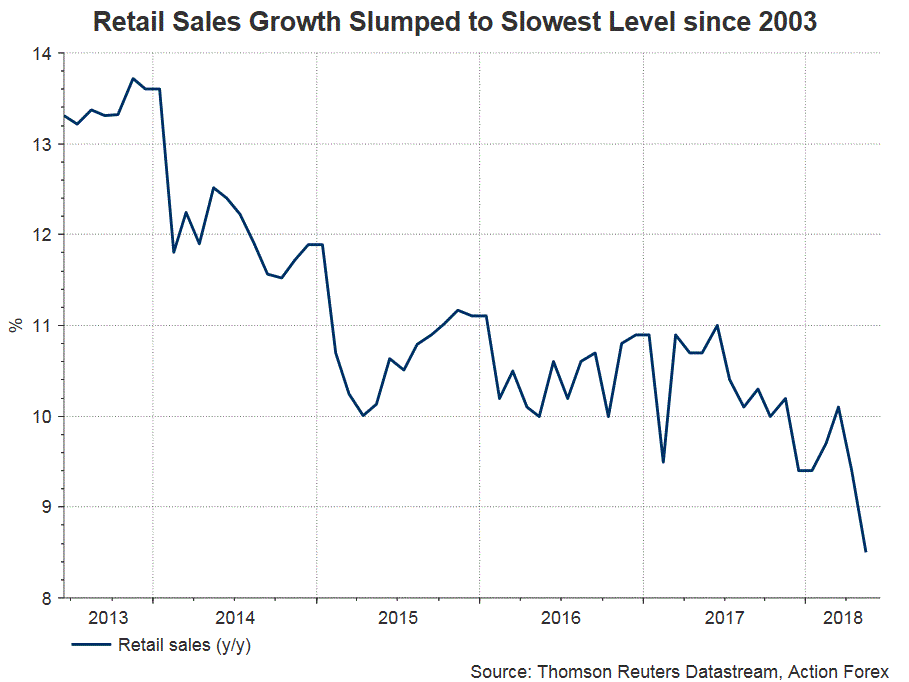
Taking a look at May’s activity, growth in industrial production (IP) eased to +6.8% y/y, from 7% in April and consensus of +7%. Retail sales grew +8.5% y/y, easing from +9.4% in April. The market had anticipated growth to pick up to +9.6%. Urban fixed-asset investment (FAI) increased a mediocre +6.1% in the first five months of the year, compared with a +7% growth in the first four months. The market had anticipated a growth of +7%. The deceleration in infrastructure investment (+5% vs +7.6% in Jan-April and +8.3% in 1Q18) was significant, outweighing an improvement in manufacturing investment and stable real estate investment. This is a result of the crackdown of local-government financing channels (more below). Manufacturing investment growth gather momentum for two months in a row, expanding +5.2% y/y, vs +4.8% in Jan-April and +3.8% in 1Q18. Industrial profits and investment in high-tech sectors should continue to lend support to this front. Real estate investment steadied, growing +10.2% y/y, compared with +10.3% in Jan- April and +10.4% in 1Q18. The dataflow reinforces that China is undergoing cyclical economic slowdown, exacerbated by the government’s de-leveraging policies over the past few quarters.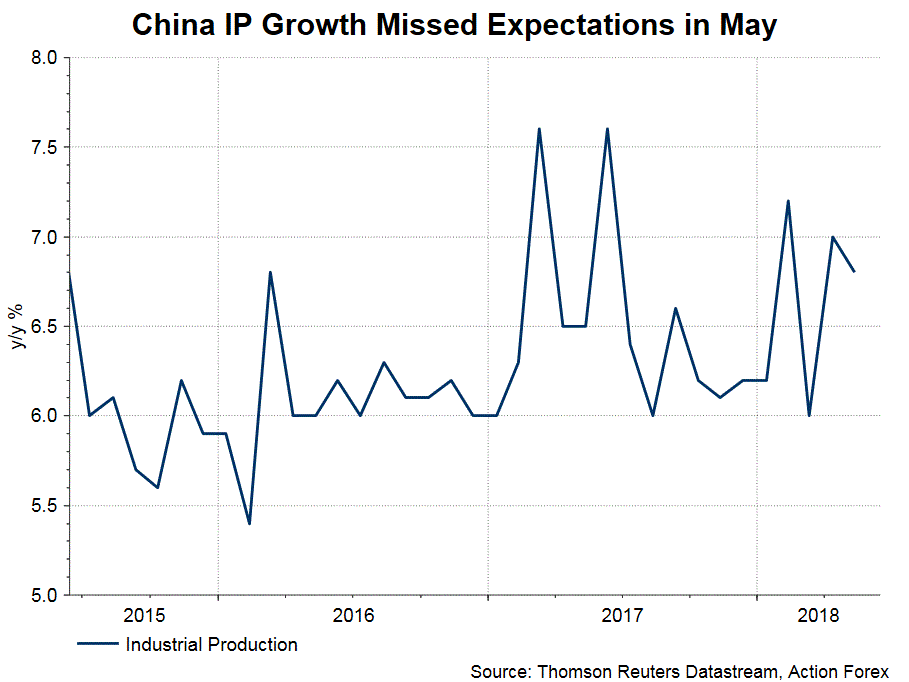
In a separate report, it is shown that China’s credit growth has reached the slowest growth on record in May. Total social financing (TSF), a broad measure of credit and liquidity in the economy, plunged to RMB 761B, much weaker than consensus of RMB 1300B and April's RMB 1560B. The outstanding TSF was RMB 182.14 trillion at the end of last month, up 10.3% y/y, compared with +10.5% y/y growth in April. The decline in non-bank finance (-RMB 422B) contributed to most of the slowdown, as the government took action to crack down shadow banking and off-balance sheet lending. These are the major source of funding for local governments to finance their projects. The slump in this source of financing has then led to the significant slowdown in infrastructure investment growth (as shown in FAI in May).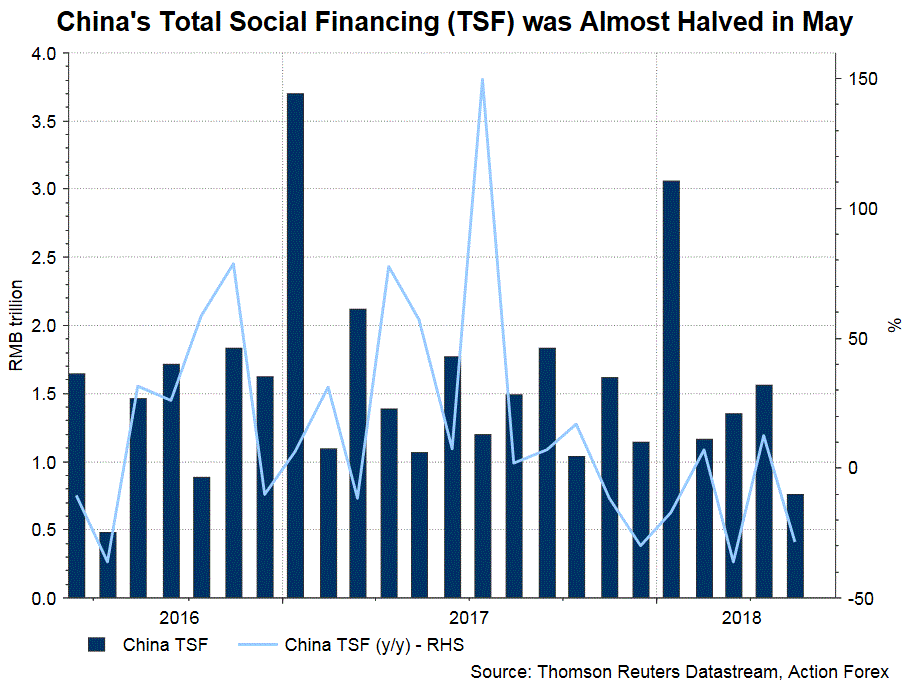
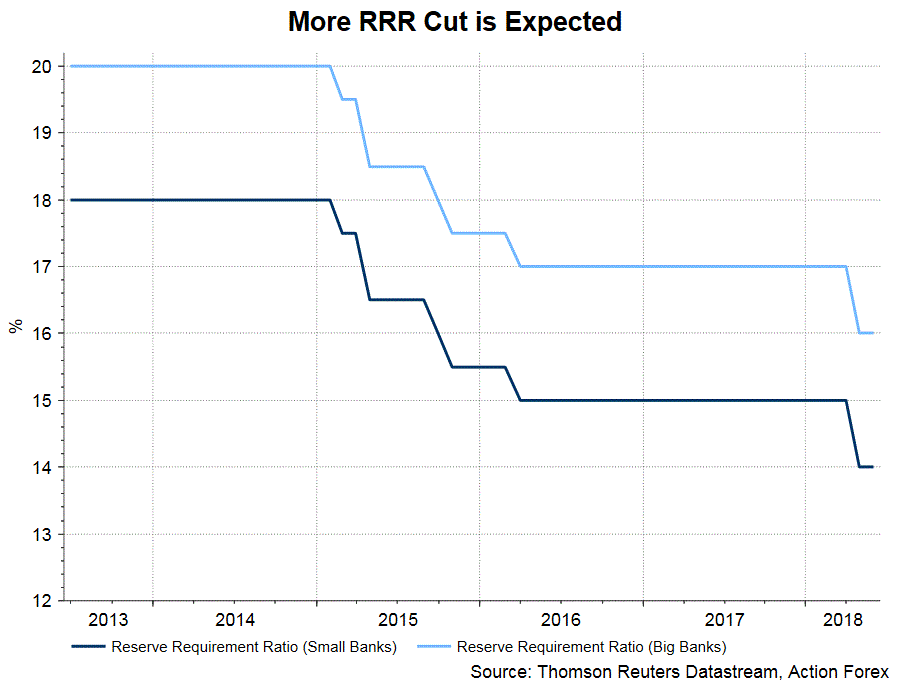
On the monetary policy, PBOC last week left its open market operation (OMO) rates unchanged, despite Fed’s widely- anticipated rate hike and consensus of a +5 bps increase. This has further confirmed our assessment that the Chinese central bank has shifted its focus to a monetary policy stance with slight easing bias. We caution that the easing bias might intensify as driven by trade war. Besides leaving interest rates unchanged in May, PBOC had introduced targeted RRR in January and reduced RRR by 100 bps in April. We expect further reduction in RRR in coming months.
Market Morning Briefing: Pound Could Be Bearish Towards 1.30 In The Medium Term
STOCKS
Overall global equity indices look bearish for the coming sessions.
Dow (25090.48, -0.34%) has come off in line with our expectations and could test support near 25000. Watch price action there as a break below 25000 would be bearish for the medium term. But if 25000 holds, we could see a bounce from there towards 25500 again.
Dax (13010.55, -0.74%) did not see follow through buying above 13100 and came off from the close of 13107 seen on Thursday. Failure to see immediate rise above 13100 would be indicative of medium term bearishness towards 12800 or even lower.
Fall in Dollar Yen to 110.38 has prevented a rise above 22800 in Nikkei (22662.68, -0.83%) bringing it sharply down to current levels of 22660. While the fall sustains, a test of 22400-22200 looks possible.
Shanghai (3021.90, -0.73%) is almost stable at current levels and needs to dip below 3000 to indicate medium term bearishness. We would watch closely the price movement in the 3000-3050 region as there is lack of clarity on further course of direction just now.
Nifty (10817.70, +0.089%) needs to see an immediate break above 10850 to move up in the coming sessions towards 10950. While immediate daily resistance holds at 10850, there is some scope of a fall towards 10650 on the downside.
COMMODITIES
Commodities look weak too. Gold could come off in the medium term while the Crude prices could find some support below current levels in the next few sessions.
Brent (72.62) and WTI (63.80) have fallen sharply in the last couple of sessions. WTI looks bearish towards 62 on the weekly candle charts while the weekly line charts looks strongly bearish with a possibility to test 60 or even lower. Brent may test weekly support of 71-70 before bouncing back from there.
Gold (1279.80) has broken first support at 1280 and while it sustains to move lower and breaks below 1275, we may see chances of 1260-1250 opening up on the downside for Gold in the medium term.
Silver (16.49) has also fallen sharply and could head towards 16.25-16.00 in the near term. View is bearish.
Copper (3.13) has come off further from levels near 3.20 and could test immediate support near 3.10. Failure to bounce back from 3.10 would lead to a full retracement of the rise from 3.00 to 3.30 in the longer run.
FOREX
Euro (1.1585): The ECB's plan of keeping key rates constant till 2019 summers made the Euro fall from 1.185 to a low near 1.155. Support at 1.155 is holding for now. Euro could test levels near 1.165 this week, while above 1.155-1.150.
Dollar Index (94.89): The ECB policy-induced Euro fall and a strong US Retail Sales data release led to rise in Dollar strength last week. This week could see a downmove in the Index towards 94.3-94.2, while it stays below resistance near 95.5.
Dollar Yen (110.44): Dollar Yen tested a high near 110.9 on Friday, thereby testing resistance on daily candles and daily line chart. In this week, it could test higher resistance near 111.5 on 3 day candles, which is a crucial long term resistance level and is likely to hold.
Euro Yen (127.93): Euro Yen continues to trade near horizontal support on weekly line chart. Targets of 111.5 and 1.165 on Dollar Yen and Euro respectively implies levels near 129.8-130.0 for the Euro Yen, which corresponds to a test of resistance on daily candles. While below 130.5, Euro Yen is looking bearish in the medium term.
Pound (1.3264): Pound could be bearish towards 1.30 in the medium term. However in this week, there are equal chances of it moving up to test resistance on daily candles near 1.335-1.340 or moving down towards 1.315.
Dollar Rupee (68.015) : Dollar rupee looks bullish towards 68.25 but the rise could be gradual.
INTEREST RATES
Last week, US Fed had hiked rates by 25 bps. Although the rate hike was expected, the language in the policy statement turned out to bemore hawkish than expected. The likelihood of 2 more rate hikes this year has increased beyond 50% for the first time this year. This hawkishness was seen in a rise in the US 10 Year yield towards 2.97%.
The US 10 Year yield (2.91%) seems to be breaking support on medium term chart. If this break happens, our earlier forecast of medium term bearishness towards 2.60%-2.55% might come into play.
US 10 - 2 Year yield Spread (0.367%) has broken long term support near 0.4% against our expectation. If this break persists, it could be negative for the US economy.
Last week, the ECB came out with a mixed policy. The end of quantitative easing was expected by the markets – however that was overpowered by its dovish stance on interest rates, which led to a fall in the German 10 Year yield towards 0.4%.. On medium term chart, the German 10 Year yield looks bearish towards 0.3%; but for that, it would have to break support on short term chart near 0.4%
NZIER: Growth and NZD expectations lowered
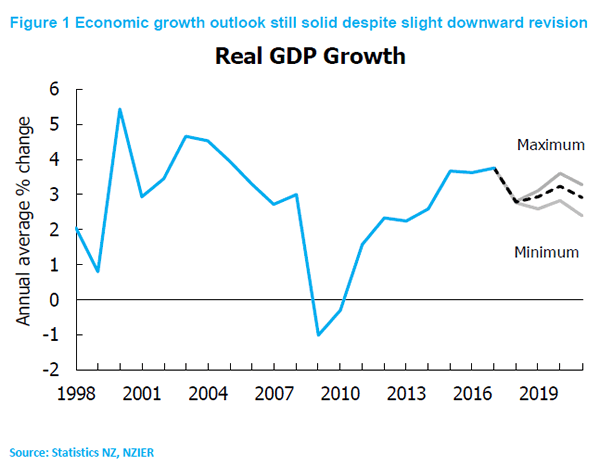
The NZ Institute of Economic Research downgraded growth forecast for the New Zealand economy. Weaker exports "drive much of this downward revision in near term". But from 2019 onwards, "expectations of weaker growth in investment explain the softer growth outlook". Though, NZIER noted that expectations for growth remain reasonably healthy through to 2021.
Real GDP growth is projected to be 2.8% in 2017/18, 2.9% in 2018/19, 3.2% in 2019/20 and 2.9% in 2020/21. That compares to March survey result of 2.9% in 2017.19, 3.1% in 2018/19, 3.3% in 2019/20 and 2.9% in 2020.21. .
NZD expectations were also revised lower. NZIER pointed to Fed's rate hike in the coming year. Meanwhile, RBNZ is expected to keep OCR on hold "until at least the middle of next year". And, "this should reduce the yield attractiveness of the NZD, and hence weigh on the currency.
New Zealand Dollar TWI is projected to average at 75.5 in 2017/18, 72.6 in 2018/19, 72.3 in 2019/20 and 72.0 in 2020/21. That compares to March survey result of 75.2 in 2017/18, 73.1 in 2018/19, 73.1 in 2019/20 and 72.8 in 2020/21.
NZIER also noted that RBNZ's May MPS indicates that "interest rates were just as likely to go down as up." Nonetheless " the central bank's forecasts indicate the OCR is likely to increase, although not till later in 2019. Consensus Forecasts for interest rates have been revised slightly lower from 2019."
BCC: UK economy in a torpor amid Brexit uncertainties, rate hikes, trade war and oil prices
The British Chambers of Commerce slightly downgraded UK growth forecasts for 2018 to 1.3%, from 1.4%. For 2019, growth projection was downgraded to 1.4%, from 1.5%. And it said that, if realized, 2018 would be the weakest year since 2009. And it warned that the economy is in a " torpor, with uncertainties around Brexit, interest rate rises, and international developments such as a possible trade war and rising oil prices" all having an impact.
BCC said in a statement that "the downgrades have been largely driven by a more lacklustre outlook for consumer spending, business investment and trade". And, growth in real wages is not expected to "translate into materially stronger spending over the forecast horizon". And "weak productivity" would continue to limit wage growth. Household finances will remain "stretched amid historically low household savings and high debt levels."
Business investment growth is expected to slow sharply to 0.9% in 2018, down from 2.4% in 2019 on Brexit uncertainties. Next trade position is also expected to "weaken over the next few years". Services growth is projected to slow to 1.2% in 2018, weakest since 2010.