Sample Category Title
The Frontline Forex Candlesticks Training Course
Here's Exactly What You'll Gain From This Powerful Forex + Candlesticks Training Program Designed For You
The Frontline Forex Training Volumes (Volumes 1-3 of the Candlecharts.com Educational Series) Training Program is the equivalent of a multi-day seminar, taking you from the beginning to an expert level in using Nison Candlesticks with Forex... candlestick training the RIGHT way.

Here Is How This Training Will Help Accelerate Your Trading Skills and Knowledge Beyond What You've Ever Experienced
- Finding out which candlestick patterns give you the best probability of success
- When you should actually disregard the candlestick patterns
- If it's possible to trade successfully only with candlesticks – and no other indicators
- How to logically group patterns so you'll know how to use them better in the right context
- Why "blending" candlesticks can give you greater insight into what's really happening on the chart, and how to quickly blend them on your own
- Know how to identify pattern confirmations with greater accuracy for safer, more profitable trades
- The best time periods to choose for moving averages based on testing more than 1 million moving averages
- How to avoid taking profits too early and immediately increase your gains
- Know how to let your profits run, and know what it feels like to bag those big winners!
- Avoid the common scenario of exiting a trade, seeing the market correct a little, and then watch as it continues to go higher – don't miss out on those huge profit runs again!
- Quickly recognize the best high probability trades to dramatically improve your chances of consistent winners
- How to keep a simple trading Journal, and why it will help your confidence and profit levels
- What combination of signals need to be aligned before you pull the trigger
Fascinating New Insights To Expand Your Success
- Truly master candles by understanding the psychology hidden inside each pattern (Learn this and you'll be head and shoulders above your competition)
- Steer clear of the most common – and dangerous – misuses of candles. (Keep your money safe with these gems)
- Discover two ways to precisely confirm your candle patterns for higher success rates and a huge confidence surge, yet not one in a thousand traders knows how to do this!
- Momentum traders rejoice! I'll show you previously unknown methods to use candles to buy on strength and sell on weakness (Perfect for those who are uncomfortable picking tops and bottoms)
- The definitive guide to the exact Western indicators you really should be using with your candle analysis (Don't be distracted with all those indicators out there... this shortcut puts you right at the head of the class)
- PLUS... The only western technical indicator that you absolutely MUST use with candles
- Easily master one of the most difficult aspects of trading – Entry and Exit points – with these exciting new strategies
- Why I love the 'Box Range" – and why you will too when I show you this sneaky method to use it profitably
- Establish perfect "harmony" in your trades for greater success rates
- Discover three kinds of stops to protect your profits and preserve your trading capital
- Warning! Did you know that the exact same candle pattern can at times give a signal to enter a trade... and at other times a signal to exit a trade. I'll show you the simple rule that tells you when to use it for each situation.
- 6-Step Trading Checklist – to avoid "analysis by paralysis"
- White /Black Candle Progression™ – the new simple way to logically organize the double line candle patterns
- Steve Nison's proprietary 360° Candle Analysis™
- Strict vs. Basic pattern definitions to increase success
- Greater detail than ever before for psychology behind each pattern
- How – and why – setting up a trading journal can keep you on the path to profits... and how to do it the right way to put you at the head of the class fast!
Candlecharts Academy Free Training
No matter what you trade, now you can get the best candlestick training in one place...

Members of the Candlecharts Academy love getting access to all of our training with just one password.
Plus, students get special discounts on all of our training here inside the Academy. And you can see everything on whatever device you prefer – computer, tablet, or even your phone.
Not a member yet? It's fast and easy to claim your free training below right now.
Your free account gives you:
- Get Steve Nison's most important trading rule
- The 4 Common (and Costly!) Mistakes Almost Every Trader Makes
- Improve your analysis skills with our Chart Challenges
- Test your knowledge with interactive quizzes
- Receive informative market updates
- Private webcasts where we analyze US and FX markets of your choice
- Ongoing education added regularly
- Special student pricing on all products inside the Academy
- Value: $279 (get all of it free now)
Bets for Higher Precious Metal Prices Increased Despite Fed’s Rate Hike
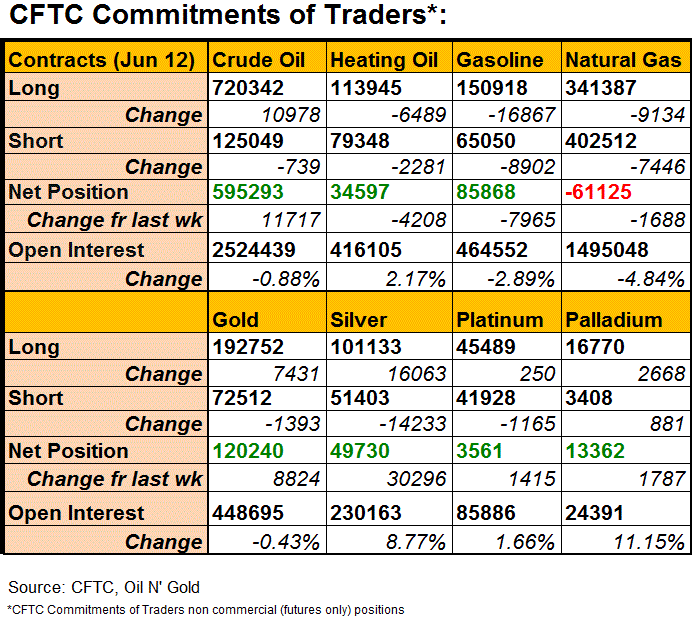
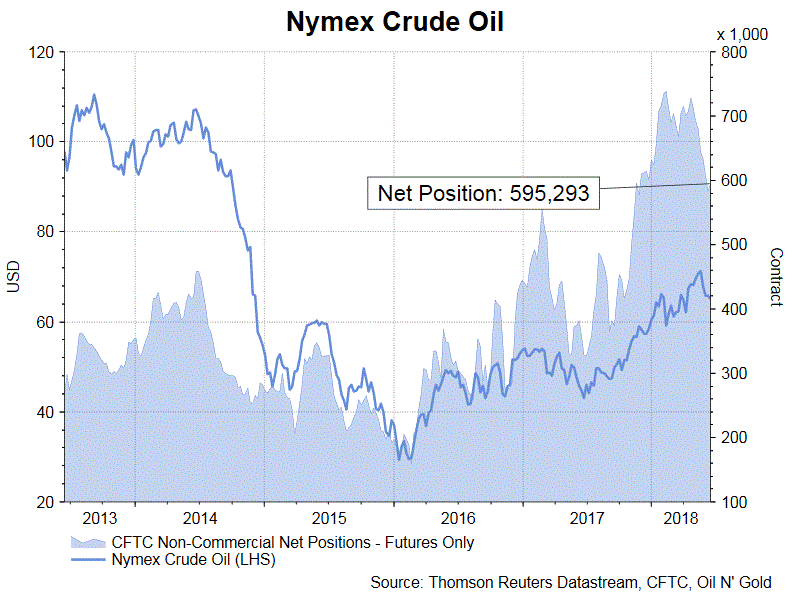
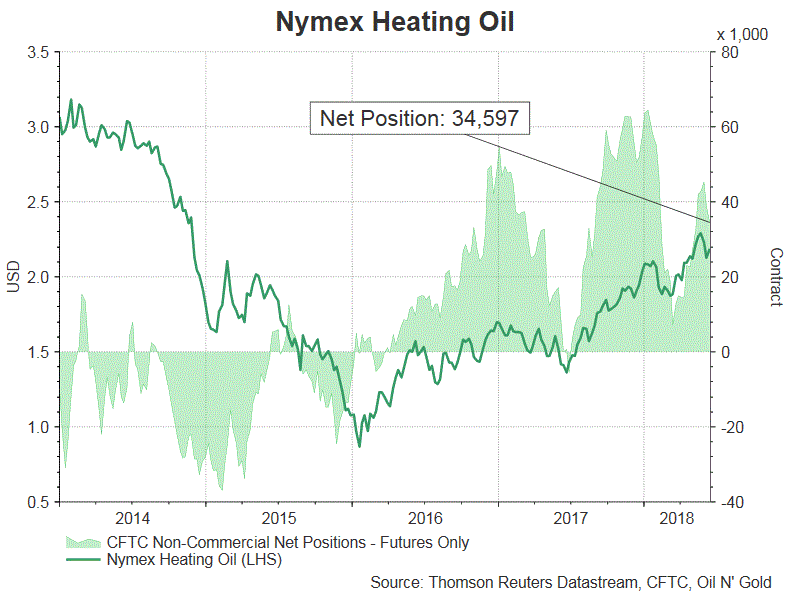
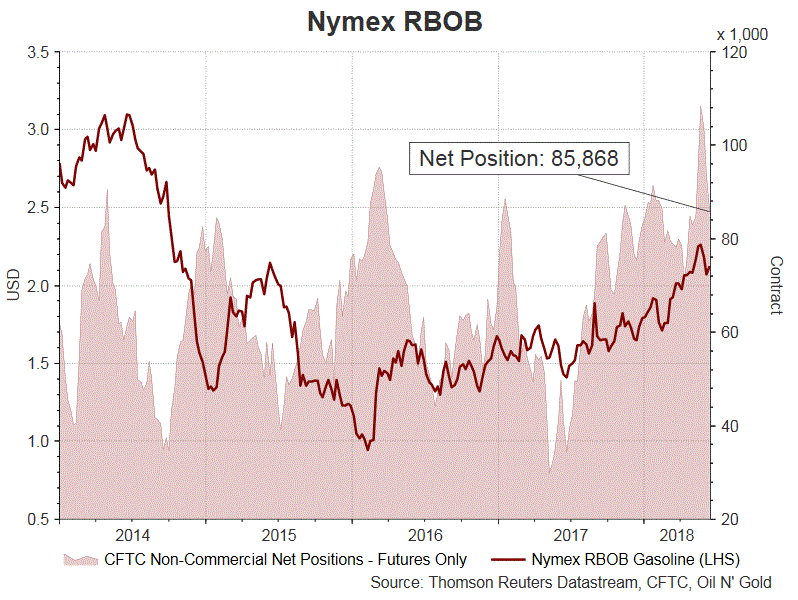
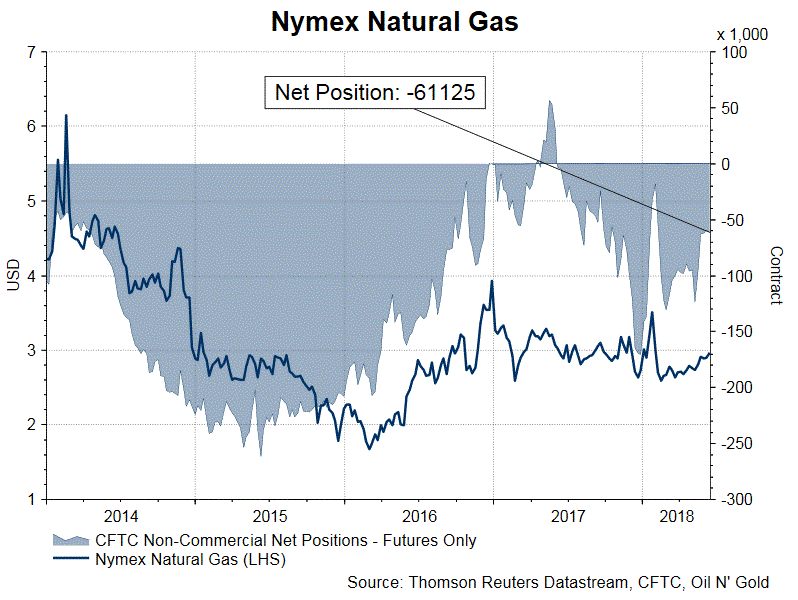
According to the CFTC Commitments of Traders report for the week ended Jun 12, net LENGTH for crude oil futures soared +11 717 contracts to 595 293. Net LENGTH for heating oil futures dropped -4 208 contracts to 34 597 while that for gasoline declined -7 965 contracts to 85 868. Net SHORT for natural gas increased -1 688 contracts to 61 125 for the week. During the reporting week, both crude oil benchmarks gained, with the front-month WTI and Brent contracts adding +12.85 and +0.66% respectively. On refined oil products, the Nymex heating oil contract gained +0.94% while the RBOB gasoline contract slipped -0.77%. The Nymex natural gas contract was +1.7% for the week. the focus of the week is the OPEC meeting, at which OPEC and some non-OPEC producers would discuss about lifting the output quota.
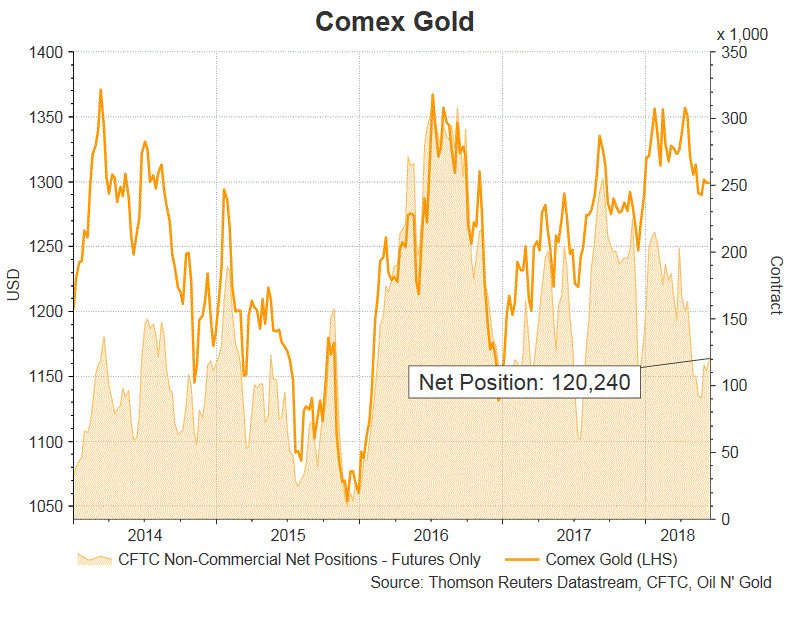
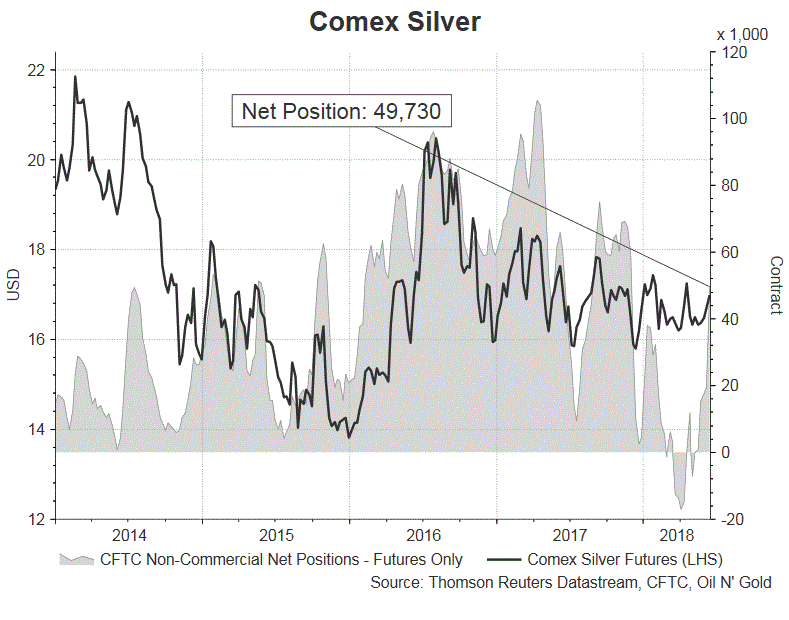
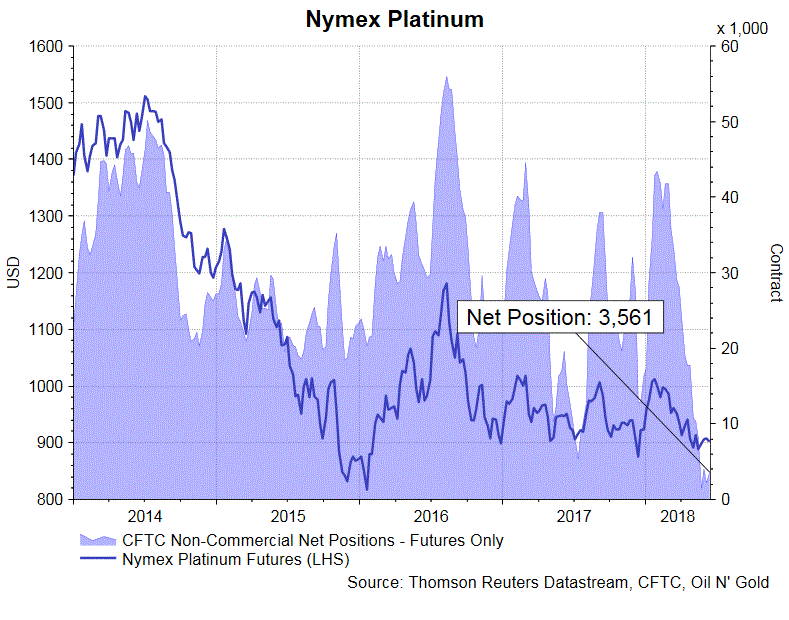
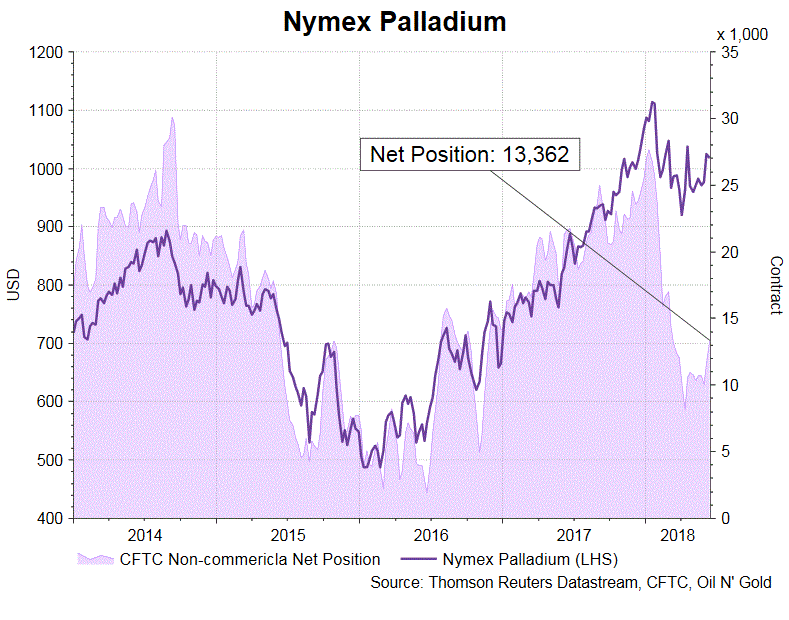
Traders were bullish about the precious metal complex during the week. Net LENGTH for the gold futures rose +8 824 contracts to 120 240 while that for silver rallied +30 296 contracts to 49 730 for the week. The Comex gold contract slipped -0.18% while the corresponding silver contract rallied -2.17% during the week. For PGMs, Net LENGTH for platinum gained +1 415 contracts to 3 561 while that for palladium rose +1 787 contracts to 13 362. The Nymex contract for platinum added +0.02% and that for palladium jumped +2.89% for the week.
EUR/USD Weekly Outlook
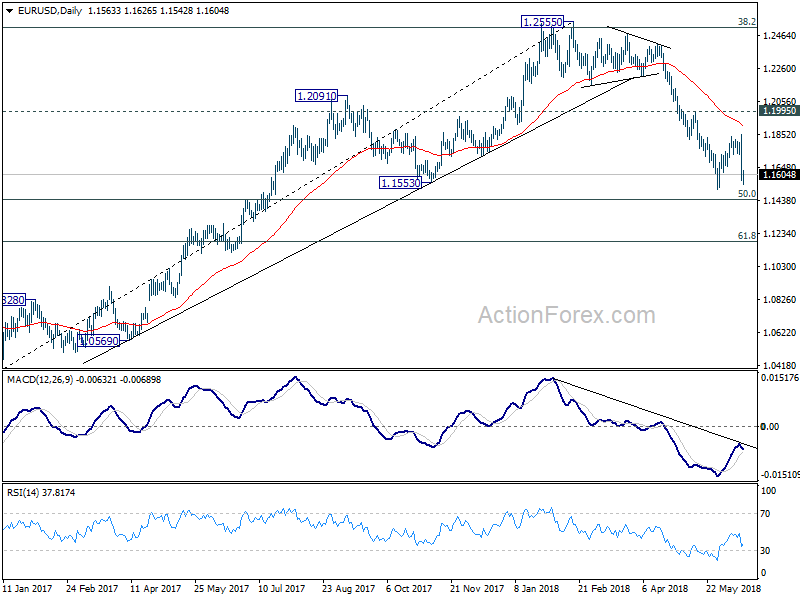
EUR/USD's sharp fall last week suggests that corrective rise from 1.1509 has completed at 1.1851 already. Initial bias stays on the downside for 1.1509 first. Break will resume the whole fall from 1.2555 through 50% retracement of 1.0339 to 1.2555 at 1.1447 to 61.8% retracement at 1.1186. On the upside, above 1.1659 minor resistance delay the bearish case and bring more consolidation first.
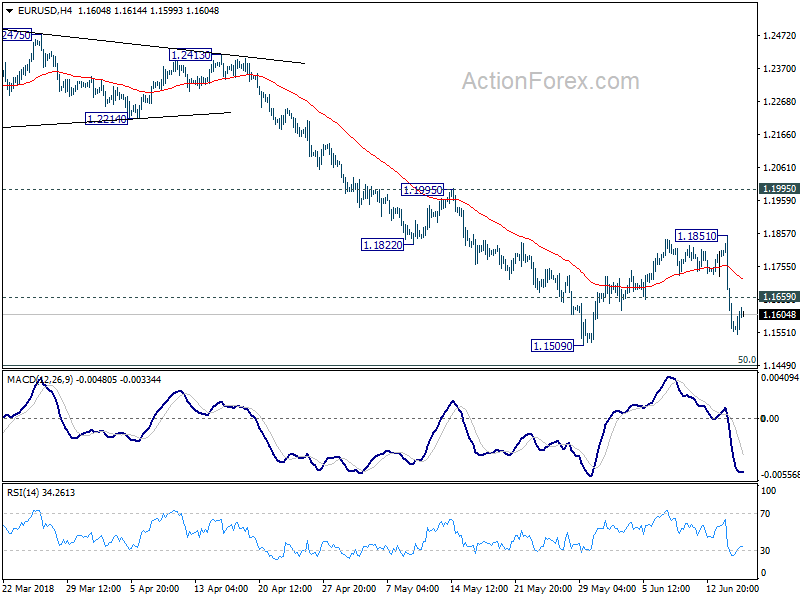
In the bigger picture, current development suggests that EUR/USD was rejected by 38.2% retracement of 1.6039 (2008 high) to 1.0339 (2017 low) at 1.2516. And, a medium term top was formed at 1.2555 already. Decline from there should extend further to 61.8% retracement of 1.0339 to 1.2555 at 1.1186 and below. For now, even in case of rebound, we won't consider the fall from 1.2555 as finished as long as 1.1995 resistance holds.
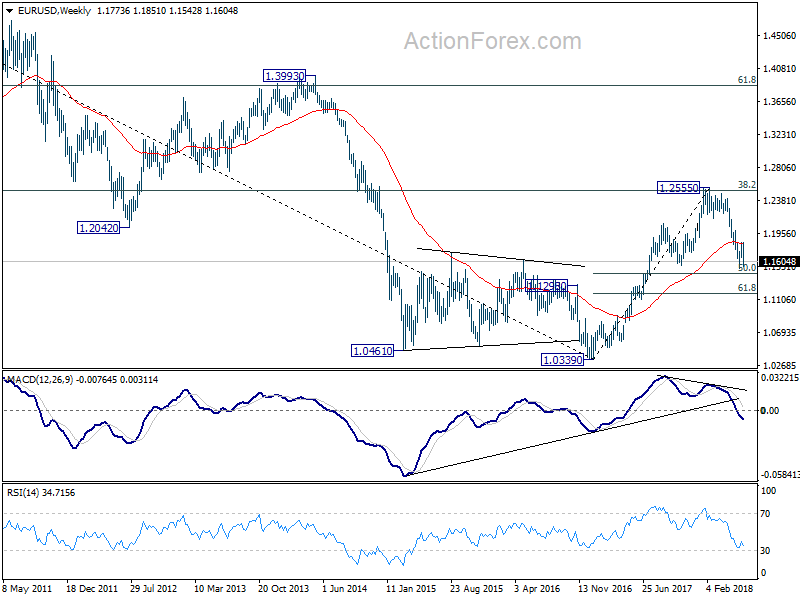
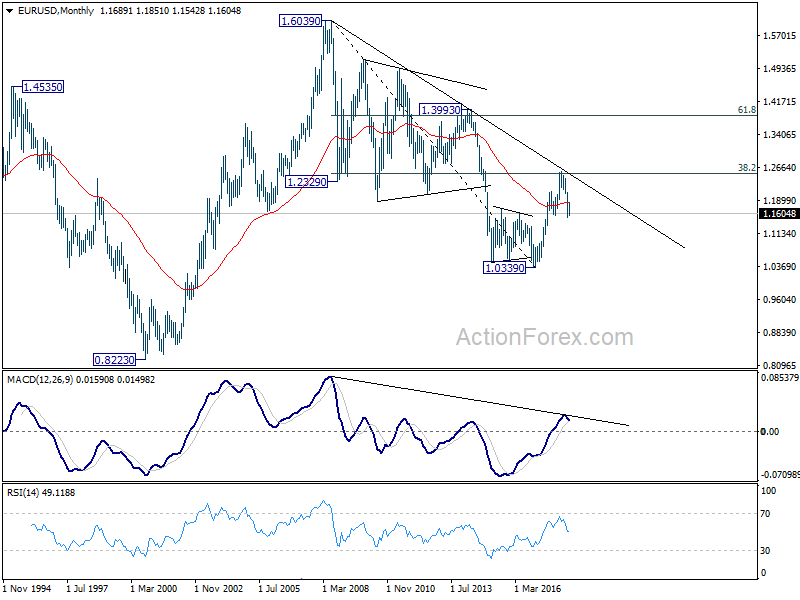
In the long term picture, the rejection from 38.2% retracement of 1.6039 to 1.0339 at 1.2516 argues that long term down trend from 1.6039 (2008 high) might not be over yet. EUR/USD is also held below decade long trend line resistance. Focus will now turn to 1.1553 support. Sustained break there would raise the chance of retesting 1.0339 low. It's early to tell, but the chance of long term bullish reversal is fading.
USD/JPY Weekly Outlook
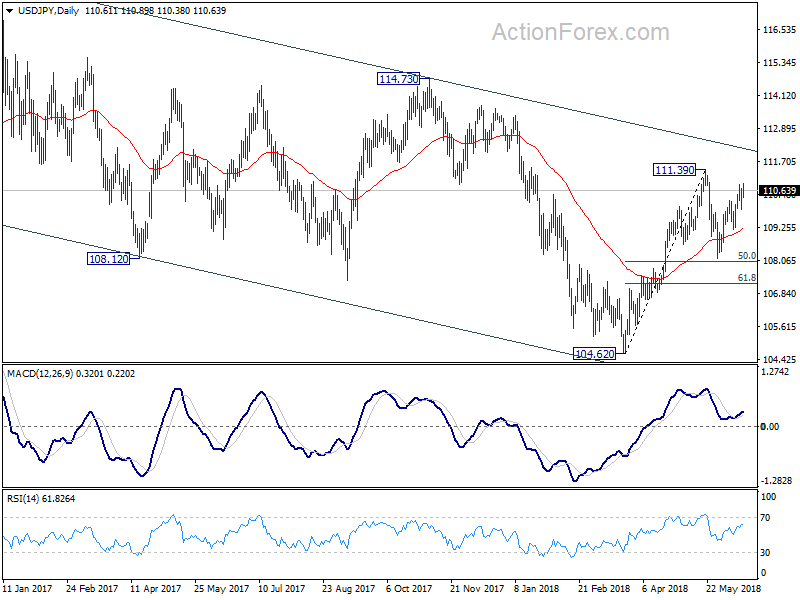
USD/JPY's rebound from 108.10 extended higher last week even though it lost some upside momentum. Initial bias stays mildly on the upside for 113.39 resistance. Break there will resume larger rebound from 104.62 and target 114.73 resistance. On the downside, though, break of 109.91 will turn bias to the downside and bring another fall towards 108.10 to extend the corrective pattern from 111.39.
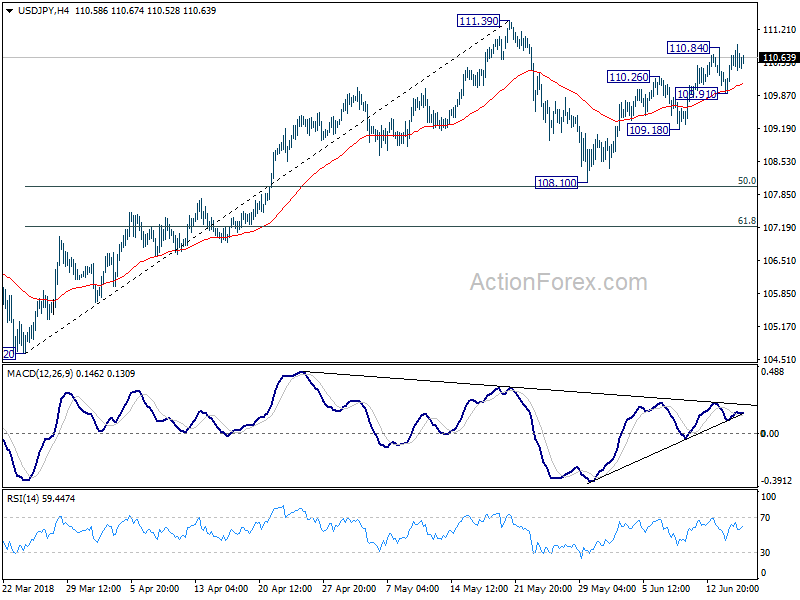
In the bigger picture, at this point, we're slightly favoring the case that corrective decline from 118.65 (2016 high) has completed with three waves down to 104.62. Above 111.39 will affirm this view and target 114.73 for confirmation. However, it should be noted that USD/JPY is bounded in medium term falling channel from 118.65 (2016 high). Sustained break of 61.8% retracement of 104.62 to 111.39 at 107.20 will likely resume the fall from 118.65 through 104.62 low.
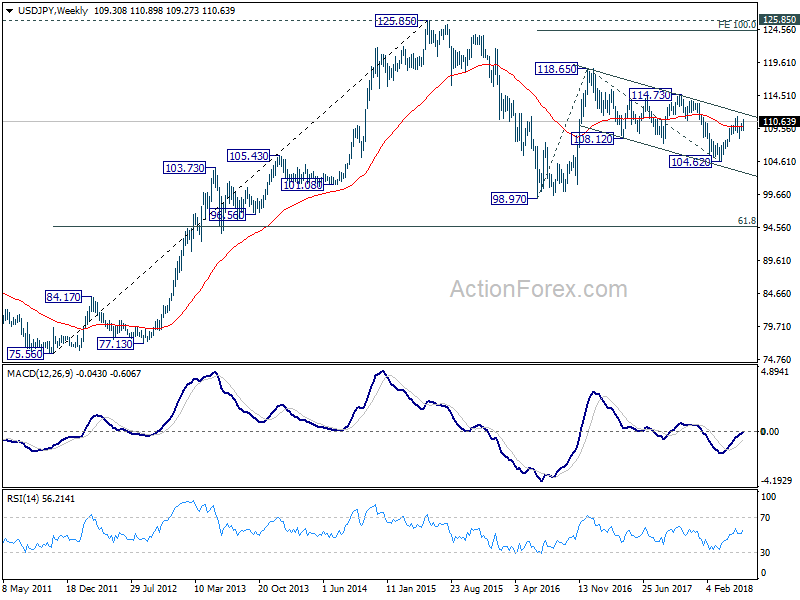
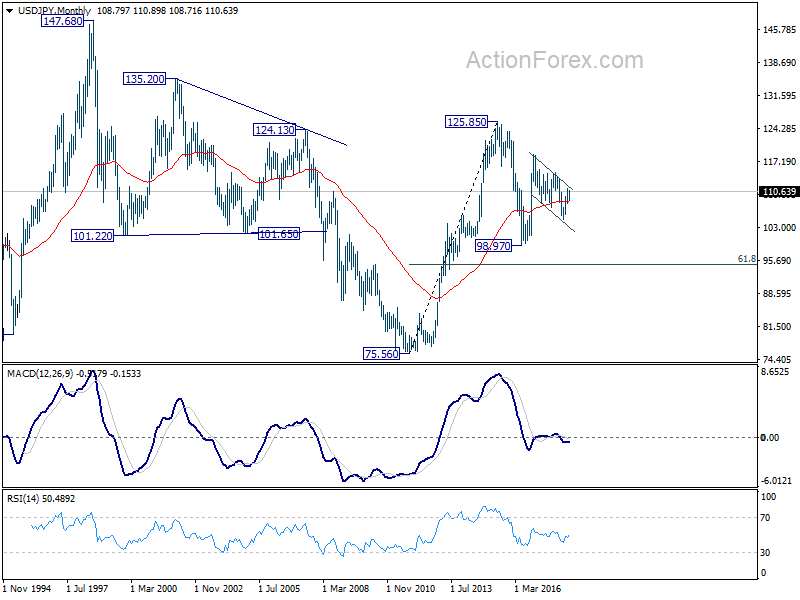
In the long term picture, the rise from 75.56 (2011 low) long term bottom to 125.85 top is viewed as an impulsive move, no change in this view. Price actions from 125.85 are seen as a corrective move which could still extend. In case of deeper fall, downside should be contained by 61.8% retracement of 75.56 to 125.85 at 94.77. Up trend from 75.56 is expected to resume at a later stage for above 135.20/147.68 resistance zone.
GBP/USD Weekly Outlook
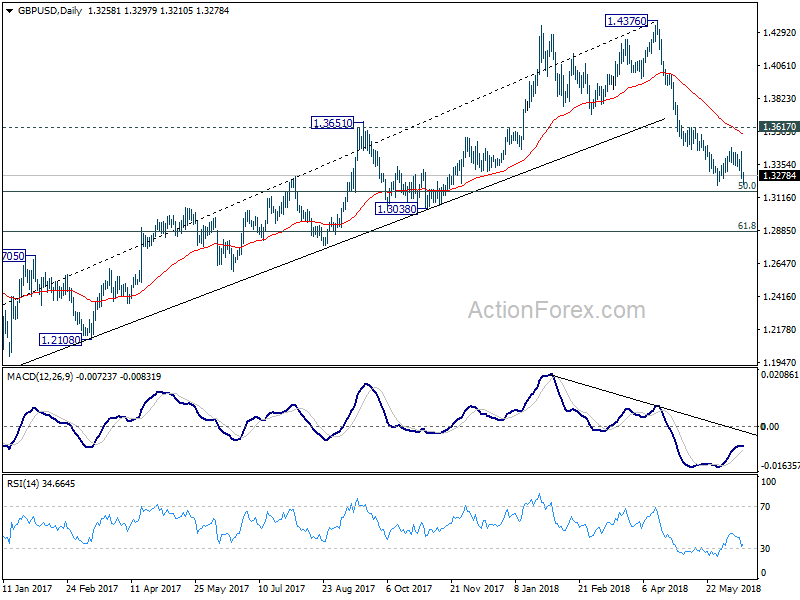
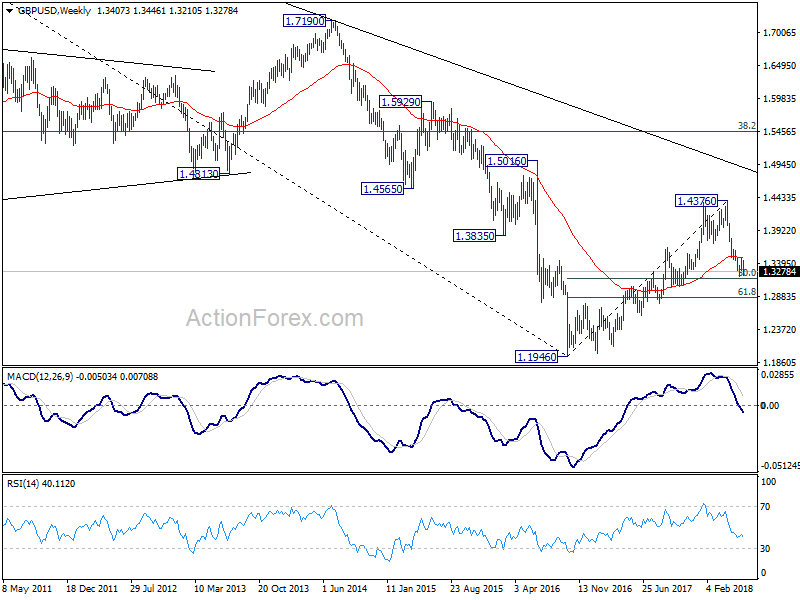
GBP/USD's steep decline last week suggests that correction from 1.3203 has completed at 1.3471 already. Initial bias remains on the downside this week for 1.3203 low first. Break will resume whole decline from 1.4376 and target 50% retracement of 1.1946 to 1.4376 at 1.3161 first, and 61.8% retracement at 1.2875 next. For now, outlook remains bearish as long as 1.3471 resistance holds, in case of recovery.
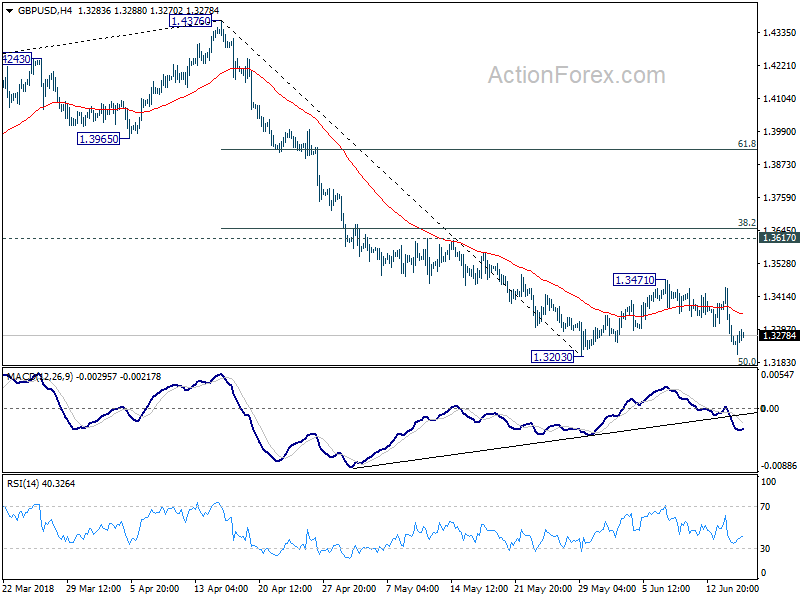
In the bigger picture, current development suggests that whole medium term rebound from 1.1936 (2016 low) has completed at 1.4376 already, with trend line broken firmly, on bearish divergence condition in daily MACD, after rejection from 55 month EMA (now at 1.4182). 61.8% retracement of 1.1936 (2016 low) to 1.4376 at 1.2874 is the next target. We'll pay attention to the reaction from there to asses the chance of long term down trend resumption. For now, outlook will stay bearish as long as 1.3617 resistance holds, even in case of strong rebound.
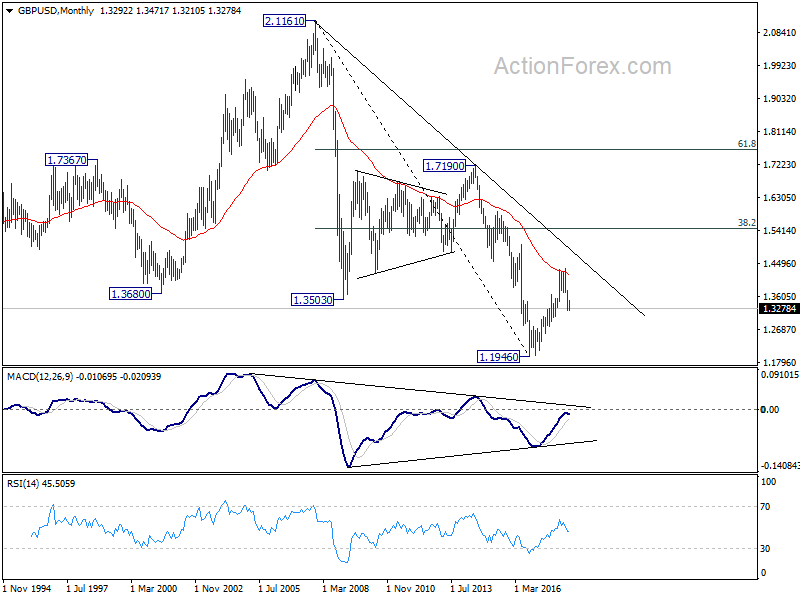
In the longer term picture, rise from 1.1946 (2016 low) is viewed as a corrective move, no change in this view. Rejection from 55 month EMA argues that it might be completed already. Larger down trend from 2.1161 (2007 high) could extend to a new low. This will now be the preferred case as long as 1.4376 resistance holds.
USD/CHF Weekly Outlook
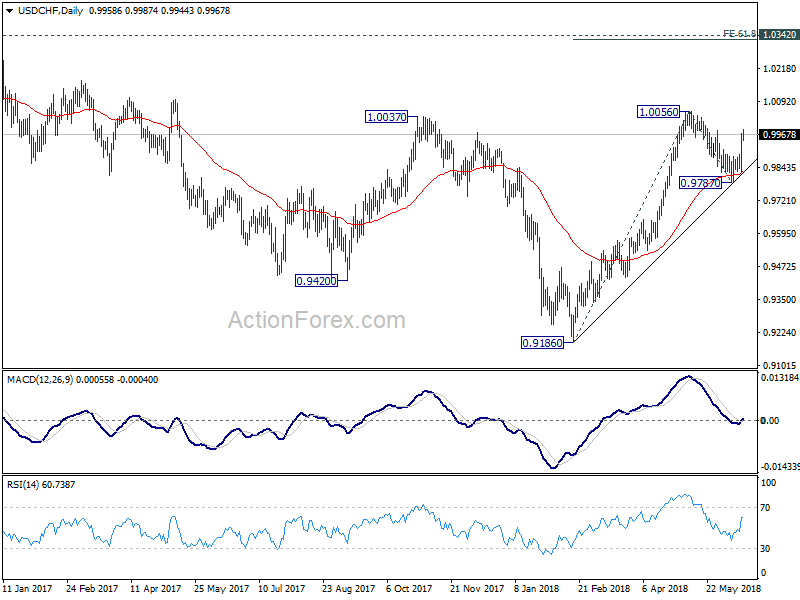
USD/CHF's strong rebound last week suggests that corrective pull back from 1.0056 has completed at 0.9787 already. Initial bias remains on the upside this week first retesting 1.0056 first. Break will resume the rise from 0.9186 and target 61.8% projection of 0.9186 to 1.0056 from 0.9787 at 1.0325, which is close to 1.0342 key resistance. On the downside, though, below 0.9894 minor support will turn bias neutral and could extend the correction from 1.0056 for a while.
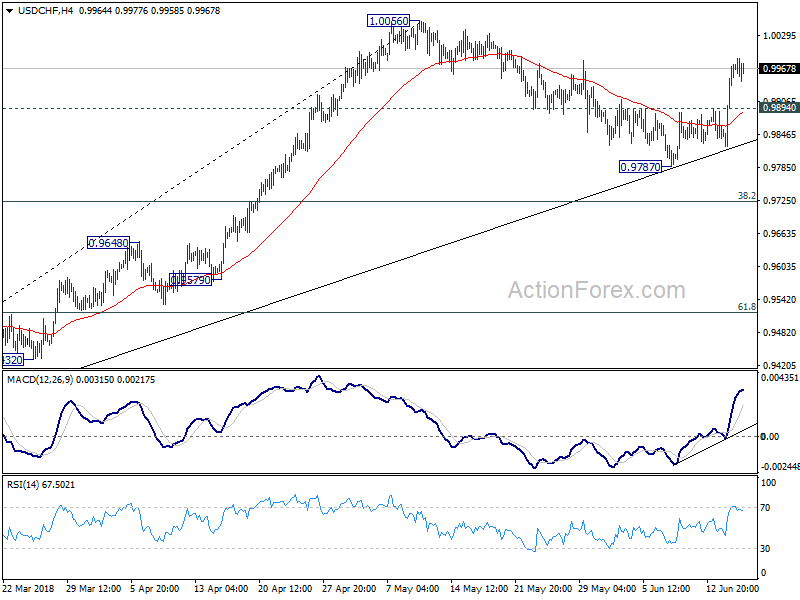
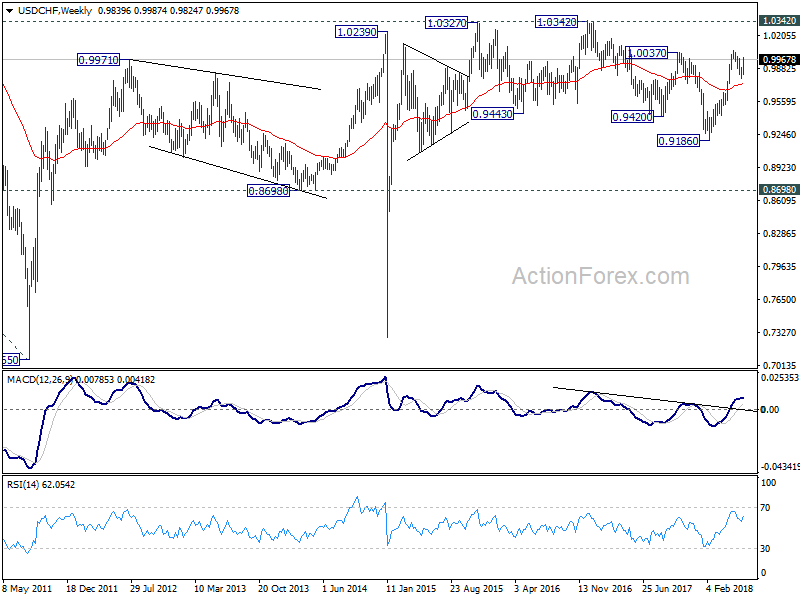
In the bigger picture, medium term decline from 1.0342 has completed with three waves down to 0.9186. Rise from there is currently viewed as a leg inside the long term range pattern. Hence, while further rally would be seen, we'd be cautious on strong resistance from 1.0342 to limit upside. For now, further rise is expected as long as 38.2% retracement of 0.9186 to 1.0056 at 0.9724 holds. However, sustained break of 0.9724 will dampen this bullish view and would at least bring deeper fall to 61.8% retracement at 0.9518.
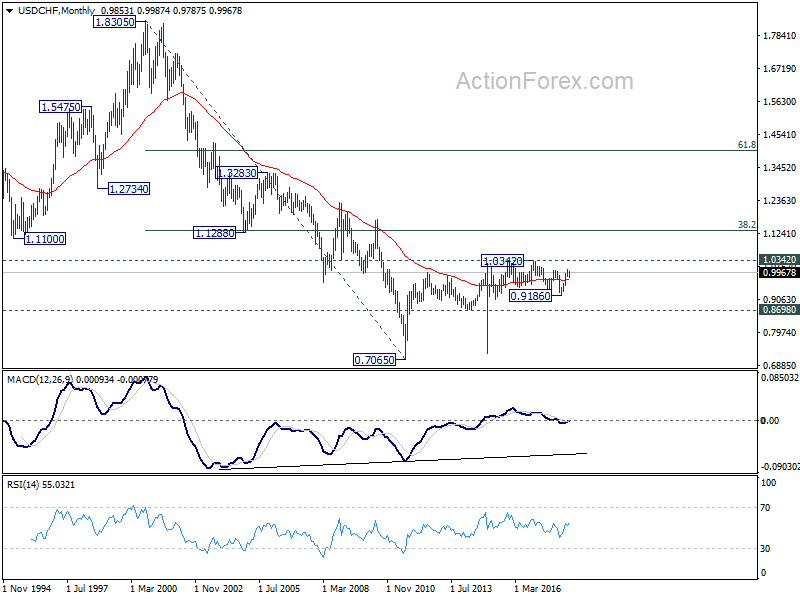
In the long term picture, price actions from 0.7065 (2011 low) are not clearly impulsive yet. Thus, we'll treat it as developing into a corrective pattern, at least, until a firm break of 1.0342 resistance.
AUD/USD Weekly Outlook
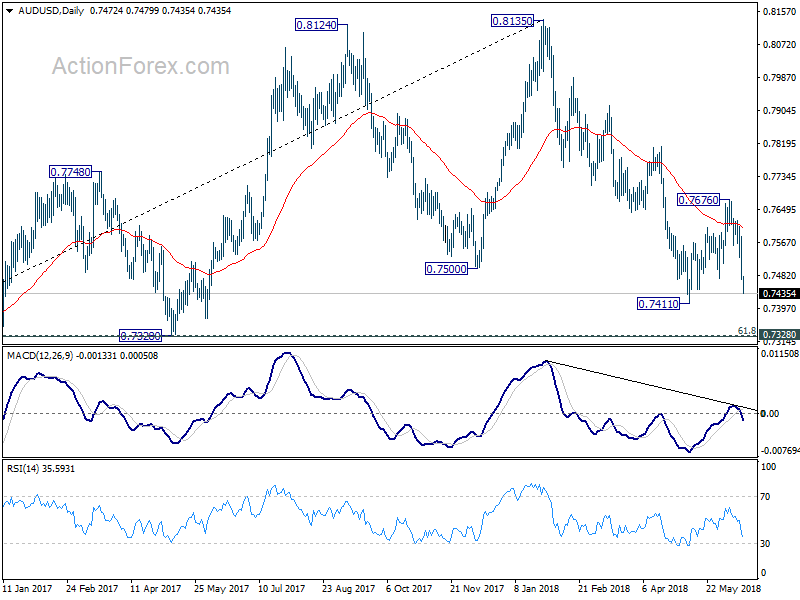
AUD/USD's decline last week confirmed that corrective rise from 0.7411 has completed at 0.7676 already. And, larger fall from 0.8135 is resuming. Initial bias stays on the downside this week for 0.7411 low first. Break will confirm this bearish case and target 0.7328 cluster support (61.8% retracement of 0.6826 to 0.8135 at 0.7326). On the upside, break of 0.7528 minor resistance is needed to indicate completion of the fall from 0.7676. Otherwise, outlook will remain cautiously bearish in case of recovery.
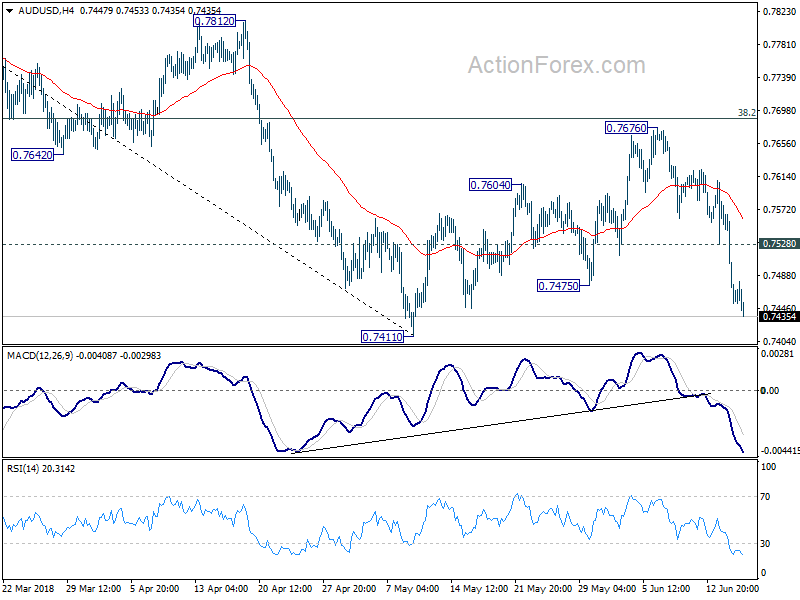
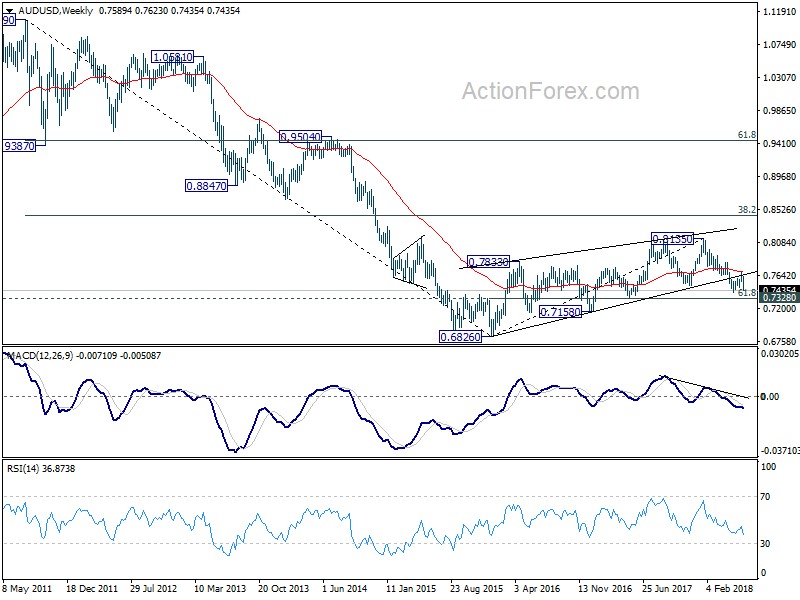
In the bigger picture, medium term rebound from 0.6826 is seen as a corrective move. Prior break of 0.7500 key support suggests that such correction is completed at 0.8135. Deeper decline would be seen back to retest 0.6826 low. In case of another rise, we'd expect strong resistance from 38.2% retracement of 1.1079 to 0.6826 at 0.8451 to limit upside to bring long term down trend resumption eventually.
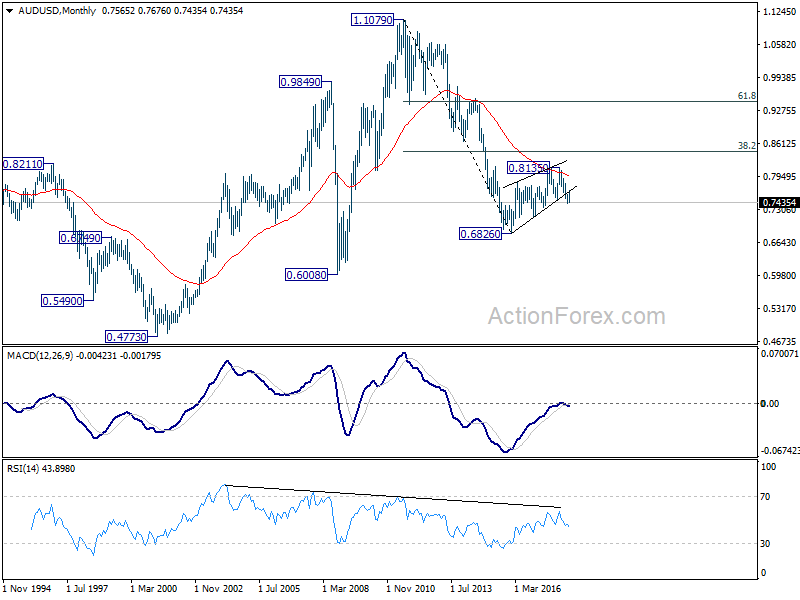
In the longer term picture, 0.6826 is seen as a long term bottom. Rise from there could either reverse the down trend from 1.1079, or just develop into a corrective pattern. At this point, we're favoring the latter. And, as long as 38.2% retracement of 1.1079 to 0.6826 at 0.8451 holds, we'd anticipate another decline through 0.6826 at a later stage. But strong support should be seen between 0.4773 (2001 low) and 0.6008 (2008 low).
USD/CAD Weekly Outlook
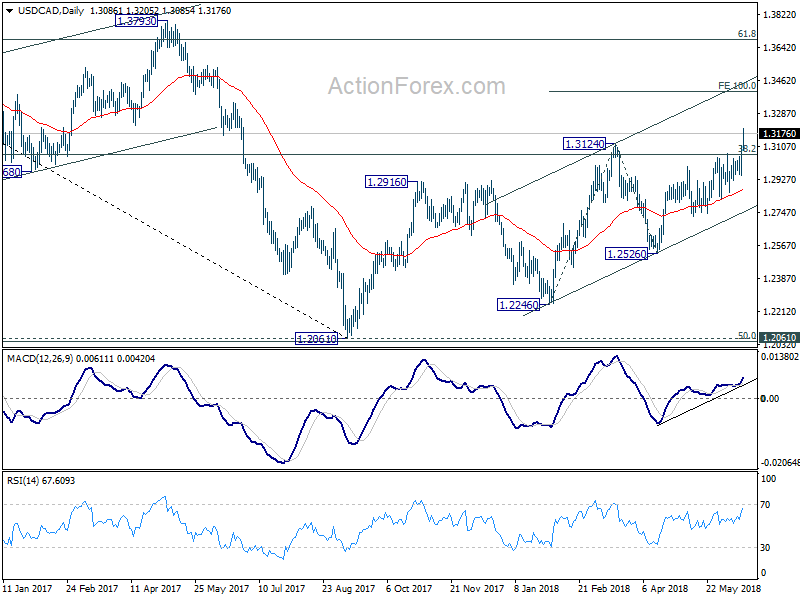
USD/CAD surged to as high as 1.3205 last week and the break of 1.3124 resistance confirmed resumption of medium term rebound from 1.2061. Initial bias remains on the upside this week for 100% projection of 1.2246 to 1.3124 from 1.2526 at 1.3404 next. On the downside, below 1.3120 minor support will turn intraday bias neutral and bring consolidation first, before staying another rally.
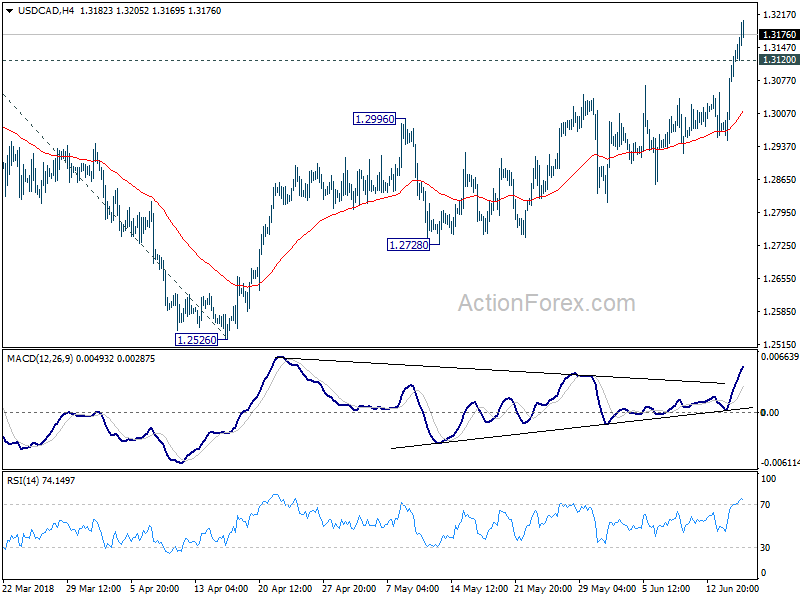
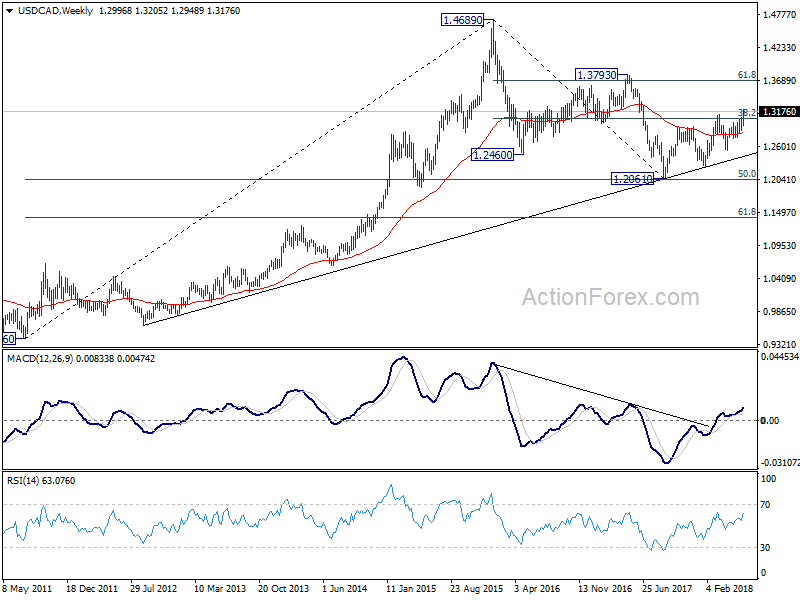
In the bigger picture, current development solidify the view of bullish trend reversal. That is fall from 1.4689 (2015 high) has completed at 1.2061, ahead of 50% retracement of 0.9406 (2011 low) to 1.4689 (2015 high) at 1.2048. Further rally should be seen for 61.8% retracement of 1.4689 to 1.2061 at 1.3685 and above. This will now be the preferred case as long as 1.2526 support holds, even in case of deep pull back.
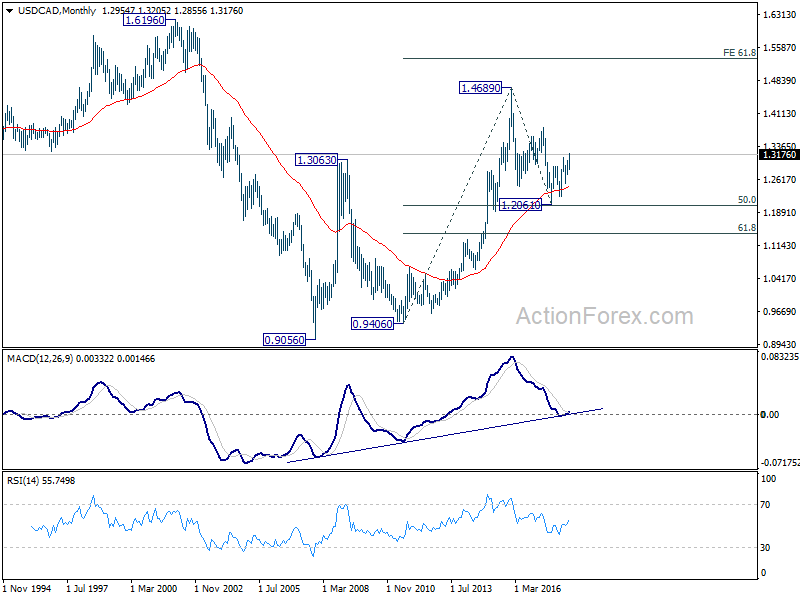
In the longer term picture, corrective fall from 1.4689 (2015 high) should have completed with three waves down to 1.2061, just ahead of 50% retracement of 0.9406 (2011 low) to 1.4689 (2015 high). The development keeps long term up trend from 0.9406) and that from 0.9056 (2007 low) intact. It's early to tell, but there is now prospect of extending the long term up trend to 61.8% projection of 0.9406 to 1.4689 from 1.2061 at 1.5326 in medium to long term.
GBP/JPY Weekly Outlook
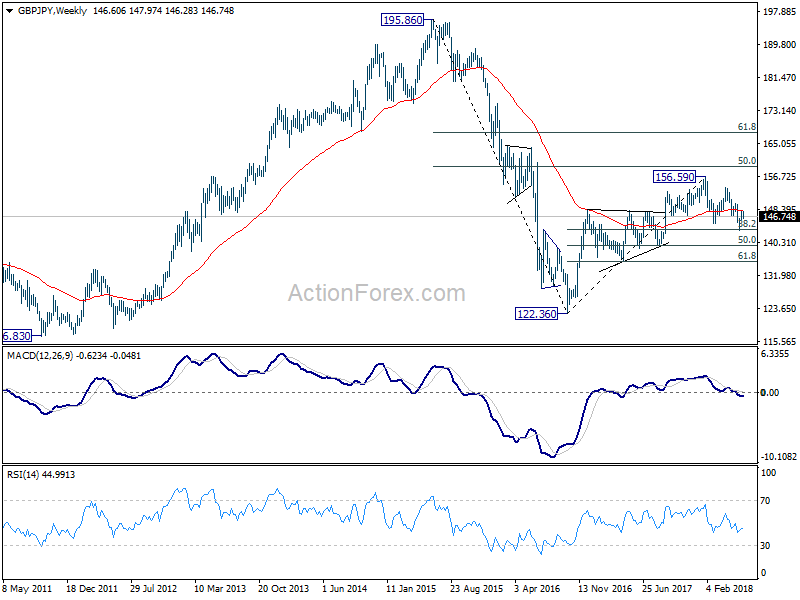
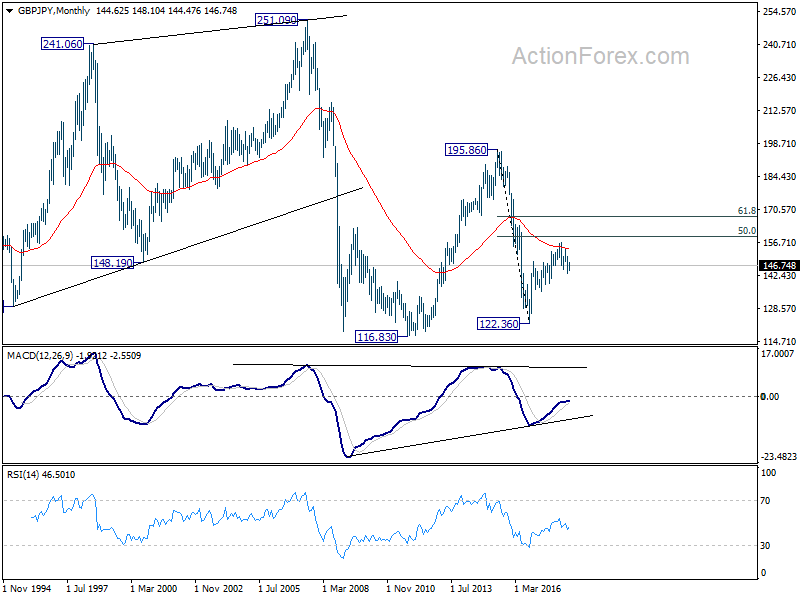
GBP/JPY stayed in range trading below 148.10 last week and outlook is unchanged. Initial bias remains neutral first. On the upside, above 148.10 will resume the rebound from 143.18 and target 149.99, and then 153.84 resistance. However, break of 145.82 minor support will argue that the rebound from 143.18 is completed and bring retest of this low.
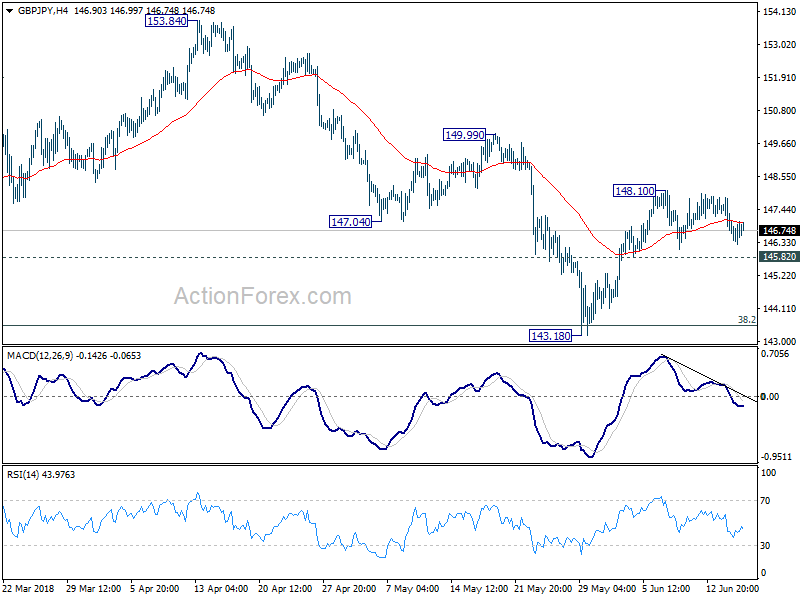
In the bigger picture, no change in the view that decline from 156.59 is a corrective move. In case of another fall, strong support should be seen above 139.29 cluster support (50% retracement of 122.36 to 156.59 at 139.47) to contain downside and bring rebound. Meanwhile, break of 153.84 should confirm that the correction is completed and target 156.59 and above to resume the medium term up trend.
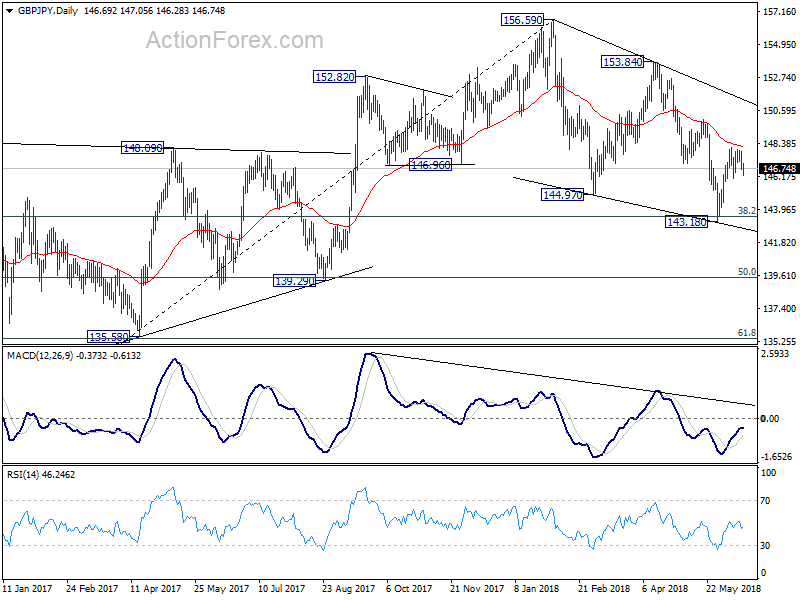
In the longer term picture, the failure to sustain above 55 month EMA (now at 153.83) is mixing up the outlook. Nonetheless, as long as 139.29 holds, rise from 122.26 is in favor to extend to 50% retracement of 195.86 (2015high) to 122.36 (2016 low) at 159.11, and possibly further to 61.8% retracement at 167.78 before completion. However, firm break of 139.29 will turn focus back to 116.83/122.36 support zone instead.