Sample Category Title
Dollar Higher After Fed Hike and Dovish ECB
The US dollar gained against all major pairs this week. A hawkish Fed and a dovish European Central Bank (ECB) gave the edge to the American currency. Donald Trump scored diplomacy points in Singapore by meeting with North Korean leader Kim. Trade war fears were once again at the forefront as the Trump administration announced new tariffs on Chinese goods on Friday. Oil prices plunged as supply might be on the rise with heavy anticipation on the Organization of the Petroleum Exporting Countries (OPEC) meeting on Friday.
- Major Central Bank Governors to meet in Portugal
- Bank of England (BoE) expected to keep rates on hold
- OPEC states its Summit on June 22
Central Bank Divergence Gives USD Edge Over EUR
The EUR/USD lost 1.37 percent in the last five days. The single currency is trading at 1.1606 after the Fed and the ECB both announced tightening monetary policies. The US central bank hiked its benchmark rate as expected by 25 basis points. The dollar support from the Fed did not stop there with more optimistic projections and Fed Chair Powell sharing his confidence in the US economy. The report that the White House was readying the list of tariffs on Chinese goods capped the rise of the USD on Wednesday.
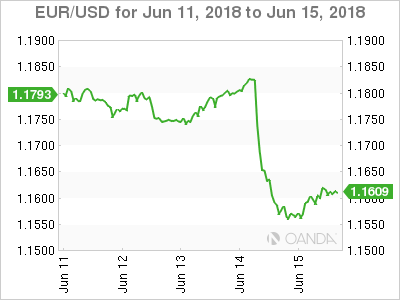
The ECB also made a monumental announcement this week to end its QE program but it was also accompanied by a dovish assessment of the economy by saying that rates will be on hold at least a year. The move is in line with the reality of the European economy, as much as the Fed hike is an endorsement of the pace of the growth of America. Next week will offer more chances for central bankers to spout their diverging views when they meet in Portugal for the ECB Forum on Central Banking.
The tariffs against Chinese goods weighted on the USD on Friday ahead of an economic calendar that will be heavy with central bank rhetoric. US data will be largely absent with building permits and the Philly Fed manufacturing index the stand out indicator releases. The European data calendar looks thin until the end of the week with flash PMI data to give a more forward looking insight into the European economy.
Canadian Dollar Lower After Fed and Trade War Concerns
The USD/CAD surged 2.01 percent during the week. The currency pair is trading at 1.3185 after the double whammy of a Fed hike and US trade tariffs. Although the higher duties are not applied to Canada directly the fate of NAFTA remains cloudy. Canadian officials did their best to remind everyone that the deal is still on the table and nudged US negotiators to get back on the table. The biggest hurdle going forward would be the political interference as the preferred window of negotiations is now closed. Mexican presidential elections will take place on July 1, which could mean a new team on the Mexican side.
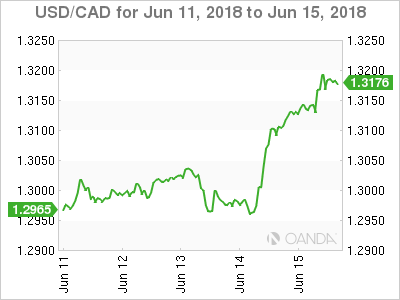
The Canadian dollar is near a one year low against the USD. Fundamental indicators have softened north of the American border with manufacturing sales falling 1.3 percent on Friday. Oil prices offered little positive support as the upcoming OPEC meeting on Friday will shape the face of global crude supply. Analysts are expecting higher production which are not being priced with a tumble in crude.
OPEC Meeting to Keep Oil Prices Under Pressure
Oil fell in the last week. The price of West Texas Intermediate is trading at $64.90 far from the weekly highs at around the $67 level. The Organization of the Petroleum Exporting Countries (OPEC) will meet in Vienna on June 22 and ahead of that meeting there are rumours circling about that Russia and Saudi Arabia point to a softening of the production limits. The deal did in fact stabilize prices that were in free fall, but producers are divided on the need to relax the supply limits.
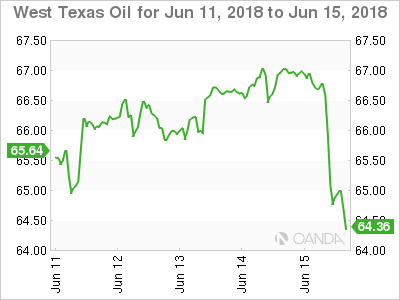
The OPEC is divided internally as Iran and Venezuela have had disruptions to their supply and would prefer the group maintains lower levels across the board. Saudi Arabia could find common ground and compromise in a smaller increase.
Market events to watch this week:
Monday, June 18
- 1:30pm EUR ECB President Draghi Speaks
- 9:30pm AUD Monetary Policy Meeting Minutes
Tuesday, June 19
- 4:00am EUR ECB President Draghi Speaks
- 8:30am USD Building Permits
Wednesday, June 20
- 9:30am AUD RBA Gov Lowe Speaks
- 9:30am EUR ECB President Draghi Speaks
- 9:30am JPY BOJ Gov Kuroda Speaks
- 9:30am USD Fed Chair Powell Speaks
- 10:30am USD Crude Oil Inventories
- 6:45pm NZD GDP q/q
Thursday, June 21
- 3:30am CHF Libor Rate
- 3:30am CHF SNB Monetary Policy Assessment
- 4:30am CHF SNB Press Conference
- 7:00am GBP MPC Official Bank Rate Votes
- 7:00am GBP Monetary Policy Summary
- 7:00am GBP Official Bank Rate
- 4:15pm GBP BOE Gov Carney Speaks
Friday, June 22
- All Day All OPEC Meetings
- 8:30am CAD CPI m/m
- 8:30am CAD Core Retail Sales m/m
*All times EDT
Week Ahead – Central Bank Theme Continues with BoE, SNB; OPEC to Discuss Output Increase
The central bank theme will continue into the coming week as it’s the turn of the Bank of England and the Swiss National Bank to set monetary policy. Oil and energy stocks will also come into focus as OPEC and Russia meet to discuss whether to relax the oil output cap. It will be a quieter week for economic data, however, with Japanese inflation, flash Eurozone PMIs and New Zealand GDP likely to be the main headline grabbers.
Loonie to seek relief from Canadian CPI and retail sales data
The Canadian dollar slid to 11-month lows this week amid heightened trade tensions and a public row between US President Trump and the Canadian Prime Minister, Justin Trudeau, at the G7 meeting. Mixed data have also not done the loonie any favours but inflation and retail sales numbers out of Canada next week may provide the currency with a bit of boost if they help expectations of a rate hike by the Bank of Canada at the next meeting on July 11. Both the CPI (May) and retail sales (April) figures are due on Friday.
New Zealand GDP in focus
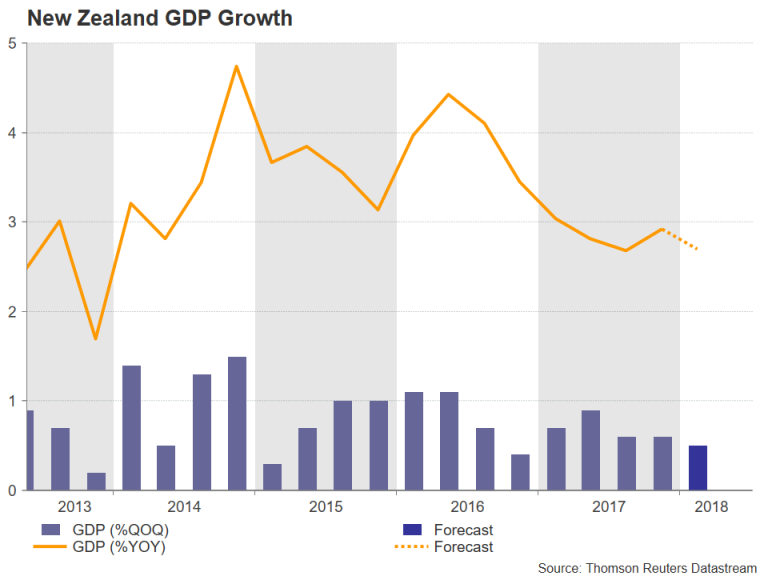
GDP figures out of New Zealand on Wednesday will be monitored for clues as to whether the Reserve Bank of New Zealand’s next rate move will be up or down. New Zealand’s economy is forecast to have expanded by 0.5% during the quarter ending March, with the annual rate slowing slightly from 2.9% to 2.7%. While the data is unlikely to significantly alter the consensus view that the RBNZ will stay on hold for the foreseeable future, a disappointing reading would add fuel to speculation that the central bank’s next move may yet be another cut rather than an increase. The New Zealand dollar turned lower at the end of this week after failing to break resistance around the $0.7050 level and is therefore vulnerable to more sell-off if the growth figures disappoint. Also to watch from New Zealand are first quarter current account figures on Tuesday.
Meanwhile, the Reserve Bank of Australia will be publishing its minutes of the June policy meeting on Tuesday. The aussie could find support from the minutes if the RBA reaffirms its cautiously upbeat outlook on the Australian economy.
Strong Japanese exports could ease recession fears
Japanese trade figures on Monday could help ease concerns that the world’s third largest economy could be headed for a technical recession in the second quarter. Exports are forecast to maintain April’s strong momentum, rising by 7.5% year-on-year in May. Friday’s manufacturing PMI from Nikkei/Markit could also help sentiment if the index increases in June’s flash reading. Also due on Friday are the latest inflation numbers. The data is expected to show Japan’s core CPI (which excludes fresh foods) holding steady at 0.7% y/y in May, remaining below the February peak of 1%. The yen could come under pressure if core CPI unexpectedly declines further in May.
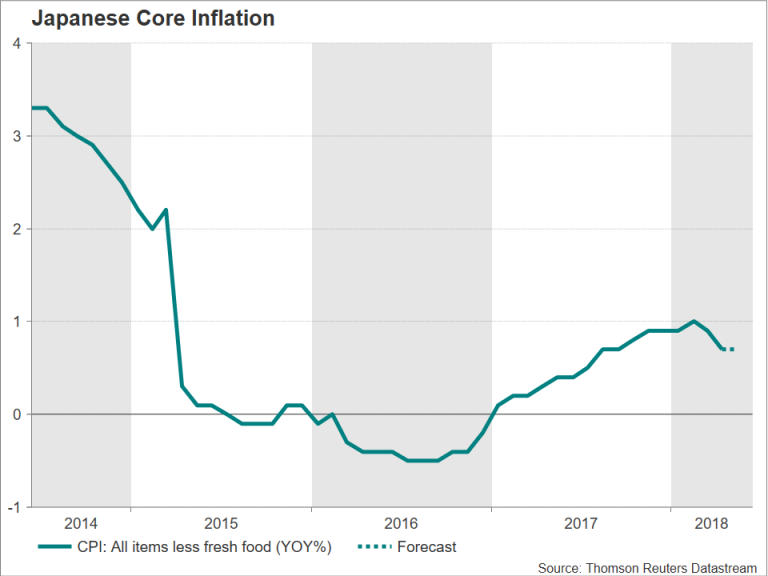
The Bank of Japan this week reiterated its commitment to maintain “powerful monetary easing” while acknowledging that inflation had slowed in recent months. Investors will get the chance to hear more from the BoJ when it publishes its minutes of the April policy meeting on Wednesday.
Eurozone flash PMIs eyed after ECB surprise
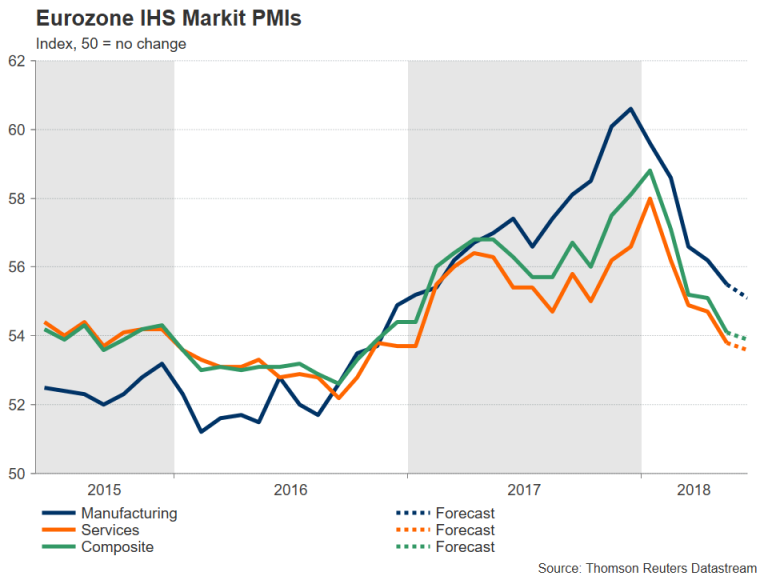
With the euro responding with a down move rather than an upwards surge after the European Central Bank went beyond what many market participants had been expecting this week and announced an end date to its bond purchase program, the single currency is unlikely to do any better next week from Eurozone data. The flash reading of the IHS Markit PMIs for June will be watched on Friday for any hint of an end to the slowdown in euro area growth. Analysts are not predicting a turnaround just yet though as the composite PMI is forecast to slip to 53.9 in May from the prior 54.1. Its constituents, the manufacturing and services PMIs are also expected to decline marginally.
The euro could come under particular pressure against the Norwegian crown as Norway’s central bank is expected to signal a September rate hike at its policy meeting next week. The Norges Bank has previously indicated that it would begin raising its key policy rate after summer 2018. It will likely reiterate this view when it meets on Thursday.
Another central bank convening next week is the Swiss National Bank. The SNB may feel more confident about proceeding with its own policy normalization after the ECB’s move this week. However, given the unexpected recent weakness of the euro, it will likely hold its 3-month LIBOR target range between -0.25% and -1.25% on Thursday and maintain for now that the Swiss franc remains “highly valued”.
Bank of England to hold rates on weak economy
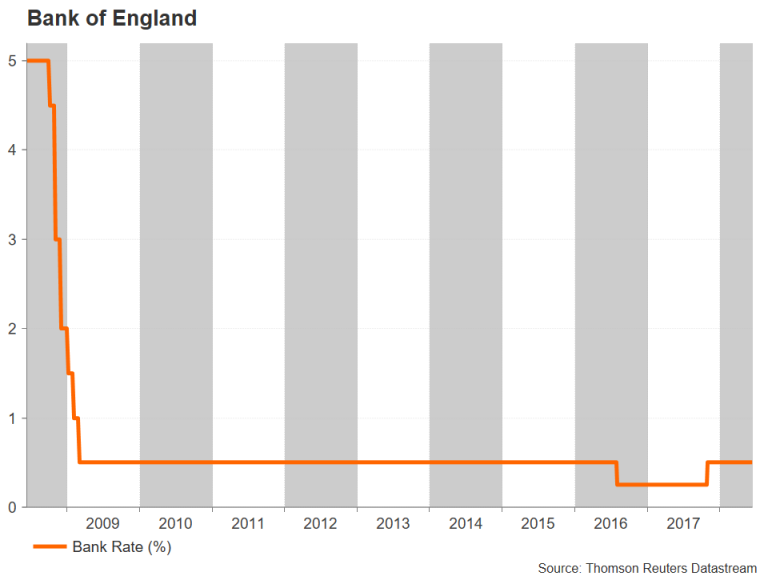
The Bank of England will hold a policy meeting on Thursday and is expected to keep interest rates unchanged at 0.5%. There is no press conference or updated forecasts at the June meeting but traders will be watching for any changes to the Monetary Policy Committee (MPC) members’ language in the statement for clues as to whether a rate hike is on the cards in August. Given the embarrassing U-turn the Bank was forced to make at the May meeting when a series of soft UK indicators forced the MPC to backtrack on earlier hawkish remarks and cancel a planned rate hike, the BoE will probably strike a more cautious tone this month while keeping its options open.
There are no major UK data releases in the next seven days but if the BoE meeting turns out to be a non-event, sterling could still attract attention from political developments. The EU Withdrawal bill, which this week the government managed to successfully defeat all proposed amendments, will return to the House of Lords on Monday. If the Lords decide not to make too many changes the second time, the bill could be voted on again in the House of Commons as early as next week. However, Prime Minister Theresa May risks losing the vote this time round if she fails to reach a compromise with soft and hard Brexiteers on the issue of giving MPs a ‘meaningful vote’ on any final Brexit deal with the EU.
After Fed, a light calendar for the US
After the all-important FOMC meeting this week, the US economic calendar will be a lot lighter, with housing market indicators being the dominant releases next week. Building permits are due first on Tuesday along with housing starts. Existing home sales will follow on Wednesday. All three data sets are for May. Business surveys will make up the remainer of the week, with the Philly Fed manufacturing index for June due on Thursday and the IHS Markit flash PMIs coming up on Friday.
The absence of big data may not necessarily mean a quieter time for the US dollar however, as an escalation of trade tensions could spark another bout of market volatility and weigh on the dollar/yen pair.
OPEC meeting to fuel oil’s next leg down?
WTI oil is in the green on a weekly basis after retreating in the previous three weeks, losing ground after climbing above $70 per barrel in late May to touch its highest since late 2014. However, next week’s meeting in Vienna on June 22-23 by OPEC members and other big producers such as such as Russia may turn out to be the catalyst for a fresh leg lower. This would especially hold true if major exporting powers Saudi Arabia and Russia push forward for a substantial increase in oil supply. With a production increase mostly priced in, market response will depend on the actual size of any deal.
Australia & New Zealand Weekly: Some Observations from Europe
Week beginning 18 June 2018
- Some observations from Europe.
- RBA: Governor Lowe on panel in Europe with Fed's Powell, ECB's Draghi and BOJ's Kuroda.
- Australia: Westpac-MI Leading Index.
- NZ: GDP, Westpac-MM Consumer Confidence, current account.
- Europe: ECB Forum on Central Banking.
- US: housing starts & building permits.
- Central banks: BOE, BoT, CBC, BSP.
- Flash PMI's for US, Europe and Japan.
- Key economic & financial forecasts.
Information contained in this report current as at 15 June 2018.
Some Observations from Europe
Over the last two weeks I have visited policy makers; central banks; real money managers; hedge funds and corporates in Europe and London.
Of course there have been a range of views but in this note I will try to draw out some of the more interesting and prevalent observations that I think are relevant. I will cover the global view; sentiment around Australia and issues for Europe.
The Global View
I was eager to test reactions to our global view which is essentially that the FED will tighten three more times (following the recent June hike) by mid-2019. The US 10 year rate is likely to rise to 3.5% by that time. As the fiscal stimulus fades in the second half of 2019; and the US economy slows under a tightening in financial conditions (higher USD; widening credit spreads; falling equity prices) and a resulting slowdown in spending, the FED will go on hold and US bond rates will gradually ease through the remainder of 2019 and 2020. However we do not expect an inverse US yield curve and a resulting US recession. Nine of the last ten inverse yield curves have correctly signalled a US recession.
While there was some sympathy with this view a common theme amongst investors was that US bond rates were unlikely to rise much above current levels. Sentiment that the FED controlled the front end of the curve but not the back end was commonly expressed. Customers pointed to ongoing issues with emerging markets (exposed to slowing global trade and rising US interest rates and USD); widening corporate spreads; trade disruptions; tightening financial conditions outside the US as USD shortages squeeze countries with current account deficits; and a slowdown in Europe particularly as the ECB and QE.
Concerns around a disruptive trade environment are much more prevalent amongst these customers than in our own view. However no one could confidently enunciate the scenario.
These developments were likely to see an inverse US yield curve emerge in the first half of 2019. My view is that such a curve would not, on this occasion, signal a US recession since the necessary dynamics required for a recession would be for the FED to overshoot as inflation surged. I do not see three more hikes as an overshoot and expect inflation to be contained around the 2% "axis".
Views on the USD, in that scenario, were for USD strength as the FED was tightening and global risks increased although the turning point in the USD, as a US recession neared, would be much sooner than our own view of around mid 2019 when the FED signalled its pause.
Sentiment on Australia
While the Westpac view of no change in the RBA cash rate in 2018 and 2019 is decidedly non-consensus amongst markets and economists in Australia there was considerable support for that view amongst these overseas customers.
Until recently Australia had not been on the radar screen for investors. Over the course of the last nine months markets have progressively priced out the RBA style "rate hike" scenario. There was considerable curiosity as to why RBA would maintain the line about rates. Investors noted their views around the global environment and tightening Australian financial conditions and, in particular, housing.
Investors could not understand why the RBA would be signalling eventual rate hikes with housing weakening and financial conditions tightening. The rise in BBSW and the common assessment that USD shortages outside the US were likely to intensify at the expense of AUD funding was expressed. Others pointed to tightening liquidity in the Australian markets and rising repo rates, (sovereign repo rates at 2% compared to RBA cash at 1.5%).
For Australia, much depended on the global outlook. Those expressing the view set out above were not confident and were particularly curious about the RBA's bullish 3.25% growth outlook for 2019.
Our view that Australian bond rates could fall further below US rates was supported by those investors who, like ourselves, expected further increases in US bond rates although those expecting that the US bonds were near the peak did not anticipate further contraction.
Views on the AUD were contingent on the global view including the outlook for China. Generally, an orderly slowdown in China was favoured. No significant risks were perceived around the Chinese financial system, despite our own more cautious advice.
Europe
I am writing this note as Mr Draghi is explaining his latest policy update. The anticipation of these announcements during my visits was intense. The consensus for the timing of the ending of QE was end year but the details were not expected to be announced until July. Some considered that the tapering was necessary given that the ECB was nearing its limit of holding no more than 33% of any existing line of government bonds (a constraint really only for Germany; certainly not Italy). Others were adamant that the ECB needed to send a clear signal to Italy.
Progress on inflation has improved sharply with the rise in energy prices (headline near 2%) although underlying inflation languishes at 1.1%. Unlike UK and Australia wages growth has lifted in the Euro area although this is mainly due to Germany.
There was considerable uncertainty around the output gap in Europe - some argued it had closed totally (potential growth assessed as 1.25%); others talked about a 5% output gap (potential growth of 1.75%). Underlying inflation has been behaving more like the wider assessments.
Economists were surprised and really unable to give a convincing explanation of the sharp downturn in the PMI's in 2018 with most expecting stability in the second half.
There was extensive criticism of the -0.4% ECB bank deposit rate. While that negative rate served the purpose of pushing banks out along the risk curve with credit spreads and equities benefitting, that process had run its course and negative rates were now simply a tax on banks. That undermined confidence in banks without assisting the real economy or the closure of the output gap.
Today's guidance of a slower than expected unwind of negative rates will be a disappointment.
Conclusion
As usual, these meetings in Europe/London are exhausting but definitely enlightening. I am going on leave for a few weeks and will have time to contemplate these intriguing times.
The week that was
The past week has been jam packed with data for Australia, the most notable releases being the June edition of Westpac-MI's consumer sentiment survey and the May labour force release. Offshore, it has been a tale of two central banks: one full of confidence; the other decidedly circumspect over the outlook.
Beginning first with our Westpac-MI consumer sentiment survey, a 0.3% increase was seen in the month of June to 102.1, an outcome above the series' long-run average but well below the level deemed consistent with a robust consumer. Australian households remain concerned over their family finances and risk averse. This is clearly seen in both the current and 1-year ahead views of family finances remaining below average despite 1-year and 5-year expectations for the economy, and those for the labour market, being robust. On expectations for the labour market, it is worth noting that June saw a sharp increase in unemployment expectations following a material decline over the past year. This comes after a material slowdown in employment growth in early 2018 (more below), and is a point to watch vis a vis household incomes and family finance expectations. On the housing market, recent price weakness is playing through to consumer expectations, with the survey's house price expectation index now at its lowest level since early 2016. Unsurprisingly, New South Wales and Victoria were the focus of this weakness. Interestingly, it does seem as though recent price declines have (to a degree) alleviated concerns over housing affordability, with the time to buy a dwelling series recording its second highest monthly outcome since September 2016, as a particularly strong gain was seen in NSW.
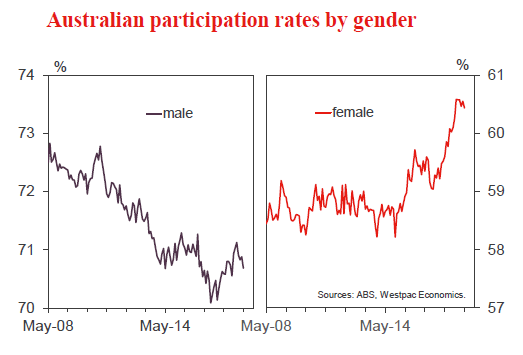
To the labour force survey for May. While the unemployment rate fell from 5.6% to 5.4% in the month, this was only because of a 0.15ppt decline in participation (see chart of the week). Employment growth was actually below expectations at 12k, with a downward revision to April also reported. Deceleration in job growth in 2018 is seen in the 6-month annualised pace. In January it was 3.6%; it has since fallen to 1.6% at May. As highlighted by Governor Lowe this week, reducing slack in the labour market is not just about creating jobs. The type of job matters a great deal, particularly for income prospects. Adding the additional hours part-time employees would like to work to base unemployment implies a underutilisation rate for labour of near 8.75%, well above the 5.5% unemployment rate averaged through 2018. To see materially higher wages growth, not only does the unemployment rate have to be brought down below 5.0%, but the excess capacity of part-time workers who want to work more also has to be worked through.
The May NAB business survey was also released this week. Key from this report was that, while conditions and confidence both fell in the month, conditions remained well above long-run average levels, and confidence in line. The continued strength in conditions is broad based by state - indicative of synchronised growth across the nation. However, by industry, goods related sectors such as construction and manufacturing remain much stronger than those tied to the consumer.
Turning to overseas developments, the past week has been pivotal for global monetary policy, with both the FOMC and ECB meeting. Broadly, the FOMC franked market expectations by: raising the fed funds rate by 25bps for a second time in 2018; remaining optimistic over economic activity in 2018 and 2019; but cautious on inflation prospects. Together with the activity and inflation forecasts, the median 2018 rates expectation of the Committee shifting from 3 to 4 hikes (as one member altered their forecast) is best construed as evidence that risks are tilting to the upside not that four hikes have been locked in. We continue to forecast a third 2018 hike in September and view a follow-up (fourth hike) in December as a risk if the 10-year yield fails to rise materially above 3.00%. A further two hikes are factored into our forecasts in 2019, taking the fed funds rate to 2.625% (if a fourth hike in 2018 does not occur). As we see neutral as 2.5%, in tandem with a stronger US dollar and the end of increased government spending, this is likely to be enough to cause a material slowdown in growth in late 2018, putting a halt to the FOMC's hiking cycle come June 2019. The FOMC instead believe neutral to be higher, circa 2.9%, and so expect to be hiking into 2020.
From the ECB, we received two significant announcements: the ceasing of net asset purchases at December 2018 after at 3-month extension at €15bn per month; and a commitment to keep key ECB rates unchanged through northern summer 2019. The latter was most significant for the markets, highlighting downside risks to the outlook and the difficulty that the ECB continues to have in stoking core inflation towards target. The net result on markets of these two meetings is a stronger US dollar (at the expense of the Euro) and lower market rates across the curve in Europe.
For those in search of some weekend reading, the latest edition of Market Outlook has been released. Key themes for the Australian and global outlook as well as the Australian dollar are discussed in depth. Thematic 'hot topics' on household incomes & wealth and commodity prices are also of note.
Chart of the week: labour market participation
We noted in the April release that the Australian labour market was more dynamic through 2017 with rising labour demand being met by rising supply - in particular female rich employment gains were being met by rising female participation.
Then as the labour market slowed through the first half of 2018, male unemployment started to rise as male participation was not easing as fast as the moderation in employment. Last month we wondered if this trend would continue boosting unemployment.
Now we know that, at least in May, there was a surge in males leaving the workforce, possibly retiring, which dragged male unemployment down to 5.4% from 5.7%. Female unemployment fell too but it was a smaller decline from 5.5% to 5.4%.
New Zealand: week ahead & data wrap
Slowing momentum
Recent data has reinforced our view that the drivers of New Zealand's economic growth are becoming more mixed. Next week's GDP data is likely to show that annual GDP growth slowed to 2.8% in the March quarter - its slowest pace since September 2014 - as momentum in the household and construction sectors has faded. But although New Zealand's economic cycle is maturing, it's certainly not all doom and gloom. The strong terms of trade is one noticeable bright spot, with strong incomes in the export sector set to provide a key role in supporting growth.
Much of the slowdown in economic activity has been centred on the household sector, with the cooling in the housing market a key influence. On that front, May REINZ data showed that seasonally adjusted sales were down 0.7% in the month and the average number of days to sell has increased. Nationwide prices eased 0.2% in May, following a similar decline in April.
But beneath the headline result, there are marked differences across regions. The slowdown in the housing market has been most keenly felt in Auckland (and to a lesser extent Canterbury). In Auckland, house prices are now falling gradually on a monthly basis, are down 2% since February. Average prices in the region are now back at August 2016 levels.
Outside of Auckland, house prices rose a touch in May, and are up 6.8% on a year ago. But even that's still a much more gradual pace of growth than we've seen in recent years. A year ago, annual house price inflation outside of Auckland was running at a rate of 11%, and two years ago it was almost 16%.
The slowdown in the housing market in recent months has matched our expectations that the changing policy backdrop would be a significant drag. In March we saw the holding period for taxing capital gains on investment properties extended from 2 years to 5 years (the so called 'bright line' test). At the margin, this may have prompted some investors to bring their purchase of properties forward ahead of the changes coming into effect. However, moving forward it has made purchasing property less attractive to investors and speculators.
Looking ahead, we expect the housing market to cool further as more of the Government's policies designed to slow the housing market move from the drawing board and into practice. Notably, the ban on foreign buyers looks set to come into effect next month. And with recent data showing offshore buyer activity concentrated in Auckland and the Queenstown Lakes District, it seems likely that this policy change will affect these regions the most. In addition, any lift in buying ahead of the new rules coming into effect could have generated a temporary lift in housing market activity, that we would expect to fade going forward. The third policy change proposed by the new Government is the graduated removal of the ability of investors to write off losses on their investment property against other incomes. This will further erode the incentives around property investment and dampen house price growth.
Combined, these policy changes, along with a gradual rise in mortgage rates and slowing population growth, are likely to see annual house price inflation fall to 0% by the end of the year.
With so much of New Zealander's wealth tied up in housing assets, developments in the housing market have big implications for household spending. Going forward we expect the cooling housing market, combined with slower net migration, will be a significant drag on household spending. Indeed there are already signs that the pace of growth in retail spending has stalled. This week's data showed electronic card spending rose just 0.5% in May, with spending levels essentially flat since January (albeit at a high level). And the pressure doesn't look set to ease any time soon. Rising oil prices and forthcoming fuel tax increases mean filling the petrol tank will eat up a greater share of household income, and will likely force households to trim other spending.
Softness in the consumer sector is also likely to feature in next week's March quarter GDP release. We expect 0.4% GDP growth in the quarter, which would mark the third consecutive quarter of subdued growth (GDP expanded by 0.6% in the September and December quarters of 2017).
Sectors that touch on a wide range of economic activity - such as transport, retail, wholesaling and business and personnel services - are all expected to show weak growth or even outright declines. In contrast, the strongest growth is likely to be in the public sector. We should note, however, that the main indicator for this in the national accounts is the Government's personnel expenses - a measure of inputs, which doesn't necessarily translate into more outputs. The support to growth generated by a lift in the delivery of public services is more a story for 2019 and beyond.
But it's certainly not all doom and gloom for the New Zealand economy. Although some of the recent drivers of growth are fading, New Zealand's strong terms of trade remains a bright spot. The terms of trade eased a touch in the March quarter. But that's coming off an all time high reached at the end of 2017. The strong terms of trade has been helped by broad based strength in New Zealand's key export commodities. Almost everywhere you look, farmers and growers are benefitting from high international prices for their products thanks to a combination of robust global demand and, in some cases, tight supplies. While we expect international commodity prices to ease over the coming months as growth in China slows, a weaker NZ dollar should buffer the effect at the farm and orchard gate. This should help the export sector take a bigger role in the economy as momentum in household spending fades.
Data Previews
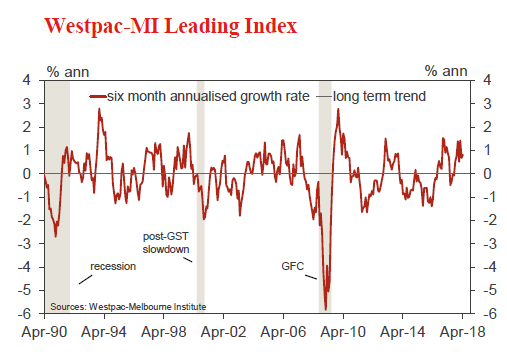
Aus May Westpac-MI Leading Index
- Jun 20, Last: 0.82%
The six month annualised growth rate in the Leading Index increased slightly from +0.77% in March to +0.82% in April. The above trend signal continues to come mainly from 'offshore' components - commodity prices and US industrial production - with domestic components largely flat.
The May will include updates on: the ASX200, up 0.5% vs 3.9% last month; the Westpac-MI Consumer Expectations Index, down -1% vs 0.8% last month; commodity prices, up 0.6% (in AUD terms) vs -3.2% last month; dwelling approvals, down -5% vs 3.5% last month; the yield spread, widened 15bps vs a 11bps narrowing last month; the Westpac-MI Unemployment Expectations Index, up 5.7% vs -4.5% last month; and total hours worked, -1.4% vs 1.2% last month.
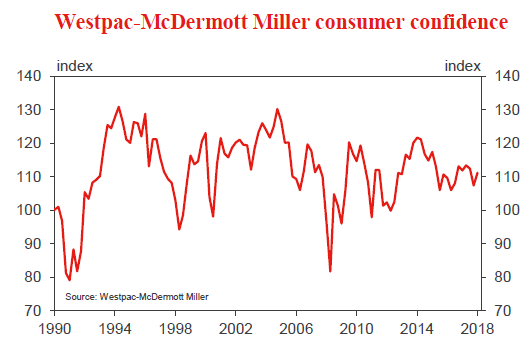
NZ Q2 Westpac McDermott Miller consumer confidence
- Jun 20, Last 111.2
Households perked up at the start of 2018. The Westpac McDermott Miller Consumer Confidence Index rose 3.8 points in March, taking it to a level of 111.2. That reversed most of the drop seen in the wake of last year's election and took consumer confidence back to around average levels.
The June survey will provide an update on how consumer confidence has fared in the face of changing conditions in the economy, including the slowdown in the housing market.
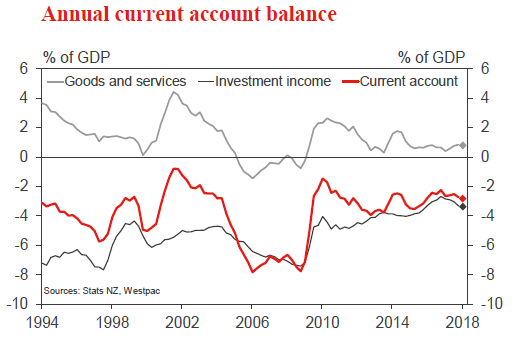
NZ Q1 current account, % of GDP
- Jun 20, Last: -2.7%, Westpac f/c: -2.8%, Mkt f/c: -2.8%
We expect the annual current account deficit to widen slightly to 2.8% of GDP. While goods imports remained firm, New Zealand's export performance worsened in the first quarter due to a drop in both prices and volumes. This decline is likely to be short-lived: commodity prices have since improved, and we suspect that the drop in volumes was due to the timing of shipments.
We expect a slight narrowing of the investment income deficit for the March quarter, with a pullback in profits of overseas-owned firms after a few unusually strong quarters. However, the deficit is still likely to be larger than it was a year ago, contributing to a widening of the annual current account deficit.
NZ Q1 GDP
- Jun 21, Last: 0.6%, Westpac f/c: 0.4%, Mkt f/c: 0.5%
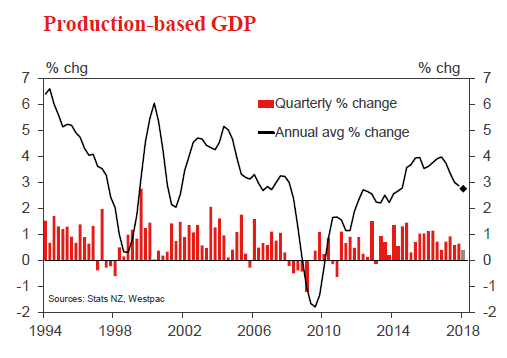
Following only modest growth in the December quarter, we expect that GDP growth softened again in March. We're forecasting only a 0.4% rise over the quarter. That would pull annual GDP growth down to 2.8%, which would be the slowest pace since 2014.
We expect the strongest growth to be in the public sector. We also expect a lift in agriculture, and a related lift in food manufacturing.
However, a wide range of economic activity - such as transport, retail, wholesaling, and business and personal services - are expected to show weak growth at best, or even outright declines.
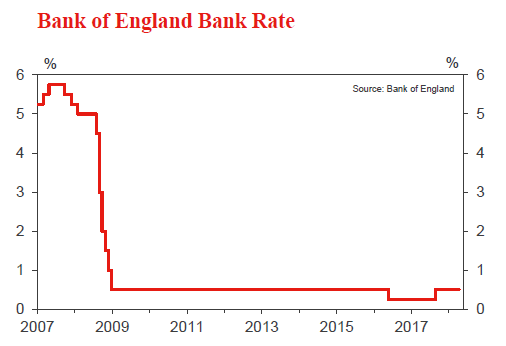
UK Bank of England Bank Rate Decision
- Jun 21, Last: 0.5%, Westpac f/c: 0.5%, Mkt f/c: 0.5%
We expect the Bank of England to keep the Bank Rate on hold at its June policy meeting.
Despite a sharp rise in fuel prices, annual headline inflation remained at 2.4% in May. In addition, core inflation is sitting at 2.1%yr - only just above the Bank of England's 2.0%yr target.
The BOE is still expected to signal that gradual, limited rate increases will eventually be required. However, with the combination of fairly well contained core inflation, subdued economic growth, and lingering downside risks associated with Brexit, rate hikes are still some way off.
Weekly Focus: The US is Leaving the Euro Area Behind
Market Movers ahead
- Trade frictions between the US and China will be in focus over the coming week. An escalation could be on the cards.
- We expect euro area PMI to fall further in June, adding to the past five months of decline.
- In the UK, it is time for Bank of England meeting. It is one of the 'small' meetings and we look for unchanged policy rates.
- OPEC is due to meet on Friday and we expect a signal of unchanged production until end-year followed by an increase in production caps.
- In the Scandies, we look for another drop in Swedish manufacturing confidence while Norges Bank is set to continue to signal a rate hike 'after summer 2018', which most likely means September.
- On Wednesday, we are due to publish our Nordic Outlook, with fresh forecasts for the Nordic economies.
Global macro and market themes
- The US is leaving the euro area behind in terms of growth.
- A dovish ECB ends tapering, sending EUR and bund yields lower.
- A more confident Federal Reserve signals four hikes instead of three this year. We have changed our forecast to reflect this.
- Risks to global growth are skewed to the downside due to trade friction, Italy and emerging markets.
- Volatility is higher but we expect equities to outperform on a 12-month horizon.
- More downside risk to EUR/USD short term but we still see it being higher in 12 months.
Sunset Market Commentary
Markets:
Global bonds started today’s trading session on the back of yesterday’s positive momentum. The ECB took one step forward (ending APP by the end of the year) but made two steps backward (extending lower for long rate guidance through the Summer of 2019) in its normalization process. ECB Nowotny argued today that the central bank actually hit its inflation target, confirming his hawkish stance and definitely not representing the consensus view in the GC. Risk aversion on stock markets, triggered by the new tariffs from the US and retaliation threats from China, created an additional safe haven flow. US Treasuries slightly underperformed German Bunds, but there’s no direct link with mixed US eco data (strong empire manufacturing survey and disappointing industrial production). German yields drop by 0.4 bps (2-yr) to 3.2 bps (10-yr) at the time of writing. Changes on the USD yield curve range between -1.3 bps (2-yr) and -2.7 bps (10-yr). 10-yr yield spread changes vs Germany narrow by 1 bp with Greece, Portugal (-5 bps) and Italy (-9 bps) outperforming.
EUR/USD. Today, trading in the major euro and USD cross rates took a breather after yesterday’s ECB’s guidance to rates unchanged through the summer of next year. EUR/USD changed hands in the mid 1.15 area at the start of European dealings. For now there was no further follow-through euro selling even as the interest rate differential between the USD and the euro widened further. EUR/USD even regained slightly ground. EMU CPI was confirmed at 1.9% Y/Y (headline) and 1.1% (core). Whatever, after yesterday’s ECB’ decision EMU data lost most of their relevance for ST market movements. The focus turned to the US. Sources close to the US government signaled that the US was to announce import tariffs on $50 bln worth of Chinese imports, which was confirmed later in the session. The story dented yesterday’s positive equity sentiment, but had little impact on FX. USD/JPY drifted off an intraday peak in the high 110 area after BOJ Kuroda’s press conference. The US Empire manufacturing survey printed again very strong, but had hardly any impact on the dollar. May US production data disappointed. EUR/USD trended cautiously higher, currently trading near 1.1620/25. USD/JPY hovers in the 110.50 area. (FX) markets are now looking forward to the reaction of China to the new US import tariffs and to its potential impact on global risk sentiment.
GBP. Yesterday, the overall post-ECB decline also pushed EUR/GBP lower in the 0.87 big figure. This morning EUR/GBP initially hovered in a rather tight range in the 0.8750/25 area. There were still plenty of headlines on the Brexit stalemate within the UK conservative party. Initially, it didn’t help to euro to regain ground against sterling. EUR/GBP even touched a new ST correction low this afternoon. Later, EUR/GBP joined the intraday euro rebound. EUR/GBP trades currently again in the mid 0.87 area. Next support at 0.8710/0.8695 (MT correction lows) remains within reach. Cable dropped temporary below the 1.3242 MT support, but a clear break didn’t occur yet (currently 1.3285).
News Headlines:
The NY Empire Manufacturing survey (25.0) exceeded expectations (20.1) by quite a margin. Moreover, important subcomponents such as prices paid (an inflation gauge), new orders (growth gauge) and number of employees (employment gauge) are all pointing to a solid US manufacturing sector. On the other hand, May industrial (-0.1%, vs 0.2% expected) and manufacturing (-0.7% vs no change expected) production data disappointed. The Fed indicated “special factors” were in play (supply disruption).
President Trump officially announced a 25% tariff on $50 billion worth of Chinese imports. The import taxes will be implemented in two stages: tariffs on a $34 billion tranche of 818 products lines will be in effect as of July 6. The remainder will be subject to a public comment period and will take effect later.
EUR/USD Mid-Day Outlook
Daily Pivots: (S1) 1.1468; (P) 1.1659 (R1) 1.1756; More.....
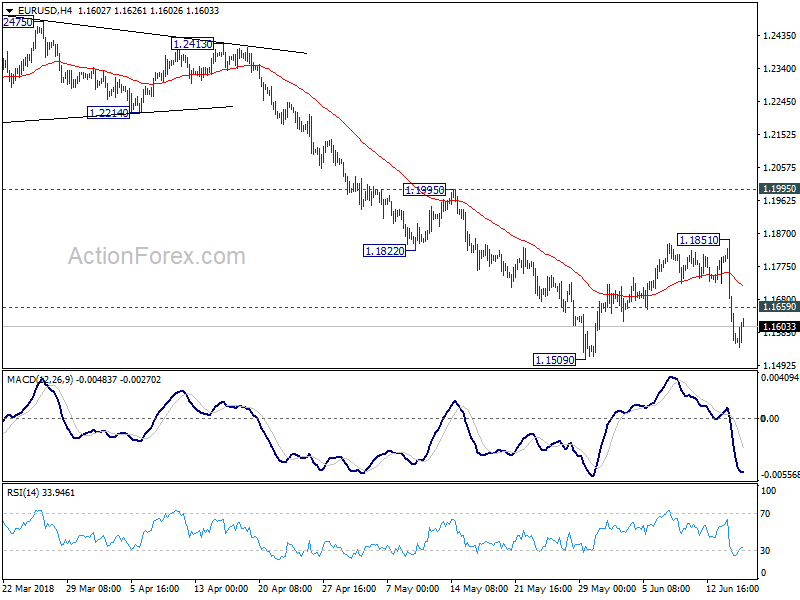
EUR/USD recovers mildly but intraday bias stays on the downside for 1.1509 low. Break there will confirm resumption of larger decline from 1.2555. EUR/USD should take out 50% retracement of 1.0339 to 1.2555 at 1.1447 with ease to 61.8% retracement at 1.1186. On the upside, above 1.1659 minor resistance will delay the bearish case and bring more consolidation first.
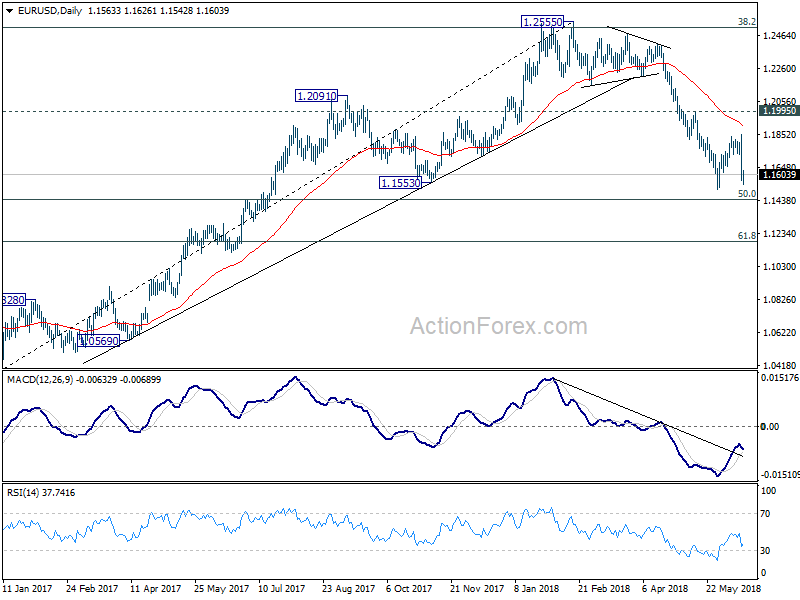
In the bigger picture, current development suggests that EUR/USD was rejected by 38.2% retracement of 1.6039 (2008 high) to 1.0339 (2017 low) at 1.2516. And, a medium term top was formed at 1.2555 already. Decline from there should extend further to 61.8% retracement of 1.0339 to 1.2555 at 1.1186 and below. For now, even in case of rebound, we won't consider the fall from 1.2555 as finished as long as 1.1995 resistance holds.
GBP/USD Mid-Day Outlook
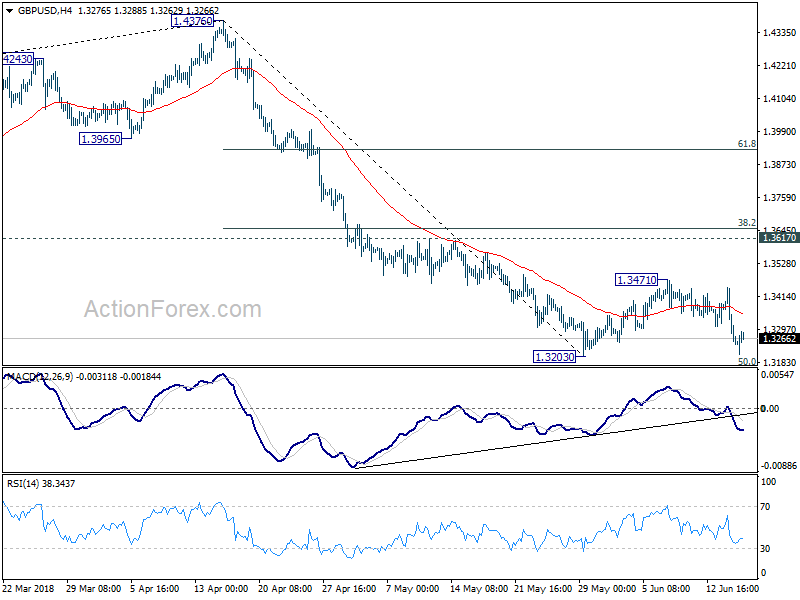
Daily Pivots: (S1) 1.3196; (P) 1.3321; (R1) 1.3384; More...
Intraday bias in GBP/USD remains on the downside for 1.3203 low. Decisive break there will resume the decline from 1.4376 and through 50% retracement of 1.1946 to 1.4376 at 1.3161 first, and 61.8% retracement at 1.2875 next. For now, outlook remains bearish as long as 1.3471 resistance holds, in case of recovery.
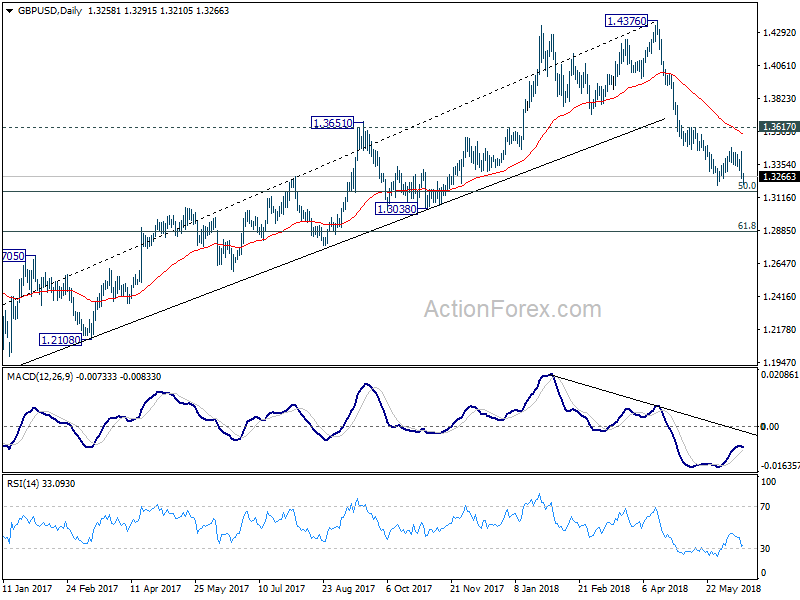
In the bigger picture, current development suggests that whole medium term rebound from 1.1936 (2016 low) has completed at 1.4376 already, with trend line broken firmly, on bearish divergence condition in daily MACD, after rejection from 55 month EMA (now at 1.4223). 61.8% retracement of 1.1936 (2016 low) to 1.4376 at 1.2874 is the next target. We'll pay attention to the reaction from there to asses the chance of long term down trend resumption. For now, outlook will stay bearish as long as 1.3617 resistance holds, even in case of strong rebound.
MOFCOM: China to retaliate at same scale, same strength
Response from the Chinese MOFCOM below. Original in simplified Chinese. Below is "google-translated":
China and the United States have conducted several rounds of consultations on economic and trade issues in an effort to resolve differences and achieve a win-win situation. We deeply regret that the United States has disregarded the consensus it has formed and is fickle, provoking a trade war. This move is not only damaging bilateral interests but also undermining the world trade order. China firmly opposes this.
China does not want to fight a trade war. However, in the face of short-sighted behavior that the United States has done against people's disadvantages, the Chinese side has to give a strong blow back, resolutely safeguard national interests and the interests of the people, and resolutely defend economic globalization and the multilateral trading system. We will immediately introduce taxation measures of the same scale and the same strength. All the economic and trade achievements previously reached by the two parties will be invalid at the same time.
In today’s era, launching a trade war is not in the global interest. We call on all countries to take joint action, resolutely put an end to this outdated and regressive behavior, and firmly defend the common interests of mankind.
USD/CHF Mid-Day Outlook
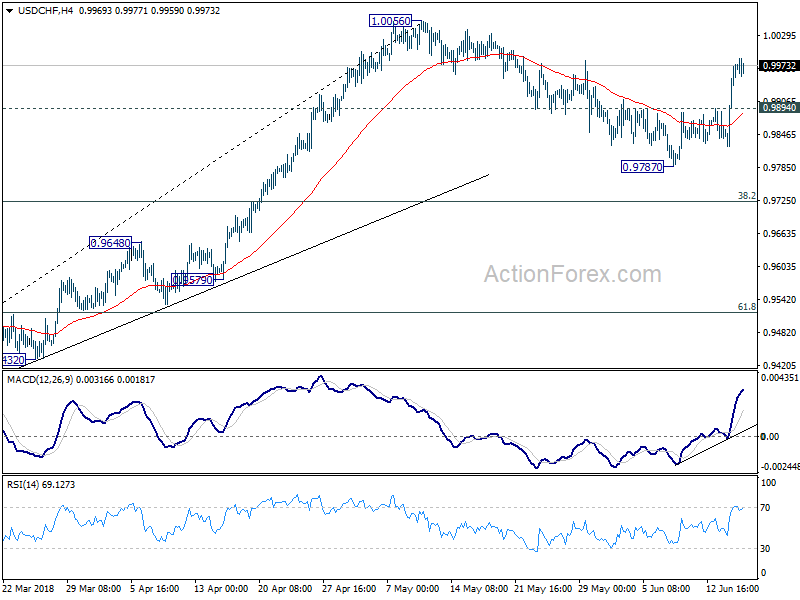
Daily Pivots: (S1) 0.9874; (P) 0.9923; (R1) 1.0022; More...
USD/CHF's rally is still in progress and intraday bias stays on the upside for 1.0056 high. Decisive break there will resume larger rise fro 0.9186 and target 1.0342 key resistance next. On the downside, below 0.9894 minor support will turn bias neutral and could extend the correction from 1.0056 for a while.
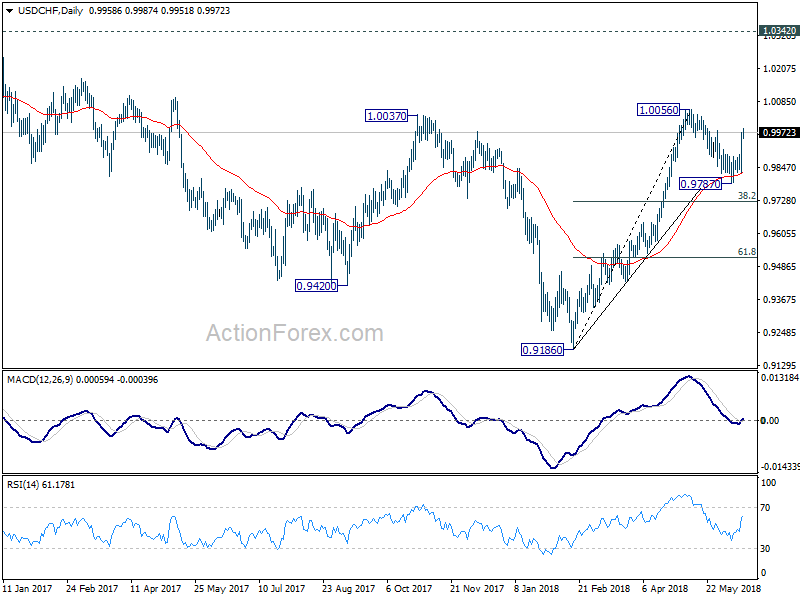
In the bigger picture, medium term decline from 1.0342 has completed with three waves down to 0.9186. Rise from there is currently viewed as a leg inside the long term range pattern. Hence, while further rally would be seen, we'd be cautious on strong resistance from 1.0342 to limit upside. For now, further rise is expected as long as 38.2% retracement of 0.9186 to 1.0056 at 0.9724 holds. However, sustained break of 0.9724 will dampen this bullish view and would at least bring deeper fall to 61.8% retracement at 0.9518.
USD/JPY Mid-Day Outlook
Daily Pivots: (S1) 110.13; (P) 110.41; (R1) 110.91; More...
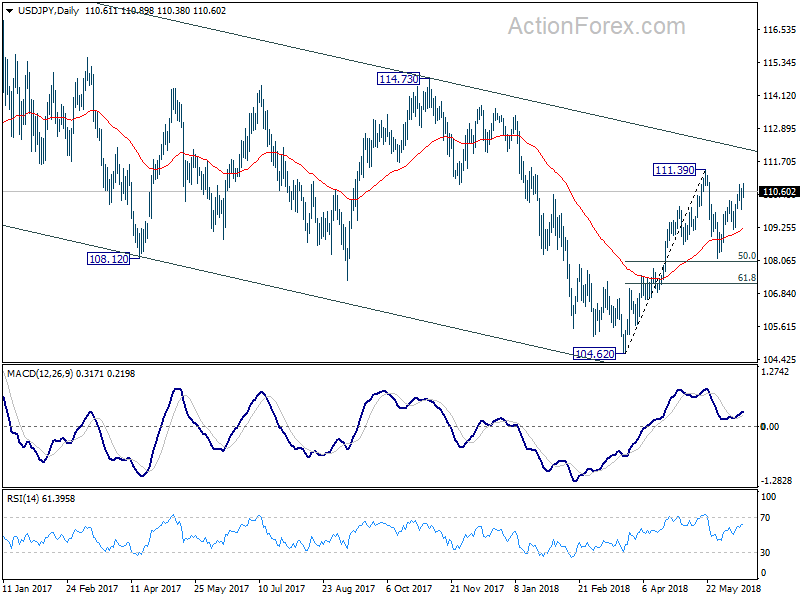
For now, intraday bias in USD/JPY stays cautiously on the upside for 111.39 resistance. Break there will resume larger rebound from 104.62 and target 114.73 resistance. On the downside, though, break of 109.91 will turn bias to the downside and bring another fall towards 108.10 to extend the corrective pattern from 111.39.
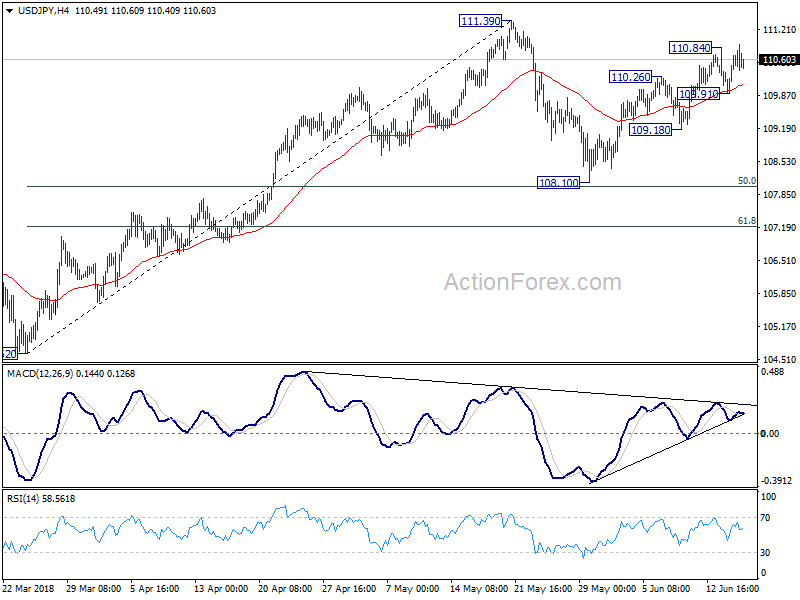
In the bigger picture, at this point, we're slightly favoring the case that corrective decline from 118.65 (2016 high) has completed with three waves down to 104.62. Above 111.39 will affirm this view and target 114.73 for confirmation. However, it should be noted that USD/JPY is bounded in medium term falling channel from 118.65 (2016 high). Sustained break of 61.8% retracement of 104.62 to 111.39 at 107.20 will likely resume the fall from 118.65 through 104.62 low.