Sample Category Title
EUR/JPY Weekly Outlook
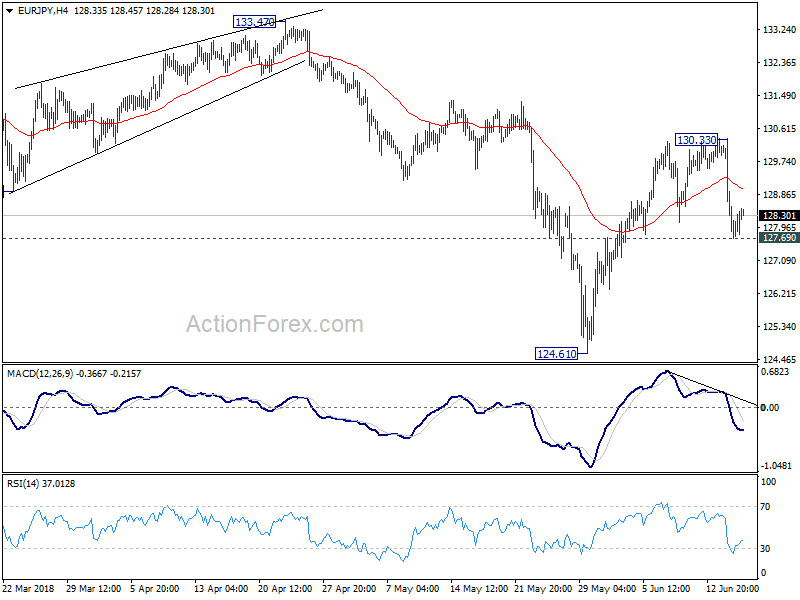
EUR/JPY edged higher to 130.33 last week but dropped sharply after failing to sustain above 55 day EMA. Initial bias is neutral this week with focus on 127.69 minor support. Break should indicate completion of whole rebound from 124.61 at 130.33. And deeper decline would be seen back to retest 124.61 first. On the upside, break of 130.33 will resume the rebound from 124.61 to retest 133.47 resistance.
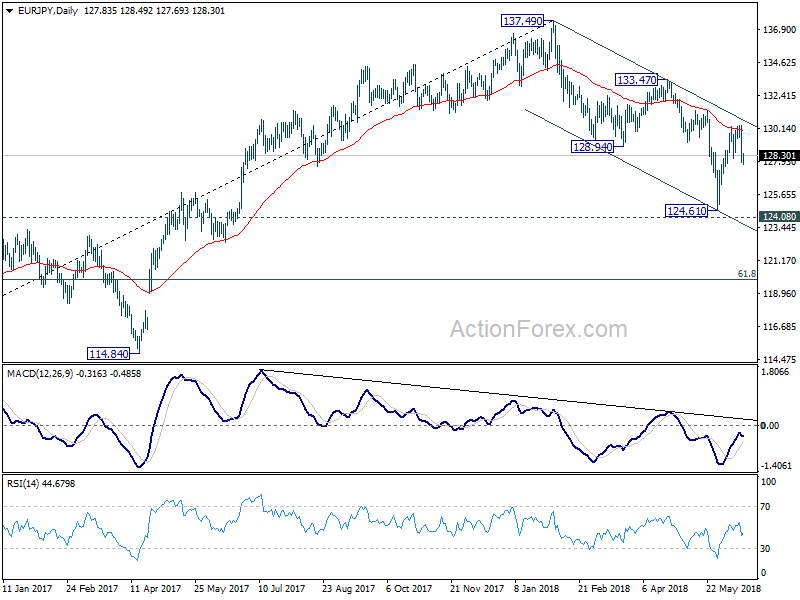
In the bigger picture, despite rebounding strongly ahead of 124.08 resistance turned support, there was no clear follow through buying. Note again that there is bearish divergence in daily MACD. Firm break of 124.08 will confirm trend reversal. That is, whole rise from 109.03 (2016 low) has completed at 137.49 already. In that case, deeper fall should be seen back to 61.8% retracement of 109.03 to 137.49 at 119.90 and below. Nonetheless, decisive break of 133.47 key resistance will likely extend the rise from 109.03 through 137.49 high.
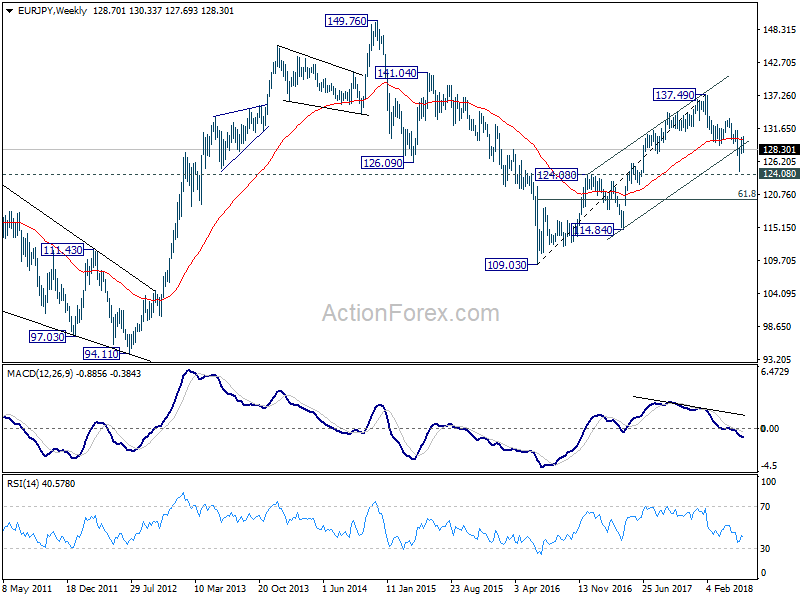
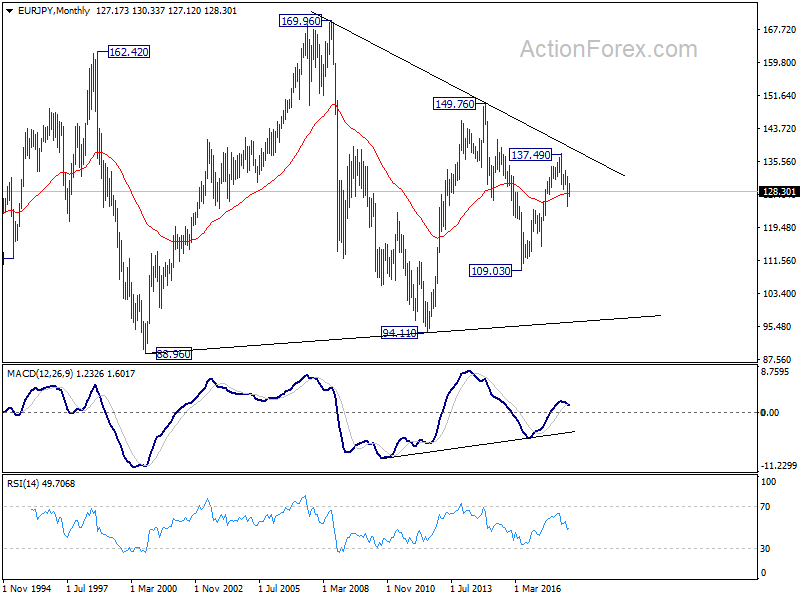
In the long term picture, at this point, EUR/JPY is staying in long term sideway pattern, established since 2000. Rise from 109.03 is seen as a leg inside the pattern. As long as 124.08 support holds, further rally is in favor in medium to long term through 149.76 high. However, break of 124.08 could extend the fall through 109.03 low instead.
EUR/GBP Weekly Outlook
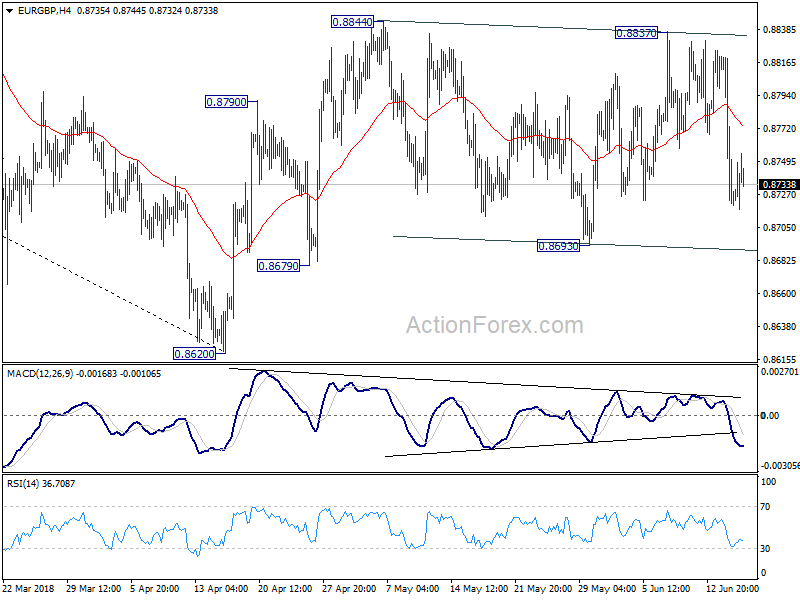
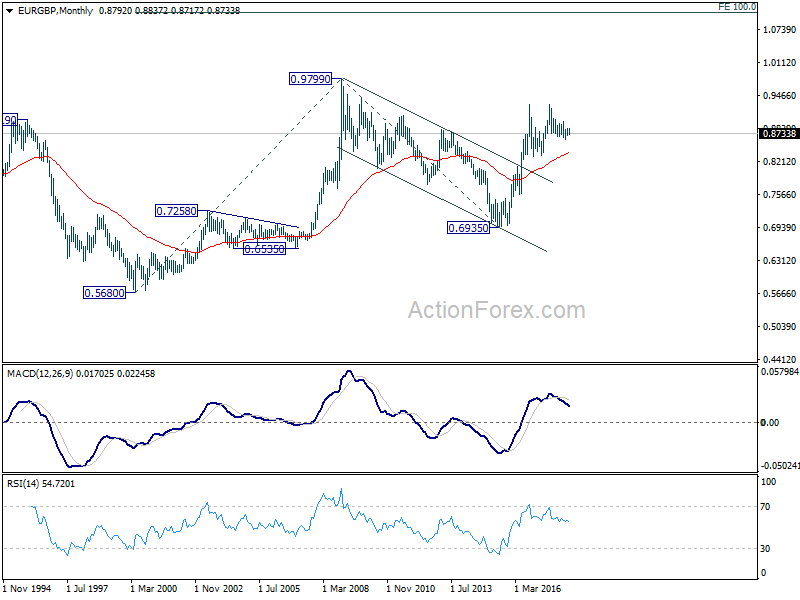
EUR/GBP stayed in range of 0.8693/8844 last week and outlook is unchanged. Initial bias remains neutral this week first. With 0.8693 minor support intact, we'd favor another rise. On the upside, break of 0.8844 will resume the rebound from 0.8620 for 0.8967 cluster resistance (50% retracement of 0.9305 to 0.8620 at 0.8963). However, break of 0.8693 will bring deeper fall back to retest 0.8620 low.
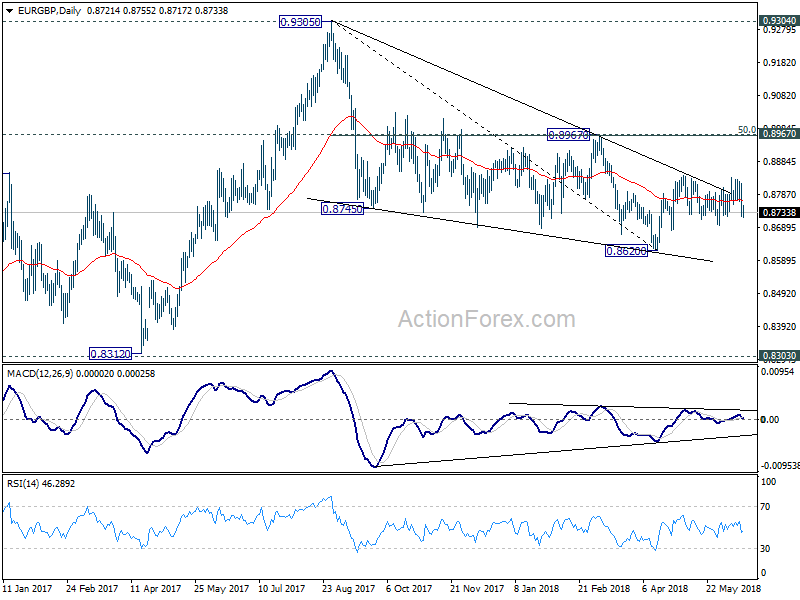
In the bigger picture, for now, the decline from 0.9305 is seen as a leg inside the long term consolidation pattern from 0.9304 (2016 high). Such consolidation pattern could extend further. Hence, in case of strong rally, we'd be cautious on strong resistance by 0.9304/5 to limit upside. Meanwhile, in another decline attempt, we'd expect strong support from 0.8116 cluster support (50% retracement of 0.6935 to 0.9304 at 0.8120) to contain downside.
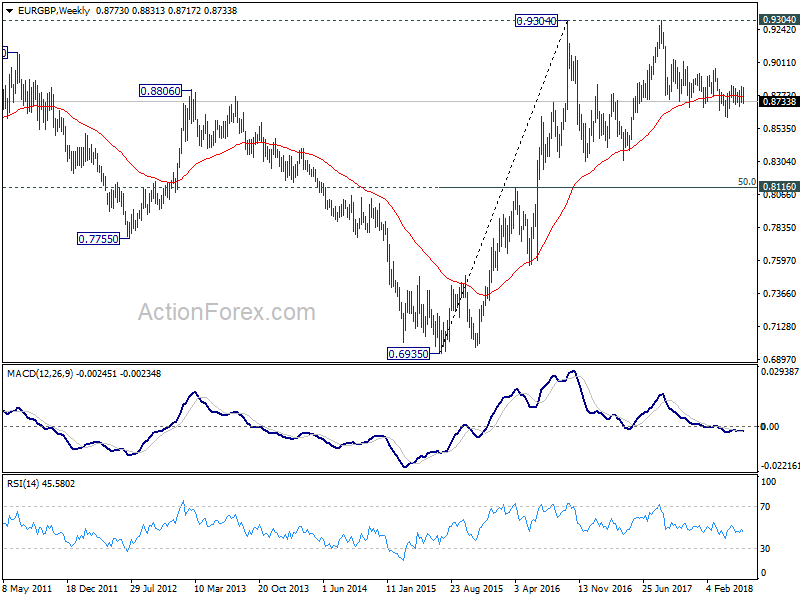
In the long term picture, we're holding on to the view that rise from 0.6935 (2015 low) is resuming the up trend from 0.5680 (2000 low). Hence, after the consolidation from 0.9304 completes, we'd expect another medium term up trend through 0.9799 to 100% projection of 0.5680 to 0.9799 from 0.6935 at 1.1054.
EUR/AUD Weekly Outlook
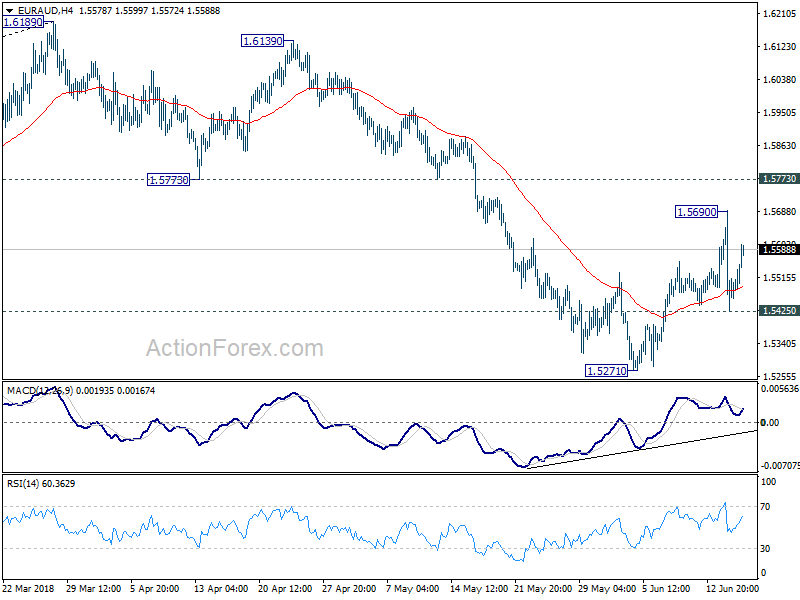
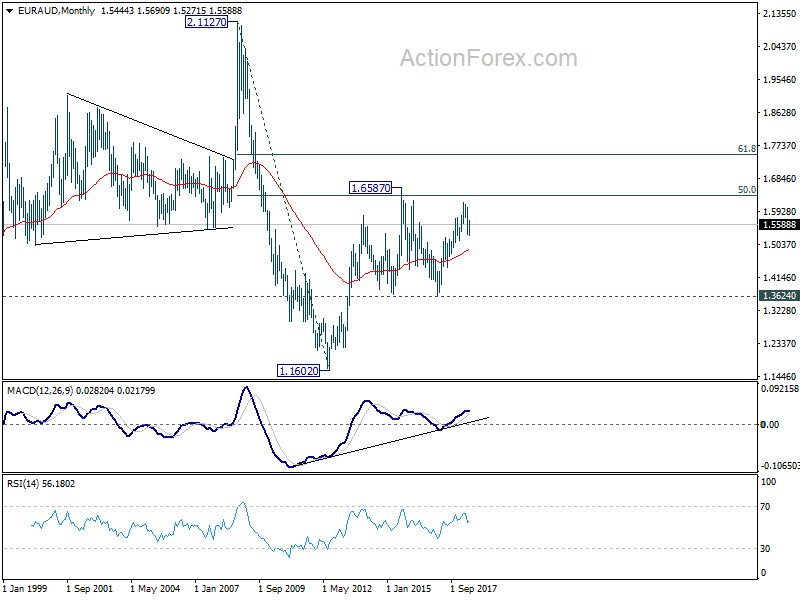
EUR/AUD stayed in corrective trading last week, rebounding to 1.5690, followed by steep decline to 1.5425. Initial bias is neutral this week first. For now, in case of another rise, we'd expect strong resistance below 1.5773 support turned resistance to bring fall resumption. Below 1.5425 will bring retest of 1.5271 low first. Break will resume the fall from 1.6189 and target 1.5153 key support next.
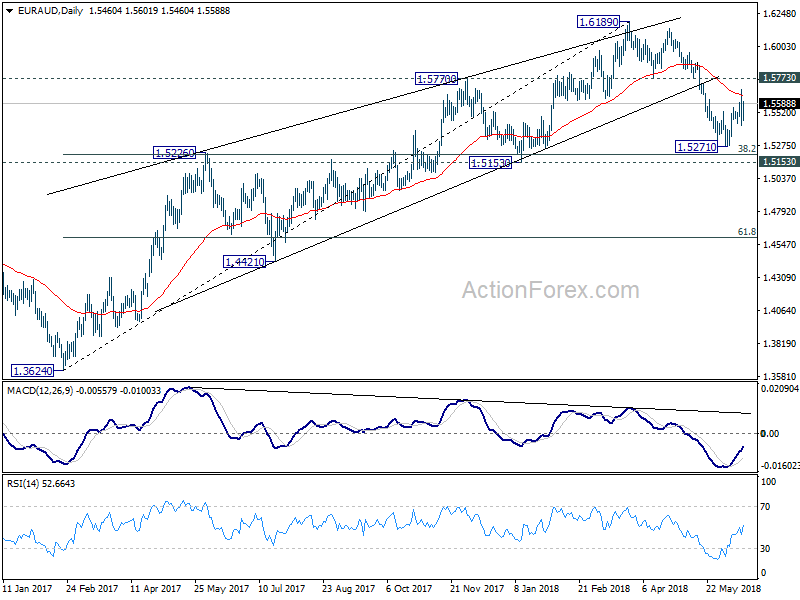
In the bigger picture, rally from 1.3624 (2017 low) should have completed at 1.6189 already, ahead of 1.6587 key resistance (2015 high). 1.6189 is seen as a medium term top. Deeper fall would be seen to 38.2% retracement of 1.3624 to 1.6189 at 1.5209 first. Decisive break there will pave the way to 61.8% retracement at 1.4604. In that case, we'll look for bottoming again below 1.4604. On the upside, firm break of 1.5773 support turned resistance is needed to indicate completion of the fall from 1.6189. Otherwise, further decline is expected in medium term, even in case of strong rebound.
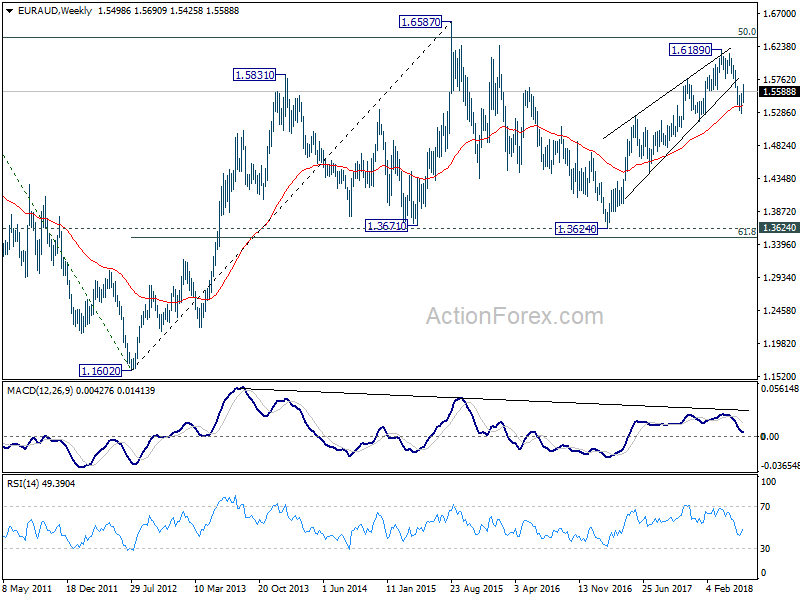
In the longer term picture, the rise from 1.1602 long term bottom (2012 low) isn't over yet. We'll keep monitoring the development but there is prospect of extending the rise to 61.8% retracement of 2.1127 to 1.1602 at 1.7488 and above. However, sustained trading below 1.3624 key support should indicate long term reversal and target 1.1602 long term bottom again.
EUR/CHF Weekly Outlook
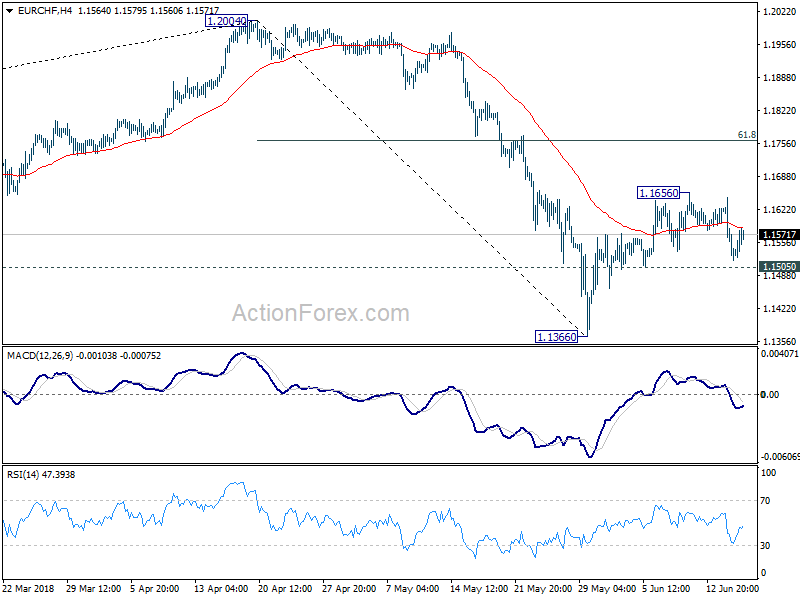
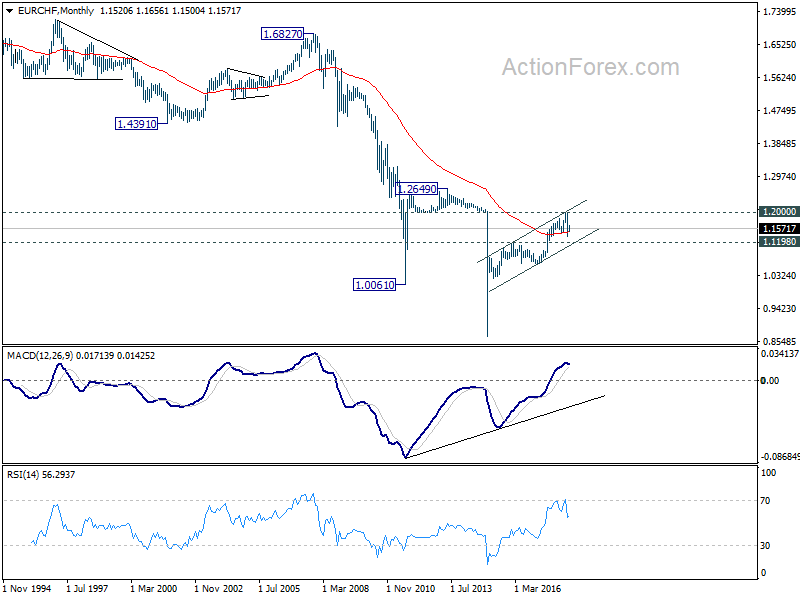
EUR/CHF stayed in range last week and despite, a steep dip to 1.1519, no follow through selling was seen. Initial bias is neutral this week first. Near term outlook is unchanged that the corrective pattern from 1.2004 is expected to extend with at least one more decline. One the downside, break of 1.1505 minor support will turn bias to the downside for retesting 1.1366 low first. Above 1.1656 will extend the rebound to 61.8% retracement of 1.2004 to 1.1366 at 1.1760. But, we'll we'll look for reversal signal above 1.1760.
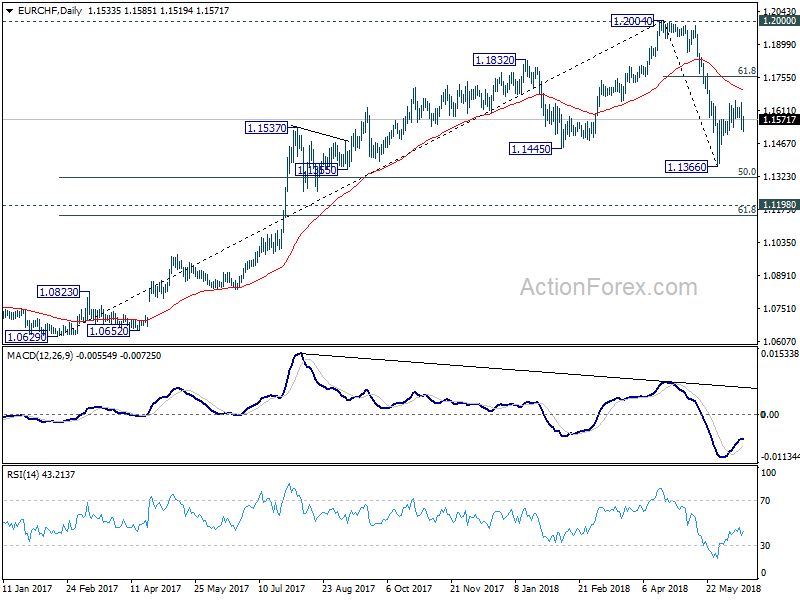
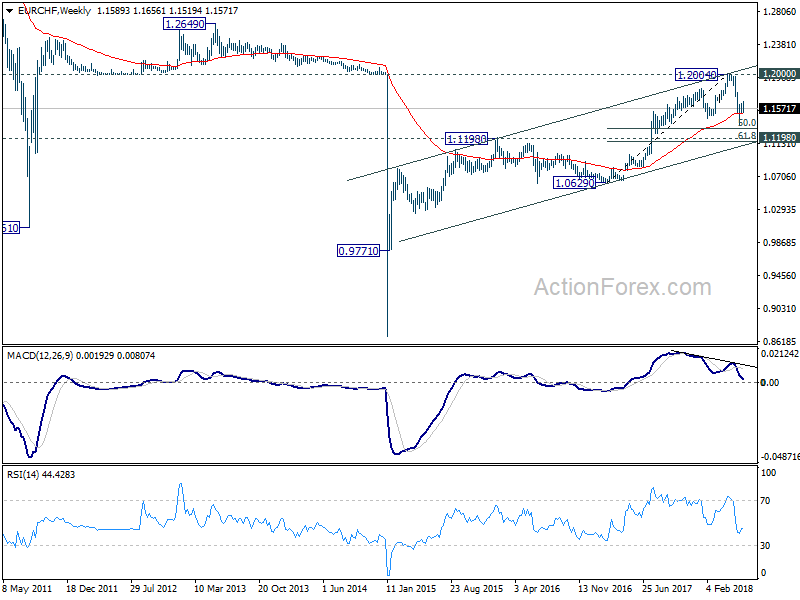
In the bigger picture, current development suggests solid rejection by prior SNB imposed floor at 1.2000. Considering bearish divergence condition in daily and weekly MACD, 1.2004 should be a medium term top. And price action from 1.2004 is correcting the up trend from 1.0629. Such correction is expected to extend for a while and therefore, we're not anticipating a break of 1.2004 in near term. Another decline cannot be ruled out yet. But in that case, strong support should be seen at 1.1198 (2016 high), 61.8% retracement of 1.0629 to 1.2004 at 1.1154 to contain downside.
Dollar Surged on Hawkish Fed, Trade War Threat Ignored
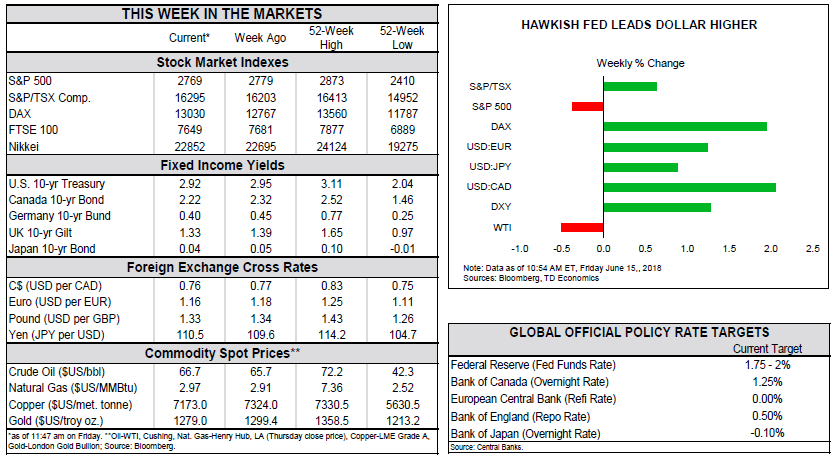
Dollar surged broadly last week as Fed policymakers finally made up their mind on hiking a total of four times this year, as reflected in the new projections. The greenback was also helped by ECB monetary policy decision, with traders disappointed on the rate path. The headlines were then dominated by trade war toward the end of the week, as the US abandoned negotiation and fired another shot towards China. But judging from the reactions in the currency as well as stock markets, investors were not too bothered by this US triggered trade war yet.
While Euro was sold of steeply after ECB, it wasn't the worst performing one of last week. Canadian Dollar was the biggest loser on concerns over trade tensions with the US. Adding to that oil price dived ahead of this week's OPEC+ meeting. Australia Dollar followed as the second weakest as RBA is no where near a rate hike. And, while Australia escaped the steel and aluminum tariffs, its economy will most likely be hurt by US protectionist trade policy indirectly through the trade war with China.
There will be more central bank activities this week, just ahead of half-year end. SNB and BoE are unlikely to give any surprise. RBA minutes will also continue to sing the same old tune.
US triggered second round of trade war, China responded
On Friday, the US Trade Representative formally announced the section 301 tariffs on Chinese imports, targeting products related to the Made in China 2025 policy. There are two set of tariffs lines. The first set contains 818 lines of the original 1,333 lines announced in April. This set covers around USD 34B of Chinese imports. 25% tariffs will be imposed starting July 6, 2018. The second set contained 284 proposed tariff lines, covering around USD 16B in Chinese goods. This set will undergo further public view before finalizing.
Altogether they're valued around USD 50B. and focuses on products from industrial sectors that contribute to or benefit from the "Made in China 2025" industrial policy, which include industries such as aerospace, information and communications technology, robotics, industrial machinery, new materials, and automobiles. The list does not include goods commonly purchased by American consumers such as cellular telephones or televisions.
Soon after, China announced the retaliation measures, targeting USD 50B of US products. The first set of productions include soybean, agricultural products, automobiles. These products are valued at around USD 34B, will be subjected to 25% tariffs, starting July 6, 2018. China would also impose 25% tariffs on other products, valued at around USD 16B, including chemicals, medical equipment, and energy products. Effective date is to be determined. China condemned US actions as violating rules of the WTO and threatens China's economic interests and security.
DOW's late rebound could be based on false hope
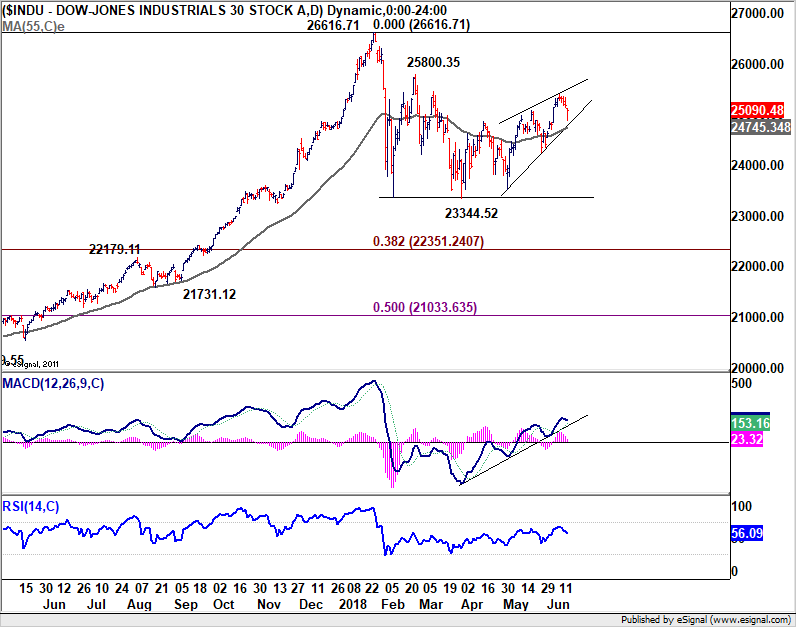
DOW initially tumbled to as low as 24894.38 on Friday, breaking 25000 handle. But it staged a strong rebound later in the session to close at 25090.48, just down -84.83 pts or -0.34%. Technically, the development kept near term rebound from 23344.52 intact. And more upside is in favor in near term. But the structure of the rebound and the weak upside momentum is in line with the view that it's a corrective move. That is, upside should be limited by 25800.35/26616.71 resistance zone. Another decline is expected as the third leg of the consolidation pattern from 26616.71 before it completes.
Fundamentally, Friday's movements could be based on the believes that US and China will go back to the negotiation table at some point. And there will eventually be a deal. But we'd like to point out that Trump's recent actions have clearly showed there is no intention of negotiation at all. Recalling the result of the Kim-Trump summit, Trump decided to stop military exercises with South Korea, for negotiation in good faith with North Korean leader Kim. But he "pointed a gun" to EU and Canada with steel tariffs for trade negotiations. He left the G7 summit early and overturned the statement at his allies' back. And in the end, nothing was achieved with the activated tariffs. It's the same with China as Trump clearly showed the master of deals is not going to the negotiation table. Hence, beware of a steeper selloff in stocks as investors finally realize this truth.
Fed is now ready for two more hikes this year
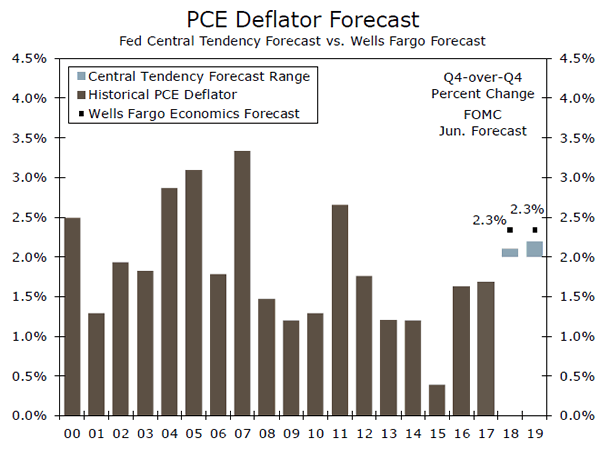
The FOMC announcement last week was more hawkish than generally expected. Federal funds rate was raised by 25bps to 1.75-2.00% as expected. In the new economic projections, the most important part is that federal funds rate is projected to be at 2.4% by the end of 2018, revised up from 2.1%. That is, Fed is now leaning towards total of four rate hikes this year. 2018 GDP forecast was raised to 2.8%, up from 2.7% in March projections. 2019 and 2020 GDP projections were unchanged at 2.4% and 2.0% respectively.
Headline PCE projection was raised to 2.1% from 2018 to 2020. That compares to March projection of 1.9% in 2018, 2.0% in 2019 and 2.1% in 2020. Core PCE projection was raised to 2.0% in 2018 and kept unchanged at 2.1% in 2019 and 2020. March projections predicted 1.9% in 2018, 2.1% in 2019 and 2020. Unemployment rate is projected to be at 3.6% by the end of 2018, 3.5% In 2019 and 2020. There were clear downward revision from March projection of 3.8% in 208, 3.6% in 2019 and 2020.
More on Fed:
- Fed Raised Policy Rate in June. Two More to Come amidst Upbeat Economic Developments
- FOMC Recap: Hawkish Statement And Projections, Hesitant Powell
- FOMC Review: Four Hikes More Likely After Removal Of Soft Wordings
- FOMC Raises Funds Rate Target, Alters Forward Guidance
- FOMC Raises the Fed Funds Rate to Range of 1¾ to 2 Percent
- Fed Raises Rates, Drops Forward Guidance in Pared Down Statement
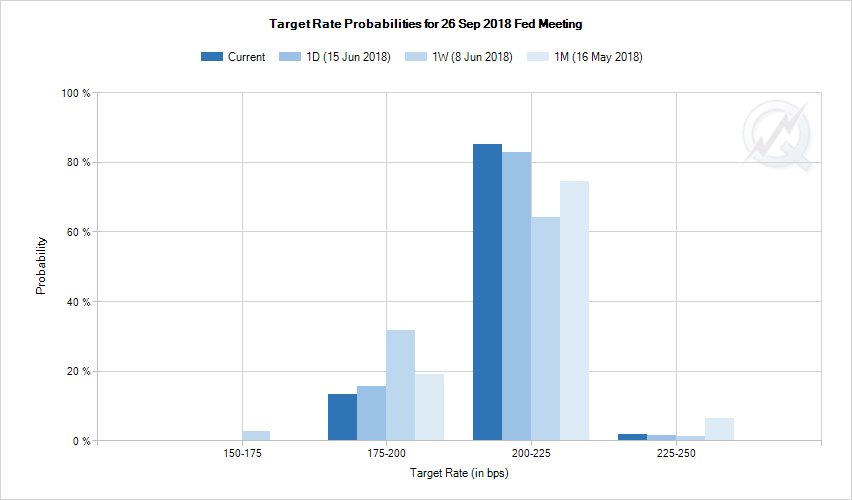
Fed funds futures are now pricing in 86.7% chance of a 25bps rate hike to 2.00-2.25% in September, up from 64.6% a week ago.
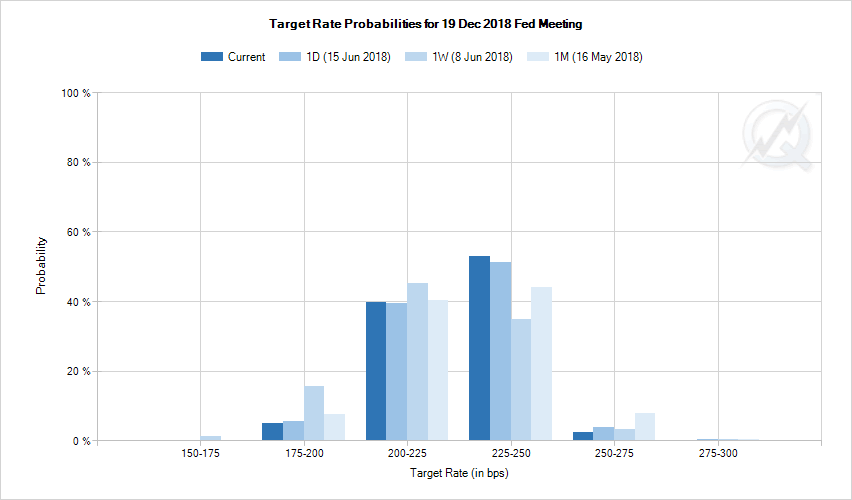
For December meeting, fed funds futures are pricing in 55.4% chance of another 25bps hike to 2.25-2.50%, up from around 34.9% a week ago.
Dollar surged on Fed expectations
Dollar initial hesitated after Fed's announcements. But bulls quickly jumped in following less hawkish than expected ECB decisions. Dollar index jumped to as high as 95.15 last week. The break of 95.02 indicates resumption of rebound form 88.25. But we'd prefer to see sustained break of 95.15 key resistance to confirm. Also, that should be accompanied by a decisive break of 1.1509 in EUR/USD, which it's still holding on to. Nonetheless, for the near term, outlook will stay bullish as long as 93.19 support holds.
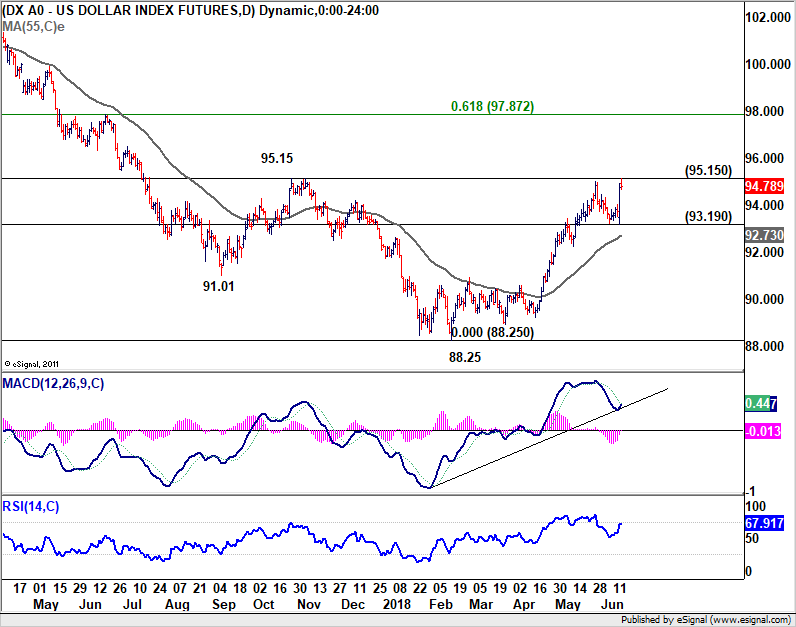
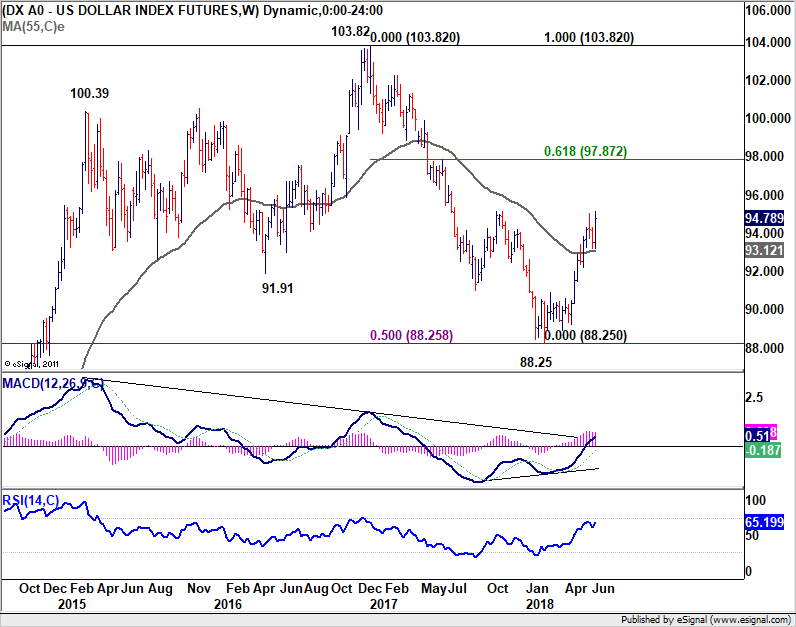
And in the bigger picture, current developments continue to solidify the case of trend reversal. Support from 55 week EMA shows some underlying bullishness. Firm break of 95.15 will pave the way to 61.8% retracement of 103.82 (2017 high) to 88.25 at 97.87 and above at a later stage.
Euro traders unhappy with ECB rate path
ECB announcement, on the other hand, disappointed Euro traders. The central bank did make that "judgement call" regarding quantitative easing. It decided to taper the EUR30B per month asset purchase program after expiring in September, to EUR 15B per month, subject to incoming data. The program will then run till the end of December 2018 and end there.
However, in the forward guidance, it's also mentioned that interest rates will be held at "present levels at least through the summer of 2019 and in any case for as long as necessary to ensure that the evolution of inflation remains aligned with the current expectations of a sustained adjustment path". Currently, the main refi rate, the marginal lending rate and the deposit rate at 0%, 0.25% and -0.40% respectively. Euro was sold off steeply as traders were unhappy with the rate path.
More in
- ECB to End QE in December, No Rate Hike At Least Until Summer 2019
- ECB: Rate Delay Outweighs End Of APP
- ECB: Making Plans to Dial Back Policy Accommodation
- ECB Review: End of APP But Stronger on Rate Guidance
- ECB Mario Draghi's introductory statement in press conference
Stocks loved that though
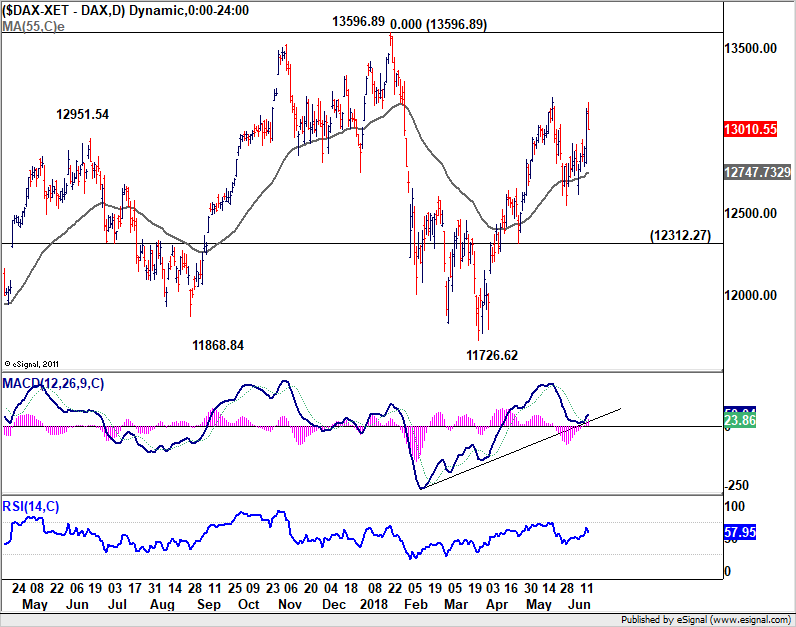
Nonetheless, stocks welcomed the ECB decisions. German DAX jumped to as high as 13170.05 before paring gains on US triggered trade war with China to close at 13010.55. The development kept the bullish move from 11726.62 alive. DAX is also held above a slightly rising 55 day EMA. As long as 12312.27 support holds, we'd expect further rally to retest 13596.89 high.
Canadian Dollar lost ground on outlook, trade and oil
Canadian Dollar suffered most last week on a couple of factors. Recent batch of weaker than expected data could keep BoC on the sideline for longer than expected. In additional to that, Trump and his aides' hostility towards Prime Minister Justin Trudeau and Canada in general suggested that the trade tensions will only escalate. Steel and aluminium tariffs are already there. The so called national security automobile tariffs are coming. And, there is no light in the ever dragging NAFTA negotiations.
Adding to that oil prices tumbled just ahead of an important meeting of OPEC, Russia and other producers in Vienna this week. It's speculated that OPEC could reach an agreement to moderately raise production over the coming months. Or, There could be a scenario that Saudi Arabia and Russia will shoulder the added productions. But one way or the other, oil production will likely be increased, but in a controlled way so as not to spike the markets.
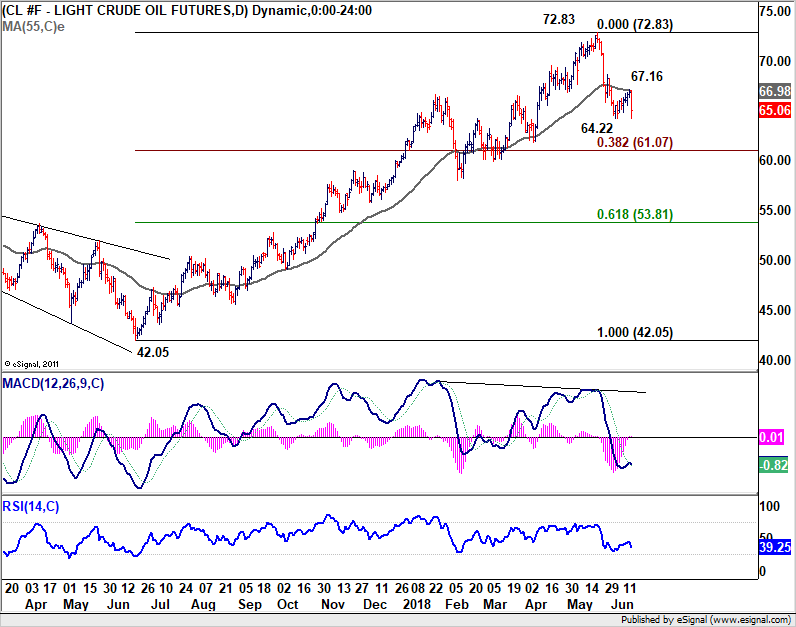
WTI crude oil 's sharp fall on Friday suggests that recovery from 64.22 has completed at 67.16 already. That came after rejection by 55 day EMA. Further fall should now be seen in near term, through 64.22, to 38.2% retracement of 42.05 to 72.83 at 61.07 next. We'd look for support from there, at least on initial attempt to bring rebound. But sustained break of 61.07 would drag WTI oil to next level at 61.8% retracement at 53.81. USD/CAD's break of 1.3124 last week solidifies the case of bullish reversal. Further decline in oil price will help push USD/CAD to 1.3793 resistance next.
USD/CAD Weekly Outlook
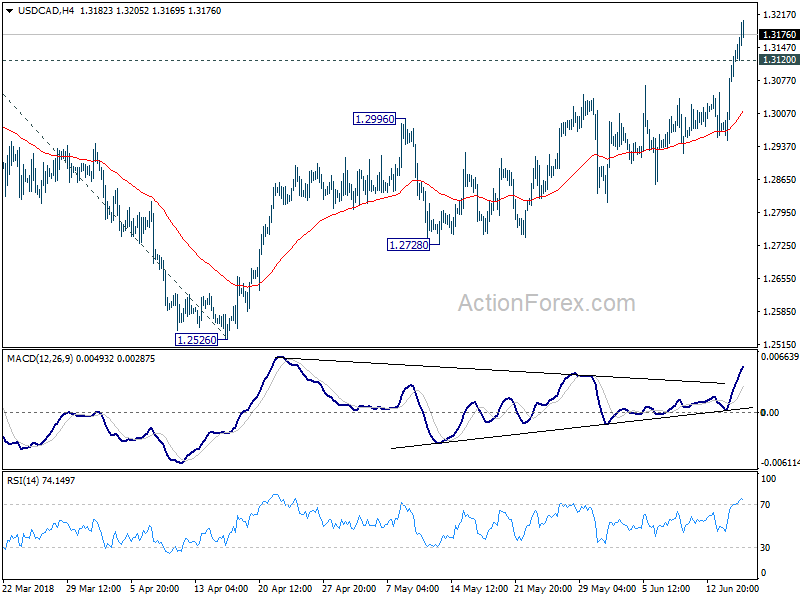
USD/CAD surged to as high as 1.3205 last week and the break of 1.3124 resistance confirmed resumption of medium term rebound from 1.2061. Initial bias remains on the upside this week for 100% projection of 1.2246 to 1.3124 from 1.2526 at 1.3404 next. On the downside, below 1.3120 minor support will turn intraday bias neutral and bring consolidation first, before staying another rally.
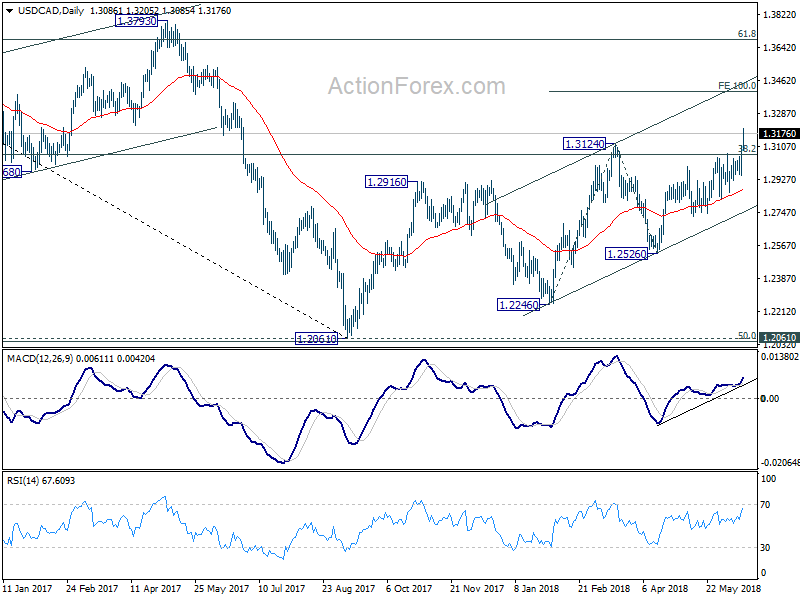
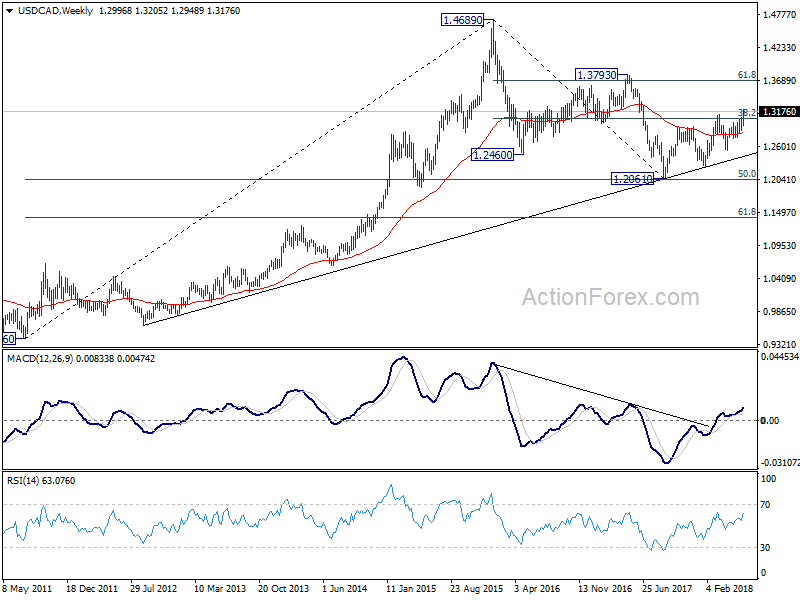
In the bigger picture, current development solidify the view of bullish trend reversal. That is fall from 1.4689 (2015 high) has completed at 1.2061, ahead of 50% retracement of 0.9406 (2011 low) to 1.4689 (2015 high) at 1.2048. Further rally should be seen for 61.8% retracement of 1.4689 to 1.2061 at 1.3685 and above. This will now be the preferred case as long as 1.2526 support holds, even in case of deep pull back.
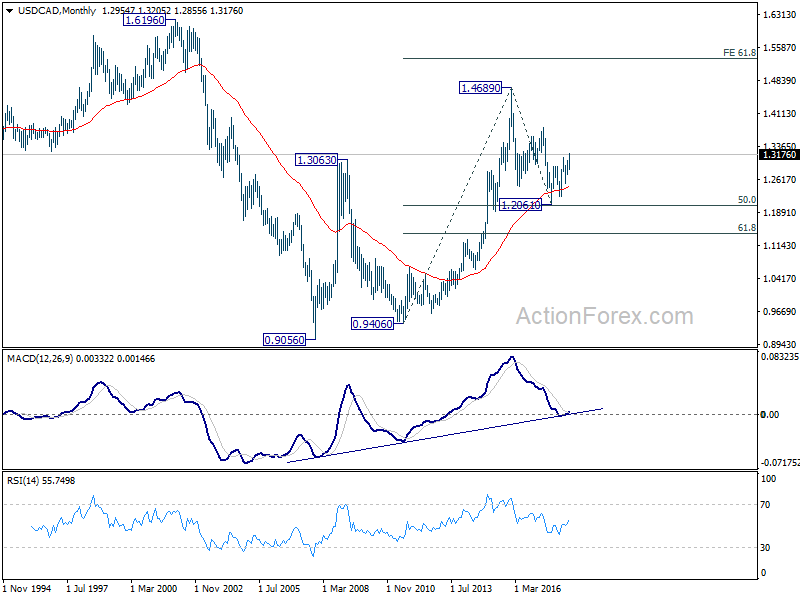
In the longer term picture, corrective fall from 1.4689 (2015 high) should have completed with three waves down to 1.2061, just ahead of 50% retracement of 0.9406 (2011 low) to 1.4689 (2015 high). The development keeps long term up trend from 0.9406) and that from 0.9056 (2007 low) intact. It's early to tell, but there is now prospect of extending the long term up trend to 61.8% projection of 0.9406 to 1.4689 from 1.2061 at 1.5326 in medium to long term.
China announced retaliation tariffs on soybean, agricultural products, automobiles
China announced retaliation tariffs on US importants, including soybean, agricultural products, automobiles. These products are valued at around USD 34B, will be subjected to 25% tariffs, starting July 6, 2018.
China would also impose 25% tariffs on other products, valued at around USD 16B, including chemicals, medical equipment, and energy products. Effective date is to be determined.
Below is the "google-translated" statement. Original statement in simplified Chinese could be found here.
Announcement on Imposing Tariff on Certain Products Originating in the United States
On June 15, 2018, the U.S. government announced that it would impose an import tariff of 25% on China's 50 billion U.S. dollar products, including levied tariffs on about US$34 billion of Chinese exports to the US The measures will be implemented on July 6. Additional tariff measures for the remaining US$16 billion will further seek public opinions. The United States disregards China's resolute opposition and solemn representations and insists on taking actions that violate the rules of the World Trade Organization. It seriously violates China's legitimate rights and interests under the rules of the World Trade Organization and threatens China's economic interests and security.
Regarding the emergency situation caused by the United States' violation of its international obligations to China, and in order to defend its legitimate rights and interests, China decided to rely on the laws and regulations of the Foreign Trade Law of the People's Republic of China and other basic principles of international law on soybean, agricultural products , automobiles , and water originating in the United States. Products and other imported goods are subject to tariff levying measures at a tax rate of 25%, involving about 34 billion U.S. dollars in imports from the United States in 2017 (see Annex 1). The above measures will take effect from July 6, 2018.
At the same time, China intends to impose an import tariff of 25% on commodities imported from the United States, including chemicals, medical equipment, and energy products, involving approximately US$16 billion in US imports from the United States in 2017 (see Annex 2), final measures, and effective time. Will be announced separately .
Annex:
Summary 6/18 – 6/22
Monday, Jun 18, 2018
[php_everywhere instance="1"]
Tuesday, Jun 19, 2018
[php_everywhere instance="2"]
Wednesday, Jun 20, 2018
[php_everywhere instance="3"]
Thursday, Jun 21, 2018
[php_everywhere instance="4"]
Friday, Jun 22, 2018
[php_everywhere instance="5"]
Oil: Lubricating the Wheels of U.S. Export Growth
Executive Summary
Exports of transportation equipment, computer & electronic products and chemicals have madelarge contributions to overall U.S. export growth since the current global upswing started in 2009.But exports of crude oil and petroleum products have punched well above their fighting weight interms of their contribution to overall export growth in recent years. Looking forward, we expectthat continued global economic growth and booming American oil production will support solid gains in overall U.S. export growth.
But we readily acknowledge the downside risks to this sanguine base case view. Specifically, therecent imposition of tariffs by the United States could lead to a trade war with important tradingpartners which could cause our current export forecasts to be optimistic. Although the "first order"effects of a trade war on the overall U.S. economy should be limited, there are potential knock-on effects that could cause the drag on U.S. economic growth to be more meaningful.
Petroleum Has Accounted for an Outsized Share of Export Growth
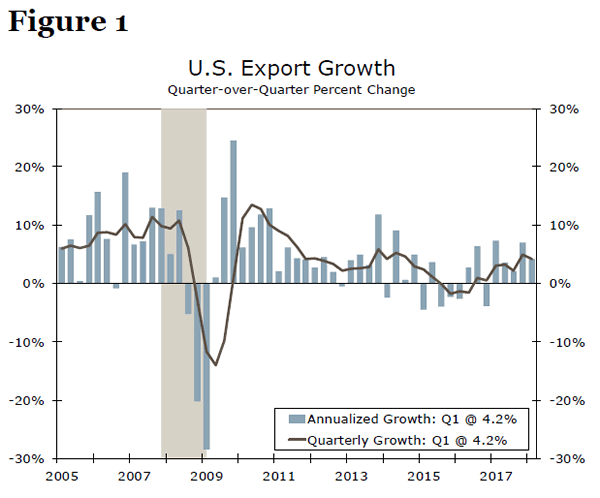
In a report we wrote earlier this year, we outlined our outlook for U.S. export growth in 2018 and2019.1 We forecasted, at the time, that real exports of goods and services would grow 5.4 percentthis year and 7.0 percent in 2019. Not only did exports end 2017 with good momentum—realexports of goods and services grew 7.0 percent at an annualized rate in Q4-2017—but they havecontinued to grow at a solid pace thus far in 2018 (Figure 1). Unless the wheels of export growthcome off in coming months, which we do not anticipate unless a full-blown trade war develops,then the 5.4 percent growth rate that we had forecasted in February should still be more or lessachievable.2 If realized, this growth rate would be stronger than the 4.2 percent annual average rate that real export growth has averaged in the post-crisis period.
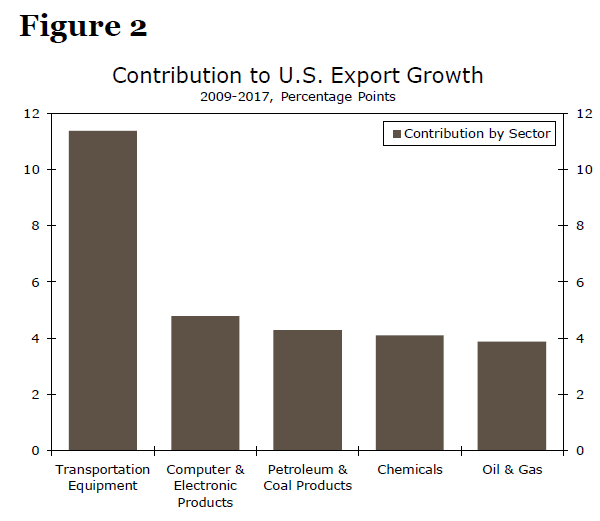
In value terms, American exports of goods rose 48 percent between 2009 and 2017. Are there anyspecific industries that stand out as important drivers of this marked increase in exports since2009? As shown in Figure 2, the transportation equipment industry (NAICS code #336) was thesingle most important driver to overall export growth, contributing more than 11 percentage pointsto the 48 percent increase in nominal goods exports between 2009 and 2017. Rounding out the topfive industries in terms of largest contributions to overall export growth were computer & electronicproducts (#334), petroleum & coal products (#324), chemicals (#325), and oil & gas (#211).Together, these five broad industries accounted for 60 percent of the increase in nominal goodsexports between 2009 and 2017. But this focus on the entire post-crisis period masks some interesting developments more recently.
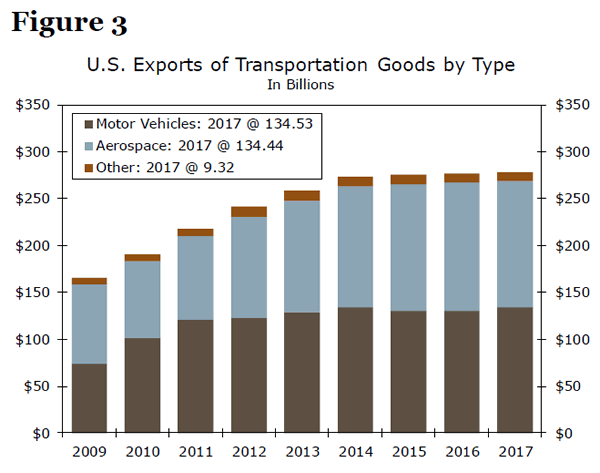
Let's start by taking a closer look at the broadly-defined transportation equipment industry. Asshown in Figure 3, motor vehicles and parts have accounted for roughly one-half of the exports ofthe broadly-defined industry in recent years, with aerospace (i.e., aircraft) accounting for the otherhalf.3 Although exports of transportation equipment rose sharply in the years immediately following the global financial crisis, they have been essentially flat on balance since 2014.
In contrast, exports of the American oil & gas industry have ramped up significantly over the pastfew years. The value of crude oil and liquid natural gas exports totaled less than $7 billion in 2009,held back in part by legislation that essentially banned the export of crude oil. But Congress liftedthe ban in late 2015, and exports of crude oil and liquid natural gas jumped to $45 billion in 2017.The ban did not apply to refined petroleum products, and American exports of these products totaled $41 billion in 2009. Exports of refined petroleum products doubled to $83 billion last year.
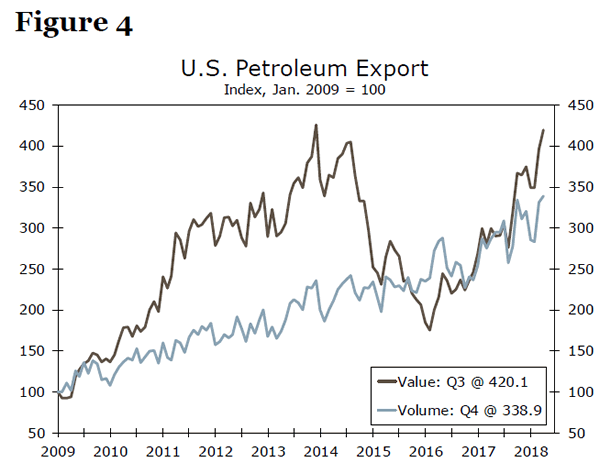
Values of total petroleum exports were supported in 2009 through 2014 by higher volumes as wellas by rising oil prices (Figure 4). The value of petroleum exports then weakened significantly in2015 and 2016 due to the collapse in oil prices. Nevertheless, volumes of petroleum exportscontinued to trend higher during those years. Indeed, volumes of petroleum exports haveaccounted for an outsized proportion of overall growth in real exports of goods in recent years. Although petroleum products (crude oil and refined products) represent only 12 percent of total exports at present, they accounted for two-thirds of the growth in real exports between 2014 and 2017.
Where To From Here?
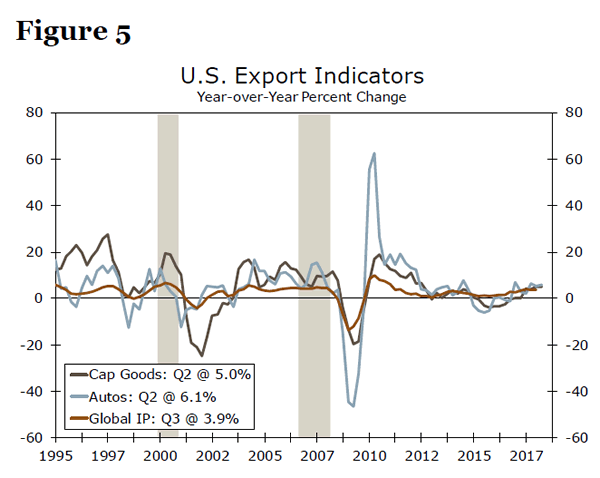
So what does this disaggregation tell us about prospects for American exports going forward? Themarked increase in exports of transportation equipment, chemicals and computer & electronicproducts in the immediate aftermath of the global financial crisis largely reflected the accelerationin global economic activity that occurred in those years. As shown in Figure 5, there is a high degreeof correlation between growth in real exports of capital goods (computer & electronic products areincluded in this category) and growth in global industrial production (IP), which we use as a proxyfor global economic activity. Similarly, growth in exports of autos (transportation equipment) andgrowth in global IP are also highly correlated.4 Although global economic growth may downshift abit this year relative to 2017, we generally look for the global economic expansion to remain intact.If so, then growth in exports of cyclically sensitive goods such as transportation equipment,chemicals and computer & electronic products should remain solid.
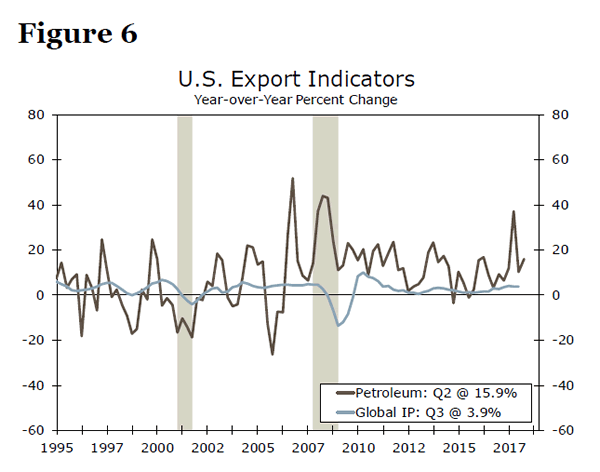
However, the correlation between growth in the volume of U.S. petroleum exports and global IPgrowth is rather low (Figure 6).5 Global economic growth was strong in the late 1990s and again inthe years preceding the global financial crisis, but volumes of U.S. petroleum exports were flatduring those years. But volumes of U.S. petroleum exports have shot up more than threefold since2009 despite generally lackluster growth in global IP. So something other than global growth is behind the sharp increase in American petroleum exports in the current cycle.
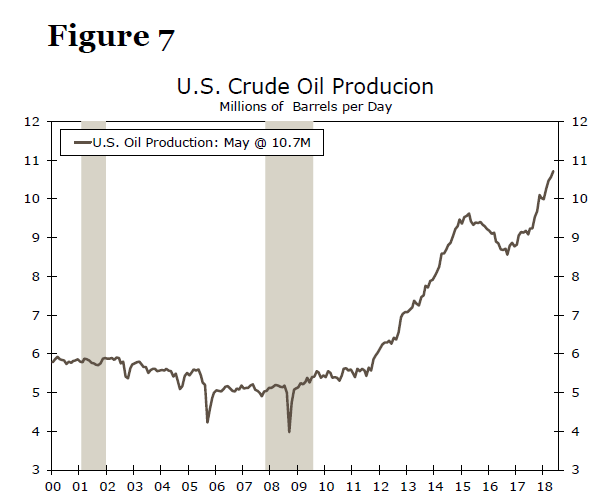
The widespread application of hydraulic fracturing (fracking) technology over the past decade hasbeen a game changer in terms of American petroleum exports. U.S. oil production has more or lessdoubled over the past five years, and daily production is closing in on 11 million barrels per day(Figure 7). With American oil consumption flat at roughly 20 million barrels per day since the turnof the century, petroleum exports should continue to trend higher provided that U.S. oil production continues to skyrocket, which seems likely.
Conclusion
U.S. exports came into the year with a fair amount of momentum, and recent data has shown that export growth has remained solid thus far in 2018. Continued growth in global economic activity should help to support growth of cyclically-sensitive exports such as transportation equipment, computer & electronic products, and chemicals. The boom in U.S. oil production that is underway should continue to propel exports of crude oil and refined petroleum products higher. Moreover, petroleum probably will continue to make outsized contributions to overall U.S. export growth. The export growth rates of 5 percent that we forecast for the United States for this year and 6 percent for next year should be achievable, provided that something does not go wrong.
But therein lies the rub. We forecast that the global economic expansion should continue for the foreseeable future, but there are numerous shocks that could potentially occur that could cause global economic growth to weaken, thereby leading to slower export growth. Perhaps the most immediate downside risk to our export forecast involves a potential trade war. The Trump administration has announced that it plans to levy tariffs on imports of steel and aluminum products, and affected countries, including Canada, China and members of the European Union, have vowed to respond with their own retaliatory measures. Furthermore, the administration announced on June 15 that it plans to levy a 25 percent tariff on $50 billion worth of Chinese goods. China likely will respond to these additional tariffs with its own measures.
As we have written previously, the "first order" effects of a trade war on the overall U.S. economy should be limited.6 That is, any hit to export growth from a trade war likely would not be big enough to cause a U.S. recession. However, we also highlighted some potential knock-on effects (i.e., slower growth in consumer spending due to stock market volatility, weaker business fixed investment spending) that could compound the "first order" effects. Our base case calls for continued solid growth in American exports, led by robust growth in petroleum exports. We readily acknowledge, however, the downside risk to this sanguine outlook.
Weekly Economic and Financial Commentary: FOMC Signals Four Rate Hikes for 2018
U.S. Review
FOMC Signals Four Rate Hikes for 2018
- The FOMC raised the target federal funds range 25 bps to 1.75-2.00 percent and projected a fourth rate hike this year, while also upgrading its outlook for GDP and inflation.
- The American consumer flexed its muscle in May, as evidenced by robust retail sales. We should see a fairly pronounced rebound in overall consumption in the second quarter GDP print.
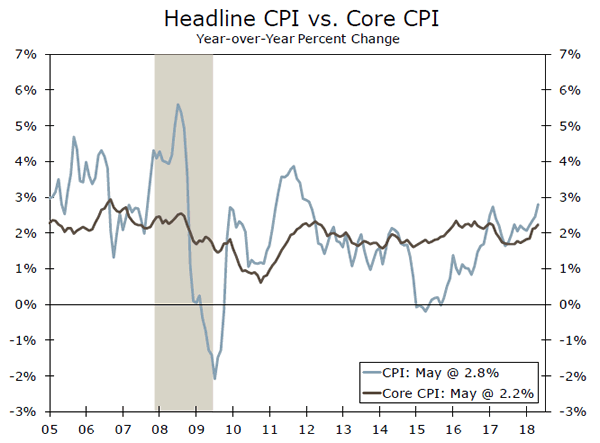
- Inflation-related indicators strengthened in May. Core CPI is running at 2.2 percent–roughly consistent with the Fed's target.
September and December
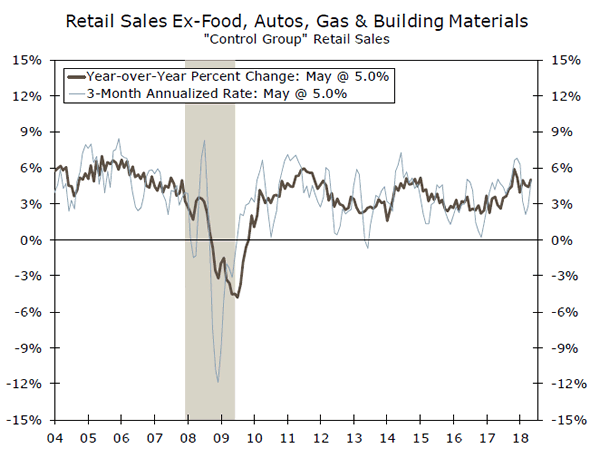
While the FOMC meeting dominated the market headlines this week, several closely watched indicators surprised to the upside, indicating continued strength in the economy. However, perhaps the most surprising economic release this week was the strength seen in the May retail sales report. Headline sales surged 0.8 percent following an upwardly revised 0.4 percent in April. Much of the recent strength in retail sales has been attributed to rising gasoline prices. However, excluding gasoline station sales, sales increased an impressive 0.7 percent. Moreover, the relatively strong print in automobile sales is, perhaps, the realization by American consumers that higher interest rates are an increasingly likely reality and that they should move ahead of higher future interest rates. After a disappointing performance for the U.S. consumer in the first quarter, spending strength has returned in Q2. This is further evidenced by the renewed strength in control group sales, which surprised to the upside again (top graph).
While the strength in retail sales certainly did not go unnoticed, it was overshadowed by the FOMC's June meeting. As markets widely expected, the Fed raised the target federal funds range 25 bps to 1.75-2.00 percent and added a fourth rate hike into its projections for 2018. This implies that it expects to raise the funds rate at the September and December meetings. The more hawkish stance can likely be attributed to the continued tightening we are seeing the labor market. The decline in the unemployment rate below 4 percent signals future upward pressure on inflation, therefore supporting continued fed funds rate increases. However, in the current economic expansion, the decline in the unemployment rate has not been matched by an anticipated increase in measured inflation, that is, until very recently.
Prior to the FOMC's policy meeting on Tuesday, CPI inflation was reported for April and was largely in-line with expectations (middle graph). Consumer price inflation continues to gradually pick up, which adds further support to the Fed's plan to hike rates at its September and December meetings. Higher core inflation continues to be driven by the service sector, and is rising at the fastest pace since January 2017. Likewise, producer price inflation (PPI) continues its upward momentum. As pipeline pressures have picked up in May, input costs for processed and unprocessed goods as well as services have increased more than 3 percent over the past year and suggest further upward pressure on final selling prices in the months to come. Moreover, import prices jumped 0.6 percent in May on the back of higher fuel costs. The unemploymentinflation relationship, which until recently seemed broken, appears to be warming again.
For the FOMC, the way ahead for the funds rate is clear, with steady rate increases through 2020. We remain skeptical of such a smooth plan given the Fed's concurrent operation to shrink its balance sheet. Additionally, we are beginning to see credit strains in mid-to-lower-credit households, such as rising delinquency rates in autos and credit cards, which have the potential to be the wrench in the Fed's machine.
U.S. Outlook
Housing Starts • Tuesday
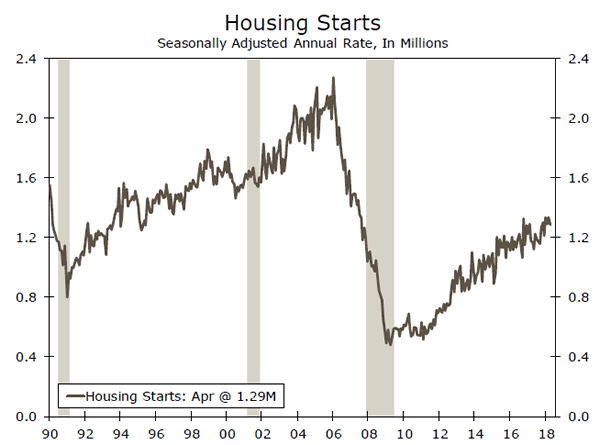
Housing starts slipped 3.7 percent in April as multifamily building halted. Multifamily accounted for all of the drop, as single-family starts edged higher. Single-family starts through the first four months of the year are running 8.3 percent ahead of last year, which shows the housing market is on solid footing despite month-to-month swings. Some of the recent volatility can be traced to extreme weather in the Midwest and Northeast, as well as the topping out of apartment construction, as deliveries in many markets have pushed up vacancy rates. Demand for single-family housing continues to climb, with the strong labor market fueling income gains. Supply of existing homes is limited, making new single-family building more crucial. Continued optimism among the nation's homebuilders suggests a solid spring home selling season despite disappointing headline readings in recent months.
Previous: 1.29M Wells Fargo: 1.30M Consensus: 1.32M (SAAR)
Existing Home Sales • Wednesday
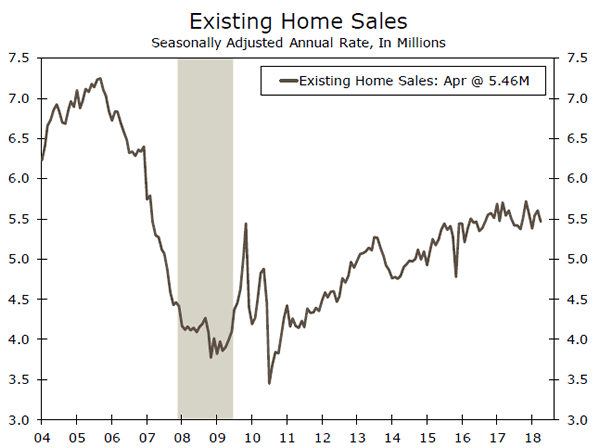
Existing home sales slipped 2.5 percent in April to a 5.46-milllion unit annual pace, after rising the prior two months. The weakness was in single-family sales, which were down 3 percent on the month. Inventory constraints are clearly holding back the resales market and the associated economic activity sales provide.
Evidence that buyer demand is not the problem is that homes are selling quickly and at increasing prices. The typical home sold in April was on the market for only 26 days. Contributing to the competition between buyers for newly listed homes is the strong job market putting homeownership within reach for more Americans. Home prices are rising faster than income in many areas, however, challenging affordability. Borrowing costs are set to increase as the Fed normalizes policy, and higher mortgage rates are likely to exacerbate affordability challenges as borrowers pay a larger share of their incomes towards interest.
Previous: 5.46M Wells Fargo: 5.57M Consensus: 5.58M (SAAR)
Leading Index • Thursday
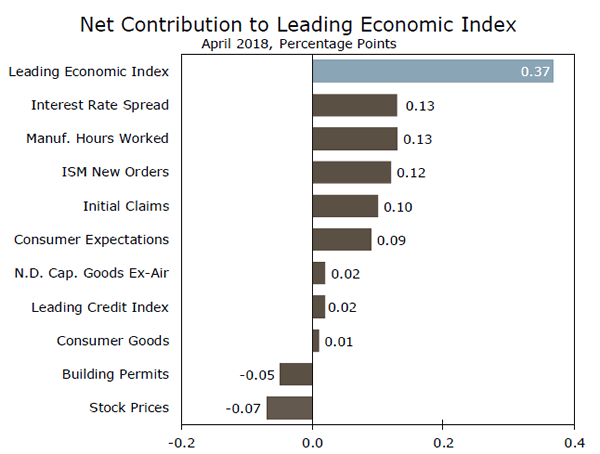
The Conference Board's measure of leading economic indicators is signaling continued growth in the U.S. on broad-based strength. The Leading Economic Index increased 0.4 percent in April and, although the six-month growth rate has moderated, the uptrend in economic growth should continue through the second half of the year.
Building permits and stock prices were the only drag on the index in April and the interest rate spread remained the top contributor to growth. Its strength has waned somewhat, however, on the recent flattening in the yield curve. Labor market components added to April's growth after exerting a drag in March. Initial claims will likely boost the leading index in May as claims hit an all-time low during the month. Still, the May print will likely continue pointing to well balanced, steady economic growth through 2018.
Previous: 0.4% Wells Fargo: 0.2% Consensus: 0.4% (Month-over-Month)
Global Review
Eventful Week for Foreign Economic Developments
- At its policy meeting this week, the ECB announced an end to its quantitative easing program, while starting that it intends to keep rates on hold through summer 2019.
- Chinese economic data in May were generally softer than expected and they point to further deceleration in the Chinese economy.
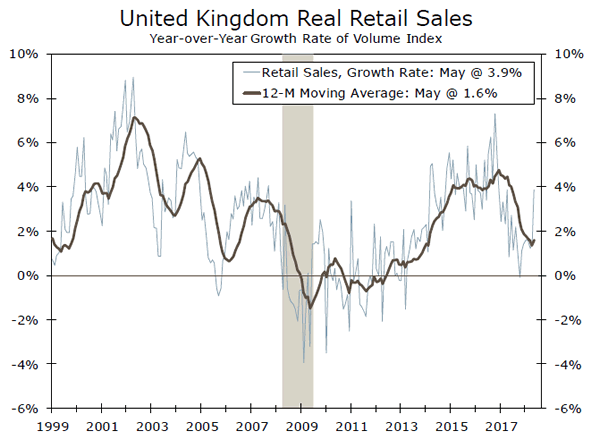
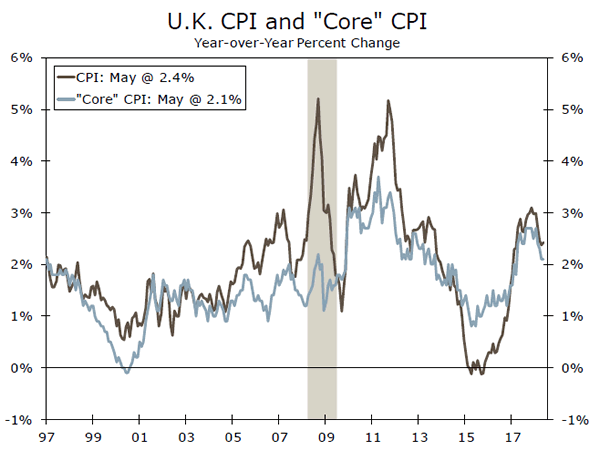
- U.K. industrial production tumbled in May, but retail spending was much stronger than expected during the month. The decline in inflation that has occurred since the beginning of the year has boosted growth in real income, thereby supporting stronger growth in real retail sales.
ECB QE Program To End at End of the Year
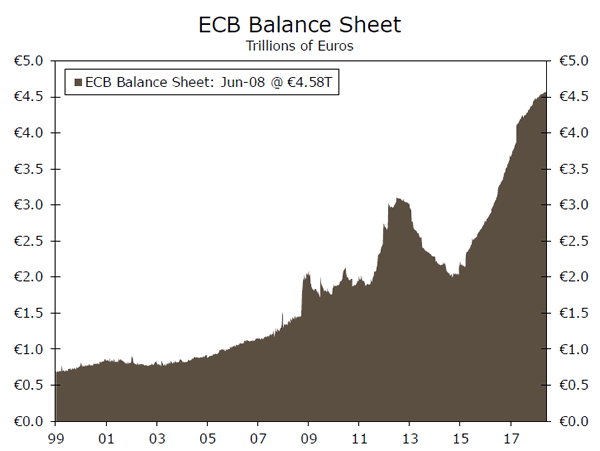
This was a fairly eventful week in terms of foreign economic developments. First, the ECB held a highly anticipated policy meeting on Thursday. The ECB, which has been "tapering" its quantitative easing program for more than a year, announced that it would pare back its monthly purchase rate to just €15 billion, and that it would cease buying bonds altogether at the end of the year (see graph on front page). It also said that it intends to keep its three main policy rates unchanged through at least summer 2019. To learn what tweaks we have made to our interest rate forecast, see "ECB: Making Plans to Dial Back Policy Accommodation."
Furthering Signs of Economic Deceleration in China
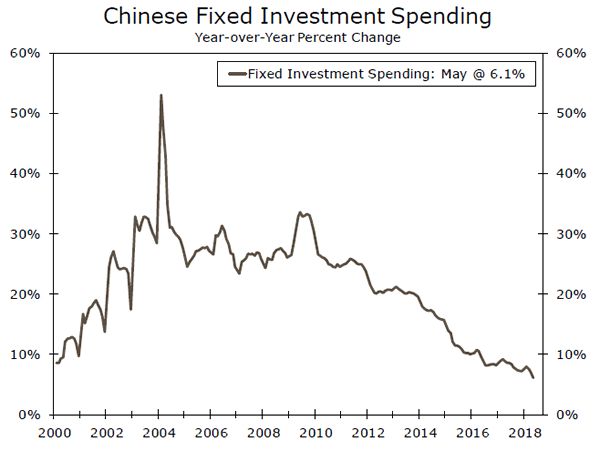
China released a slew of economic data for May that generally were not as strong as most analysts had expected. Retail sales were up just 8.5 percent, the slowest year-over-year rate of growth in 15 years, and growth in industrial production slowed to 6.8 percent in May from 7.0 percent in April. Furthermore, fixed investment spending, which has largely been behind the economic slowdown that has been underway in China for the past few years, was up only 6.1 percent in May, which is the slowest rate in at least 18 years. The data reinforce our belief that the rate of economic growth in China will gradually slow further through the end of next year, when our current forecast ends.
Decline in U.K. Inflation Boosts Real Retail Spending
Economic data in the United Kingdom were somewhat of a mixed bag. Industrial production tumbled 0.8 percent in May relative to the previous month, which was significantly weaker than expected, as output in the manufacturing and utilities sector posted large losses. On the other hand, real retail spending jumped 1.3 percent in May relative to April, which was much stronger than expected, and the unemployment rate held steady at a 43-year low of 4.2 percent.
Growth in real retail spending has been slowing for nearly two years due, at least in part, to the sharp rise in inflation that eroded growth in real income (middle chart). We do not want to read too much into one data point, but the strength in retail sales in May gives us some confidence that our forecast of stronger growth in consumer spending in the quarters ahead may come to pass. The overall rate of CPI inflation peaked at roughly 3 percent late last year, and it has subsequently receded to 2.4 percent. The core rate of inflation has declined to 2.1 percent. This decline in inflation in the U.K. has given a boost to real income growth, thereby supporting stronger growth in consumer spending.
The recent decline in inflation means that the Bank of England may continue to be circumspect regarding another rate hike. Moreover, the uncertainty regarding Brexit, which clouds the economic outlook, also argues for caution. However, with the unemployment rate at only 4.2 percent and with policy arguably still quite accommodative, we believe that most members of the Monetary Policy Committee (MPC) would like to gradually return policy to more "normal" settings. Consequently, we still look for the MPC to hike rates 25 bps at its August policy meeting.
Global Outlook
Bank of England Meeting • Thursday
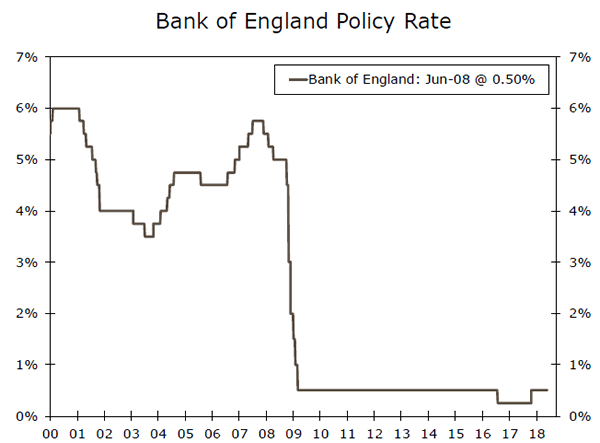
After the Fed, European Central Bank and Bank of Japan shared the stage this week, the Bank of England (BoE) will have a solo in the limelight this coming Thursday.
At its earlier meeting on May 10, the BoE opted to maintain its policy rate at 0.50 percent after a lackluster first quarter GDP report. The vote was 7-2 at the time, with the dissenting votes citing a preference to go through with a rate hike despite the softening economic data.
There may still be a few dissenting votes when the BOE meets Thursday, but we look for the Monetary Policy Committee to sit tight for now with an eye toward eventually lifting its policy rate. A rate hike probably would not occur until August, after policymakers have had adequate opportunity to take stock of the incoming data over the next few months.
Previous: 0.50% Wells Fargo: 0.50% Consensus: 0.50%
Japanese CPI • Friday
A day after the ECB provided guidance on its plan to exit quantitative easing by the end of the year, the Bank of Japan announced its intention to maintain its comprehensive package of asset purchases and yield curve control.
While it is not a new development that Japan is maintaining its accommodative policy even as other central banks are talking about normalization, the divergence is becoming more pronounced as plans become actions for other central banks.
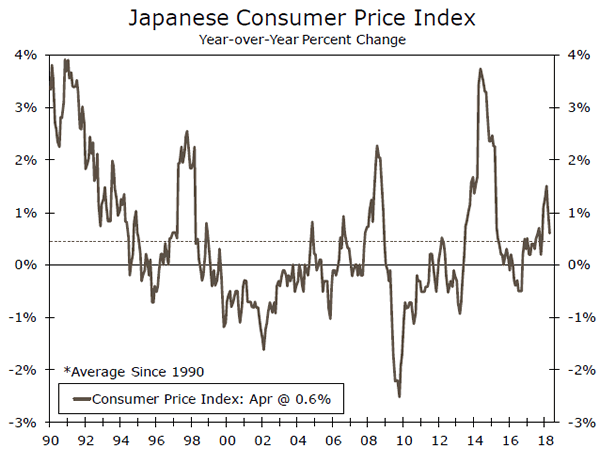
The primary objective for the Bank of Japan is to achieve 2 percent CPI inflation. Friday will bring the May report for CPI inflation in Japan. After coming in at 0.6 percent in April, we are looking for the same rate of year-over-year inflation for May.
Previous: 0.6% Wells Fargo: 0.6% Consensus: 0.6% (Year-over-Year)
Canadian CPI • Friday
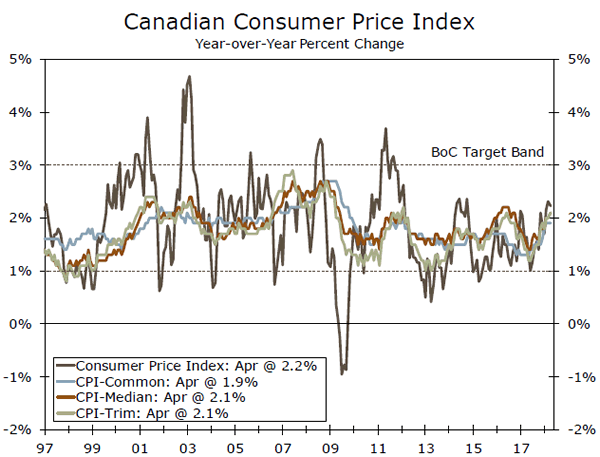
The May 30 statement from the Bank of Canada (BoC) adopted a moderately more hawkish stance, and potentially signals a faster pace of rate hikes ahead than previously anticipated. However, longstanding concerns about high levels of household debt and unsustainable levels of residential investment are still a concern.
The BoC aims to keep CPI inflation at the midpoint of an acceptable range of 1 to 3 percent and it also considers multiple versions of "core" inflation to give policymakers a variety of gages to consider pricing dynamics. The next batch of inflation numbers for the month of May are due out on Friday. By just about any reckoning, these measures are giving the BoC the "all-clear" to raise rates at its July 11 meeting. In fact, if our forecast for 2.6 percent is right, it will mark the fastest pace of inflation in Canada in more than six years.
Previous: 2.2% Wells Fargo: 2.6% Consensus: 2.6% (Year-over-Year)
Point of View
Interest Rate Watch
Benchmarking Rate Risks
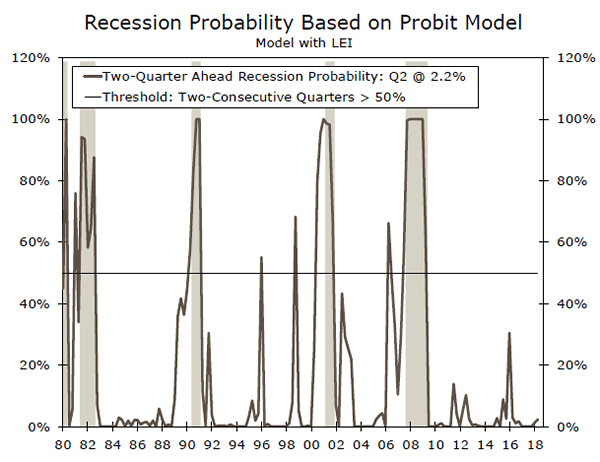
Will the rate increases by the Fed break the financial market and economic upswing? We will track three benchmarks to assess the evolution of this story. For now, even with the funds rate increase this week, the real (after-inflation) funds rate remains near zero. We consider that the FOMC rate increases for this year will not generate a higher recession risk this year. However, by mid-2019 the story could change.
Old Reliable: Probit Recession Model
Regular readers will recognize our recession model graph output in the top graph. Currently, the probability of recession remains very low at only 2.23 percent. Spikes in this series have preceded each of the recessions beginning in 1979. Our model has accurately predicted all recessions since 1980 when using two consecutive quarters above a 50 percent probability of recession as a threshold. Given the strength in the purchasing manager surveys, we do not anticipate any spike upward in the recession probability.
VIX: Financial Developments
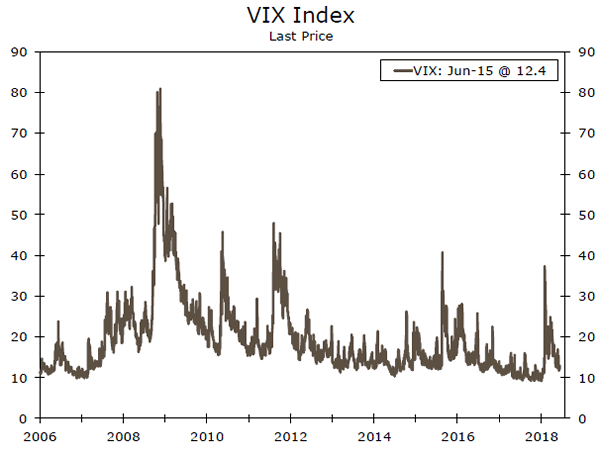
For monetary policy, the third leg of the monetary policy stool is the oft overlooked financial stability—here we assess the sensitivity of financial markets to the Fed by following the VIX (middle graph). For now, the VIX does not signal any tension in the financial markets approaching the peak associated with the 2007-2009 recession.
Emerging Market Tensions
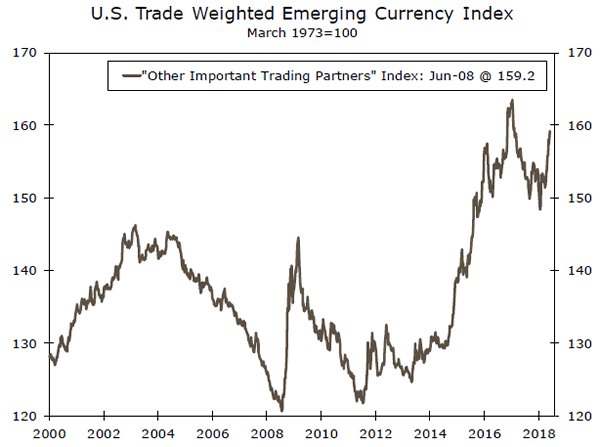
Since mid-2015, we have also witnessed that those changes in expected future interest rates in the U.S.—based upon forward guidance from the Federal Reserve—have had a significant impact on expected future global growth and capital flows. Higher interest rates in the U.S. are likely to give rise to weaker capital flows into other countries, especially emerging markets, and thereby lead to a depreciation of their currencies (bottom graph) and the ability of select countries to finance their current account deficits and U.S. dollar denominated debt. The higher emerging market currency index is interpreted as a stronger dollar against a basket of emerging market currencies. Markets are interrelated –financial, currencies and real growth.
Credit Market Insights
Pass-Through of the Fed Funds Rate
The Federal Reserve has hiked interest rates seven times now since 2015, bringing the federal funds target rate up 125 bps. However, there is not a one-for-one passthrough of bank borrowing costs to rates charged on consumer loans. The impact of higher (or lower) benchmark rates on consumers' decisions to spend or save depends on the extent of this pass-through.
An analysis by the Federal Reserve Bank of Kansas City using data from 2000 to 2013 found that dispersions between rates in the primary and secondary market are more likely to increase when market rates are low. Lenders use their pricing power to not pass on the full extent of the decline in market rates to their customers. However, lenders more quickly pass on changes in rates when market rates are increasing.
Compared to November 2015, before the current tightening cycle began, the average rate on a 30-year fixed mortgage has risen 54 bps while the average 48-month new auto loan rate has risen 94 bps.
These increases are less than the increase in the federal funds rate over the same period. However, rates on mortgage loans and auto loans are tied more to longer-term rates. Therefore, a better comparison would be the 30-year and 5-year Treasury yields, which have increased 5 and 105 bps, respectively. Regardless, while interest rates are rising for consumers, they are not rising as quickly as the federal funds rate.
Topic of the Week
Canada-U.S. Trade Relations
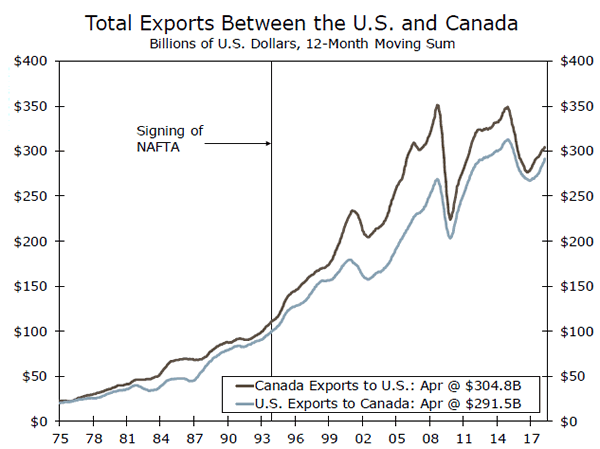
Tensions between Canada and the United States came to a head this weekend at the conclusion of the G7 Summit in Quebec. Following a press conference where Canadian Prime Minister Trudeau said that he would respond in kind to new U.S. tariffs on Canadian goods, Trump declined to sign the G7 Communique and complained publically about the trade imbalance with Canada. Here, we briefly examine trade between United States and Canada, and its role in the economies of both countries.
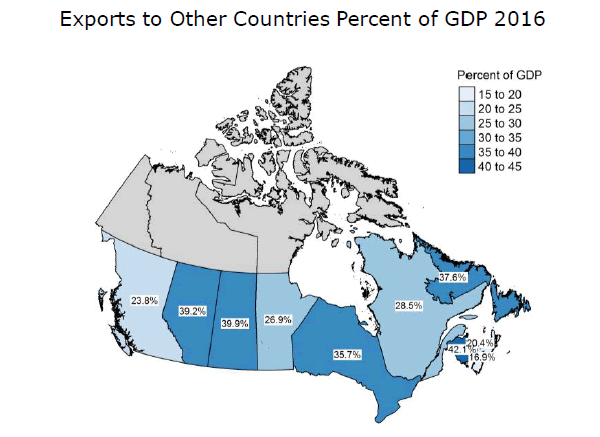
Canada sends three-quarters of its goods exports to the United States. Canada has worked to diversify its export partners over the past two decades, and is sending more goods to Asia in particular. This is a slow process, however. Given that exports make up about one-third of Canadian gross domestic product (GDP), maintaining a good trading relationship with other countries, especially the United States, is vital to growth.
The importance of exports varies by Canadian province, with the export share of GDP ranging from 17 percent to 42 percent (bottom chart). In addition, the makeup of exports by commodity type differs widely. For instance, energy makes up 70 percent of goods exported from Alberta, while motor vehicles and parts comprise almost 40 percent of Ontario's goods exports. This makes certain regions more vulnerable to trade shocks.
While Canada certainly depends on the United States as a major customer for its products, the flip side is also true. Canada is the second-largest trading partner of the United States, falling from first place in 2015 only because of increased imports to the U.S. from China. Canada remains the largest export destination for U.S. goods and services, and has held this position since at least 1987. In addition to its importance nationally, Canada was the largest purchaser of exports for 36 individual U.S. states in 2017.
The moral here is that both countries benefit from trade with each other, and have much to lose in the event of a breakdown in the trade relationship. For more information, please see the replay of our recent Canada and U.S. Economic Outlook Webcast.
The Weekly Bottom Line: Fed Raises Rate As Trade Risks Escalate
U.S. Highlights
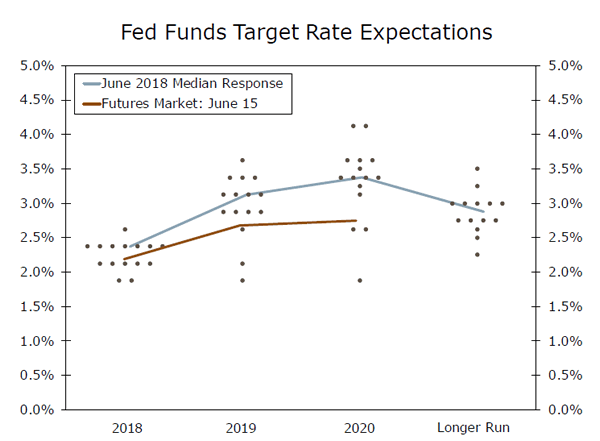
- The FOMC raised the fed funds target rate by 25 bp this week. Additionally, median expectations for the fed funds target rose to 2.4% (from 2.1%), suggesting that the committee was leaning toward two more rate hikes this year.
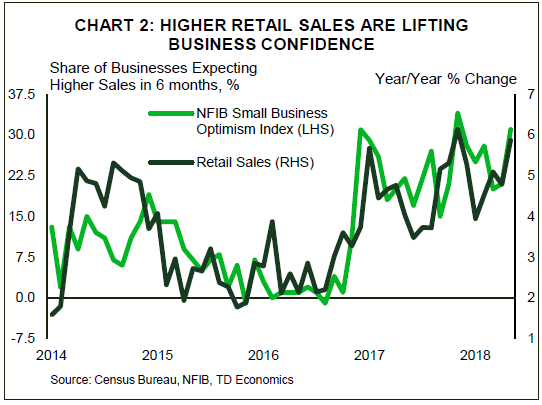
- Data corroborated the Fed's hawkish view of the domestic economy and faster removal of monetary accommodation. The headline and core consumer price indexes rose by 0.2pp (m/m) apiece to 2.8% (y/y) and 2.2% (y/y), respectively. Additionally, retail sales surged by 0.8% in May and small businesses expressed increased confidence in the outlook.
- While things are honky-dory for now, the threat of trade wars continues to percolate. This week the administration announced 25% tariffs on $50 billion of goods imported from China, which prompted retaliatory action by China.
Canadian Highlights
- Trade tensions were front and centre in the recent G-7 summit in Quebec, weighing on the loonie by adding an additional layer of uncertainty to an already complicated backdrop and NAFTA negotiations.
- Canadian manufacturing had a weak start to the second quarter, with volumes falling 1.9% month-on-month in April. Fortunately, one-off factors were to blame with a bounce-back likely in the coming months, but the figures will nonetheless weigh on second quarter growth, tracking 2.7% currently.
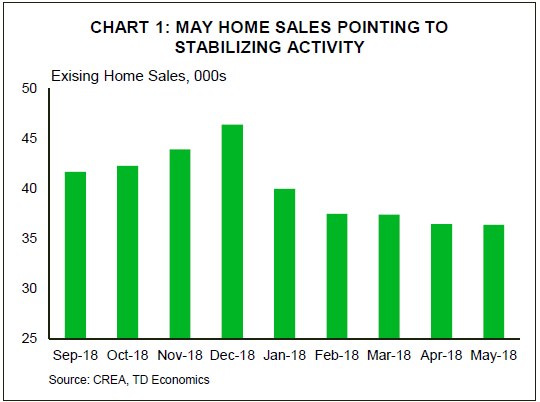
- Housing resale activity stabilized in May after four monthly declines, while prices rose on the month. The better-than-expected report falls in-line with our view that housing markets will stabilize beginning in the second half of the year.
U.S. - Fed Raises Rate As Trade Risks Escalate
This was a busy week for soccer fans and investors alike. The former got treated to a kickoff of a month-long FIFA World Cup extravaganza in Russia, while the latter had a full docket of policy decisions from the Fed and the European Central Bank, as well as readings on inflation and retail sales and to close off the week an announcement of 25% tariffs on $50 billion of goods imported from China.
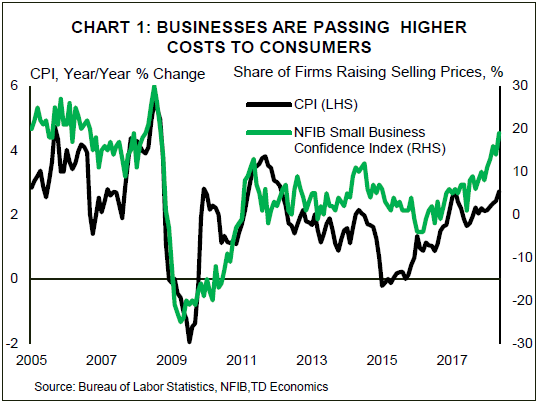
Tuesday's inflation report got the ball rolling ahead of the FOMC rate announcement. As widely expected, inflation continued to gain traction in May. The headline and core consumer price indexes rose by 0.2pp (m/m) apiece to 2.8% and 2.2% (year over year), respectively. A strong economy, wage pressures and (now) tariffs will continue to push inflation measures higher in the coming months, particularly as businesses become more comfortable with passing higher costs to consumers (see Chart 1).
The Fed's June rate hike looked like a done deal even before the inflation report, and indeed the FOMC raised the federal funds rate target by 25 basis points to a range between 1.75% and 2.0%. Details of the statement and the accompanying economic projections were insightful. Notably, the statement removed its forward guidance that the "federal funds rate is likely to remain, for some time, below levels that are expected to prevail in the longer run." With committee member projections showing the federal funds rate rising above its anticipated "longer run" rate by 2019, this made sense. The Fed's increased confidence in its rate hiking path was also illustrated in an edging up of the median expectation for the fed funds rate to 2.4% (from 2.1%) this year, implying two more rate hikes this year (one more than previously). During the press conference, Chairmen Powell also said that starting next year he will be holding a press conference following every FOMC meeting, a move likely aimed at freeing up Fed's hands somewhat with respect to future rate changes.
The Fed's view that economic growth is revving up was corroborated Thursday's retail sales report. Spurred by tax cuts, job gains and rising incomes, American consumers have been on a tear for the last three months, and in May retail sales surged by 0.8% – double the expectations and the biggest jump in half a year. Helped along by a pickup in consumer spending, GDP growth is currently expected to surpass 4% (annualized) in the second quarter, and average 3% for the year as whole – the best result since 2005.
While the U.S. economy may be sizzling, there are risks on the horizon. As with tariffs on steel and aluminum, the recent tariff announcement on Chinese goods sparked a retaliatory action by China. Taken alone these tariffs are likely to present a modest drag on U.S. growth and modest lift to inflation (please see our recent report on U.S.-China tariffs). However, while direct impacts are modest, the hit to business confidence and supply chain disruptions could result in a more deleterious effect on growth, So far, financial markets have taken these skirmishes in stride, but a further escalation or full out trade war could bring this assumption into question.
Canada - Housing and Trade are the Economy's Weakest Links
The recently imposed steel and aluminum tariffs by the U.S. government on its closest international allies have ignited a fresh bout of anxiety amongst world leaders, making for a mood that was anything but calm at the G-7 summit this past weekend. The meetings were dominated by trade issues, and the disagreement between the U.S. and other wealthy nations was laid bare by the fact that President Trump failed to endorse the joint meeting communique which concentrated on benefits that "free" and "fair" trade would bring. The event was not staid, with Prime Minister Trudeau calling the steel and aluminum tariffs "insulting" in a post-event conference, angering President Trump who then went on to insult the Prime Minister while toughening his trade stance. The events weighed on the loonie, adding an additional layer of uncertainty to an already complicated environment for trade. The global trade backdrop turned more sour this morning, with the U.S. government announcing some $50 billion in tariffs on Chinese exports. The additional uncertainty helped send oil prices sharply lower and weighed on equities.
The uncertain trade backdrop will not help Canada's manufacturers, who already had a tough start to the second quarter. Volumes dropped by 1.9% in April, on weakness in both durables and nondurables. with the only silver-lining coming from the fact that it was related to one-off factors, offering hope for a bounce-back later in the quarter. The tough start to the quarter for manufacturers also caused us to pare back our expectations for second quarter activity, with GDP now likely to expand closer to the midpoint than the higher end of the 2% - 3% range, as previously anticipated.
Housing also took centre stage this week. Data on resale markets indicated unchanged activity in May (Chart 1) – the best performance so far this year. Other parts of the report were equally encouraging, with new listings rising for the 3rd time in 4 months and average prices ticking higher. Prices increased in the closely watched Vancouver and Toronto markets, with activity stable in the former and beginning to recover in the latter. Ultimately, the figures are consistent with our forecast of stabilization through mid-year and gradual recovery thereafter, supported by a relatively firm economic backdrop.
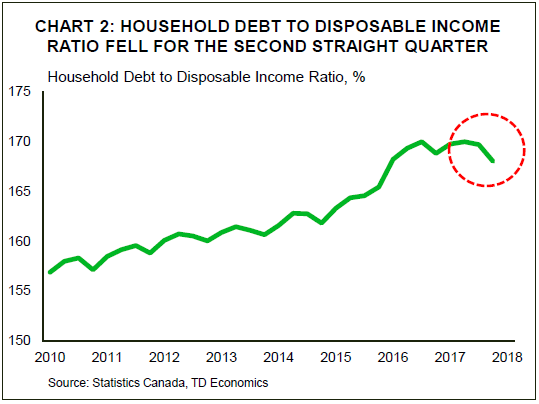
While they appear to have stabilized, existing home sales remain some 21% below December 2017 levels. Although the weaker resale activity has been a drag on economic growth, the Bank of Canada is likely to take solace in the fact that mortgage credit and overall household debt accumulation has moderated. National Balance Sheet Accounts for the first quarter indicated that mortgage borrowing dropped to its lowest level since 2014. Alongside rising incomes, this helped drive household debt-to-income ratio lower for the second quarter in a row. The share fell to 168% (Chart 2) with the moderating trend likely to be viewed as constructive by policymakers concerned about household debt loads.
Canada: Upcoming Key Economic Releases
Canadian Consumer Price Index - May
Release Date: June 22, 2018
Previous: 0.3% m/m nsa, 2.2% y/y
TD Forecast: 0.4% m/m nsa, 2.6% y/y
Consensus: 0.4% m/m nsa, 2.6% y/y
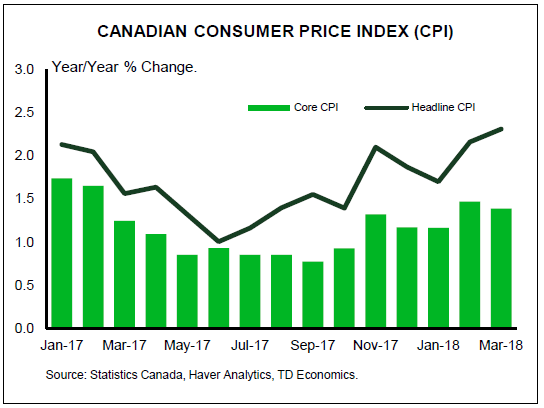
We expect headline CPI to rise to 2.6% y/y, reflecting a 0.4% m/m gain (0.3% seasonally adjusted). Gasoline prices will again be a boost, with retail prices at the pump up roughly 4% in May. A weaker CAD and the ongoing adjustment to minimum wage hikes also points to moderate gains in food prices.
Outside of food and energy, we expect subdued gains with continued mixed performance across categories. Importantly, the housing component of shelter (16.5% of CPI) is likely running at its peak as signaled by the sharp deceleration in new home prices. This is less of an upward pull from shelter costs going forward. In this report, we expect to see the gap between exclusion-based core indexes (CPIX and CPIXFE) and BoC core measures to close further, with the latter stabilizing at 2.0% and the former moving marginally higher. Looking ahead, CPI is likely running near its peak, holding at 2.6% y/y in June and decelerating gradually toward 2% through year end.
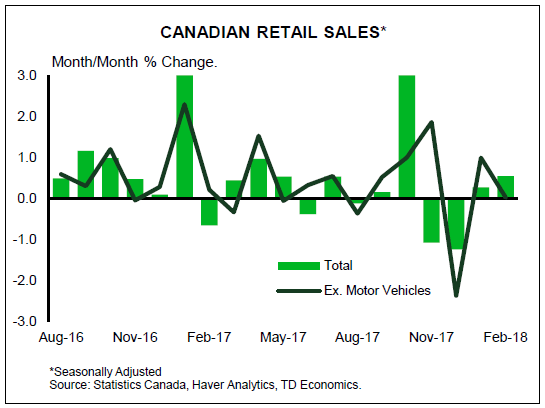
Canadian Retail Sales - April
Release Date: June 22, 2018
Previous: 0.6%, ex-auto: -0.2%
TD Forecast: -0.2%, ex-auto: 0.3%
Consensus: 0.0%, ex-auto: 0.7%
TD looks for retail sales to dip 0.2% in April on a pullback in motor vehicles. Retail auto sales have risen by 5% since November despite a significant slowdown in the housing market, and a further deceleration in credit growth suggests some giveback is likely in April. Ex-auto sales should post a modest advance on the strength of gasoline prices, which rose by 6.8% m/m and will provide a tailwind to sales at the pump. However this will be offset by the impact of severe weather which will weigh on building materials. Real retail sales should land near the nominal print given the muted increase in seasonally adjusted consumer prices. While this will start the second quarter on a soft note, the 0.9% handoff from March will help to anchor Q2 spending.