
Sample Category Title
Yen Finds Some Relief from Inflation Data, But Struggles to Rebound
The overall mood in the forex markets remains one of indecision, with major currencies largely range-bound. Yen is attempting a mild rebound after Tokyo's CPI figures came in stronger than expected, with core-core inflation rising to 2.2% yoy. However, the Japanese currency is still the worst performer of the week, reflecting the broader uncertainty over BoJ’s next move.
Domestically, the sharp surge in rice prices—up 92.4% yoy—will likely be dismissed by BoJ as a temporary shock stemming from supply issues. What will matter more for policy direction is whether the uptick in rents and service-sector inflation, driven by rising wages, proves to be more persistent.
At the same time, BoJ Summary of Opinions revealed a clear concern among board members over downside risks from US tariffs and global economic instability. Even though BoJ remains on a path toward further rate hikes, the timing of the next move is now more uncertain. The central bank may opt to delay any action to better assess the economic fallout from global trade policies.
This cautious stance is mirrored in Fed’s approach as well, with US policymakers signaling patience amid what they describe as a “dense fog” of uncertainty. Tariffs, inflation expectations, and murky consumer sentiment are all contributing to a wait-and-see. While markets still lean toward a June rate cut, the messaging from the Fed increasingly suggests a higher bar for near-term easing.
Paradoxically, should Fed proceed with a rate cut in June, it could spook markets rather than calm them. A cut might be interpreted not as proactive easing, but as a reaction to more serious underlying weakness in the economy.
For the week, Canadian Dollar has outperformed. Australian Dollar follows, lifted by strong commodity performance, while Sterling finds support despite softer UK CPI. Meanwhile, Yen remains the weakest, followed by Kiwi and Euro. Dollar and Swiss Franc treading water in the middle of the pack.
Technically, Gold continues to command attention as its record-breaking rally persists. The precious metal seems to be ignoring what should be formidable resistance at its medium-term rising channel.
On the downside, break below 3012.37 should indicate a near-term rejection and signal the start of a corrective pullback toward the 2832.31/2956.09 support zone.
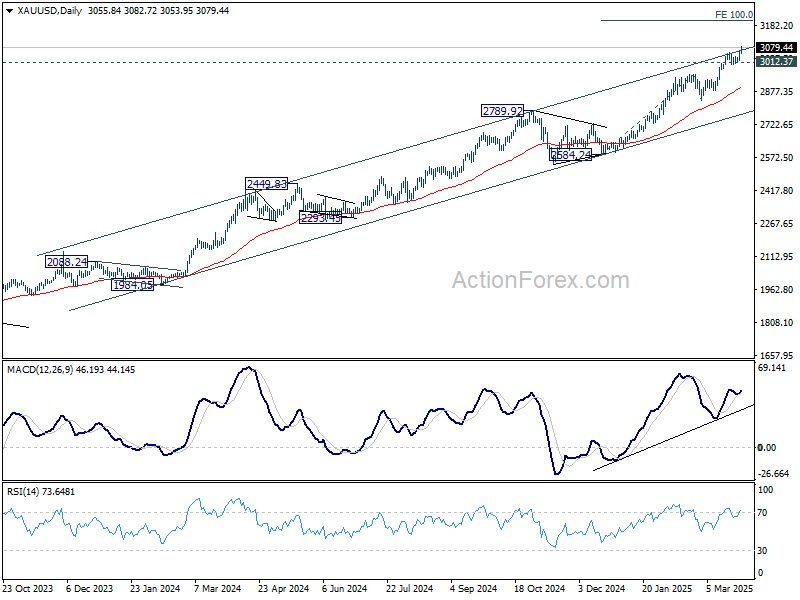
However, sustained trading above the channel could prompt upside acceleration for the medium term. Next target will be 100% projection of 2584.24 to 2956.09 from 2832.41 at 3204.26
In Asia, at the time of writing, Nikkei is down -2.09%. Hong Kong HSI is down -0.87%. China Shanghai SSE is down -0.54%. Singapore Strait Times is down -0.087%. Japan 10-year JGB yield is down -0.044 at 1.547. Overnight, DOW fell -0.37%. S&P 500 fell -0.33%. NASDAQ fell -0.53%. 10-year yield rose 0.031 to 4.369.
Tokyo CPI core rises to 2.4%, driven by soaring food and rent prices
In Japan, Tokyo’s CPI core, which excludes fresh food, rose from 2.2% yoy to 2.4% yoy in March, surpassing expectations of 2.2% yoy. Even more notable was the rise in the core, core measure, which strips out both food and energy—climbing from 1.9% yoy to 2.2% yoy, signaling broader-based inflation. Headline inflation also ticked higher to 2.9% yoy from 2.8% yoy.
The key driver behind the spike was food prices, which surged 5.6% yoy, the fastest pace since January 2024. A standout was the massive 92.4% yoy jump in rice prices, the steepest rise since 1976.
Adding to the inflationary pressure was the services sector, where prices rose 0.8% yoy, up from 0.6% yoy in February. Rent prices, a key component, increased by 1.1% yoy, the sharpest rise since 1994.
BoJ opinions highlight tariff risks, but path to further hikes still intact
The Summary of Opinions from BoJ’s March monetary policy meeting revealed growing concerns over the fallout from US trade policy, particularly the risk that new tariffs could negatively impact Japan’s real economy.
One board member warned that downside risks from the US have “rapidly heightened". I f tariff issues worsen, it could have a "negative impact" on Japan's real economy. BoJ should be “particularly cautious” when considering further interest rate hikes if trade tensions escalate.
Other members echoed similar concerns, citing elevated uncertainty from tariff threats, global supply chain disruptions, and stiff competition from low-priced Chinese products.
The tone suggests policymakers are carefully monitoring how these factors affect inflation expectations, wage growth, and investment—particularly among SMEs.
A separate opinion suggested that as underlying CPI inflation edges closer to the 2% target, BoJ should prepare to shift from accommodative to "neutral" policy.
Overall, BoJ still sees a path toward rate normalization—contingent on its inflation outlook materializing—but recent developments in global trade and domestic firm performance will dictate the pace and timing of the next move.
Fed’s Barkin: It's “zero visibility” fog, pull over and turn on your hazards
Richmond Fed President Tom Barkin noted that the fast-moving policies of the new administration, particularly around tariffs, have created a “dense fog” of uncertainty. While acknowledging that recent high inflation could amplify the impact of new tariffs, he noted that the ultimate effect remains unknowable given the lack of clarity on final tariff rates and the responses of global actors.
Barkin warned that this heightened uncertainty is already weighing on sentiment. He explained that for consumers and businesses to spend and invest, "they need to have a certain level of confidence". Without that, demand may quiet, particularly as markets navigate the unknowns tied to policy shifts and geopolitical developments.
“It’s not an everyday ‘forecasting is hard’ type of fog,” he said, but rather one that demands a cautious approach—“a ‘zero visibility, pull over and turn on your hazards’ type of fog.”
In this context, Barkin reiterated that the Fed’s current moderately restrictive stance remains appropriate. “We are waiting for the fog to clear,” he concluded.
Fed’s Collins Advocates "active patience" with interest rates
Boston Fed President Susan Collins expressed her full support for Fed to keep interest rates unchanged last week, noting that continued economic uncertainty and inflation risks warrant a cautious approach.
Collins said that with upside risks to inflation still present, it would likely be appropriate to maintain current policy settings "for a longer time". She stressed the importance of “active patience” and flexibility as Fed monitors the evolving economy.
One of the key factors now clouding the outlook is tariffs. Collins acknowledged that new tariffs will almost certainly raise inflation in the near term. However, the longer-term implications depend heavily on how other countries react and whether businesses pass costs onto consumers. These elements could determine whether the inflationary shock is temporary or more persistent.
Looking ahead
Germany Gfk consumer sentiment and unemployment; UK retail sales, goods trade balance and Q4 GDP final; Swiss KOF will be released in European session. Later in the day, Canada will release monthly GDP. US will release personal income and spending, and PCE inflation.
USD/JPY Daily Outlook
Daily Pivots: (S1) 150.35; (P) 150.75; (R1) 151.45; More...
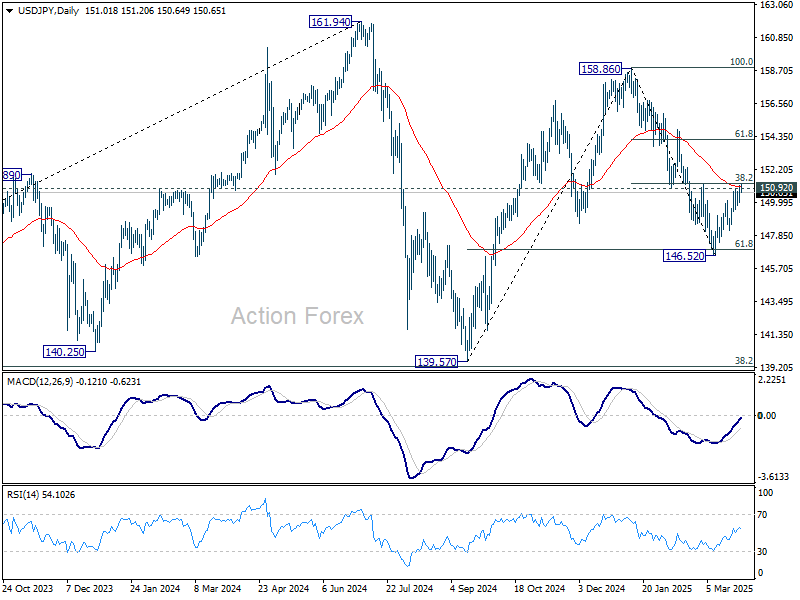
No change in USD/JPY's outlook and intraday bias remains neutral. Strong resistance is still expected from 150.92 to complete the corrective recovery from 146.52. On the downside break of 149.53 support will bring retest of 146.52 first. Sustained trading below 61.8% retracement of 139.57 to 158.86 at 146.32 will resume the fall from 158.86 to 139.57 support. However, firm break of 150.92 will argue that fall from 158.86 has completed and turn bias back to the upside for 154.79 resistance next.
In the bigger picture, price actions from 161.94 are seen as a corrective pattern to rise from 102.58 (2021 low), with fall from 158.86 as the third leg. Strong support should be seen from 38.2% retracement of 102.58 to 161.94 at 139.26 to bring rebound. However, sustained break of 139.26 would open up deeper medium term decline to 61.8% retracement at 125.25.
European Central Bank Easing to Slow as Eurozone Outlook Brightens
Summary
- The Eurozone economy showed a degree of resilience late last year, though some notable policy developments in early 2025 have since had some significant implications for the region's medium-term outlook. The likelihood of higher tariffs of imports from the European Union should restrain Eurozone growth in 2025, and our GDP growth forecast is unchanged at 0.8%. However, landmark fiscal stimulus from Germany has in our view brightened prospects for both Germany and the broader Eurozone, prompting us to raise our 2026 Eurozone GDP growth forecast to 1.6%.
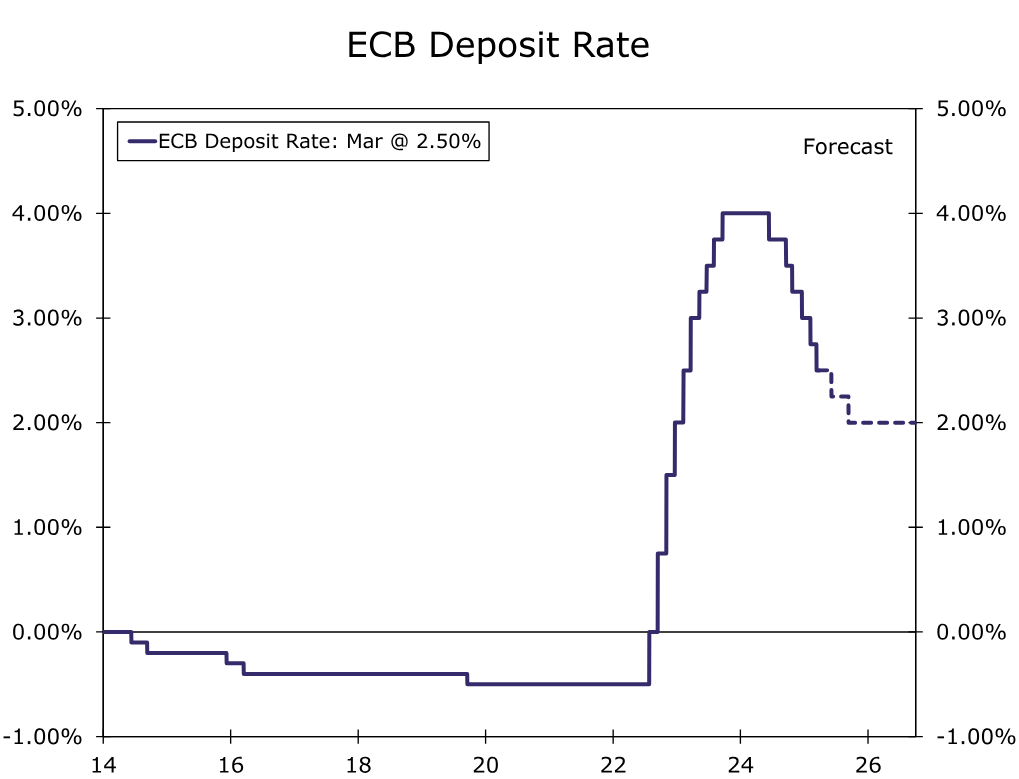
- A brighter and more balanced medium-term outlook for the Eurozone means we also now expect a less dovish monetary policy approach from the European Central Bank (ECB). With downside growth risks lessening, and inflation pressures still easing relatively gradually, we expect even more careful and considered deliberations by ECB policymakers at upcoming meetings. We now forecast 25 bps ECB rates cuts in June and September (that is, every other meeting). That would see the ECB's policy rate reach a low of 2.00% by September, compared to our previous outlook for a policy rate low of 1.75%.
- A firmer medium-term growth outlook and less dovish European Central Bank also has implications for the outlook for the European currency, especially when juxtaposed against our evolving U.S. outlook which sees softer GDP growth in 2025, and slightly faster Fed easing this year. We now expect only a gradual pace of euro depreciation over time, targeting a EUR/USD exchange rate of $1.02 by Q3-2026.
Eurozone's Economic Landscape Evolving, Medium-Term Prospects Brightening
The Eurozone economy showed a degree of resilience late last year, offering some encouragement that the region's recovery could gather further momentum in 2025. In the early part of this year, however, there have been some notable policy developments, with significant implications for the Eurozone outlook. The increasing threat of tariffs from the United States could weigh on growth this year, but the prospect of more expansive fiscal policy in Germany has, in our view, improved the region's medium-term growth outlook. Our forecast for Eurozone GDP growth for 2025 is unchanged at 0.8%, while we have revised our forecast for Eurozone 2026 GDP growth higher to 1.6%.
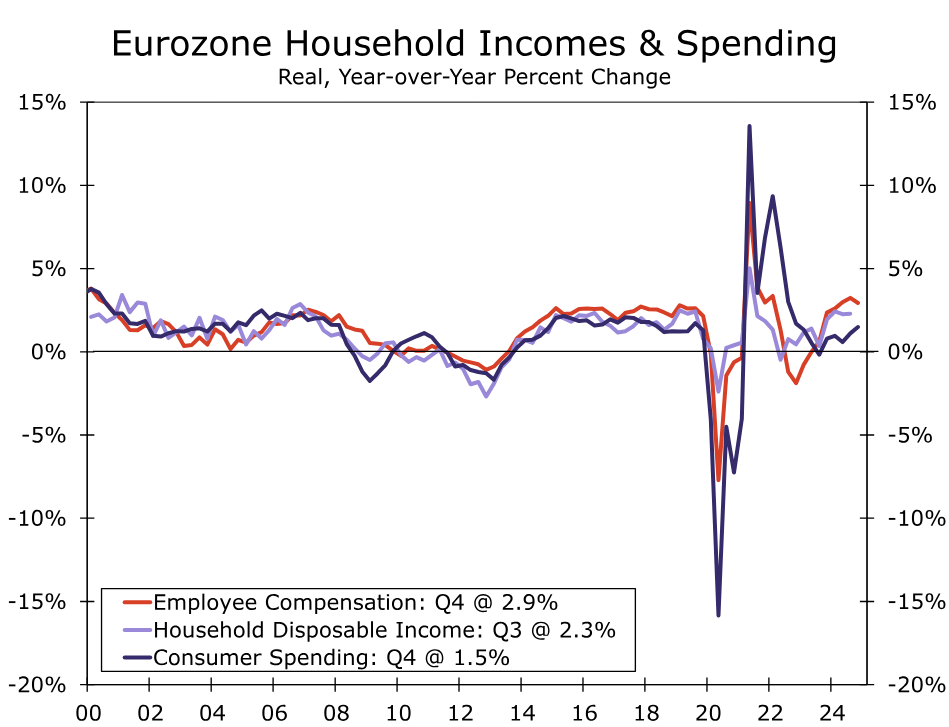
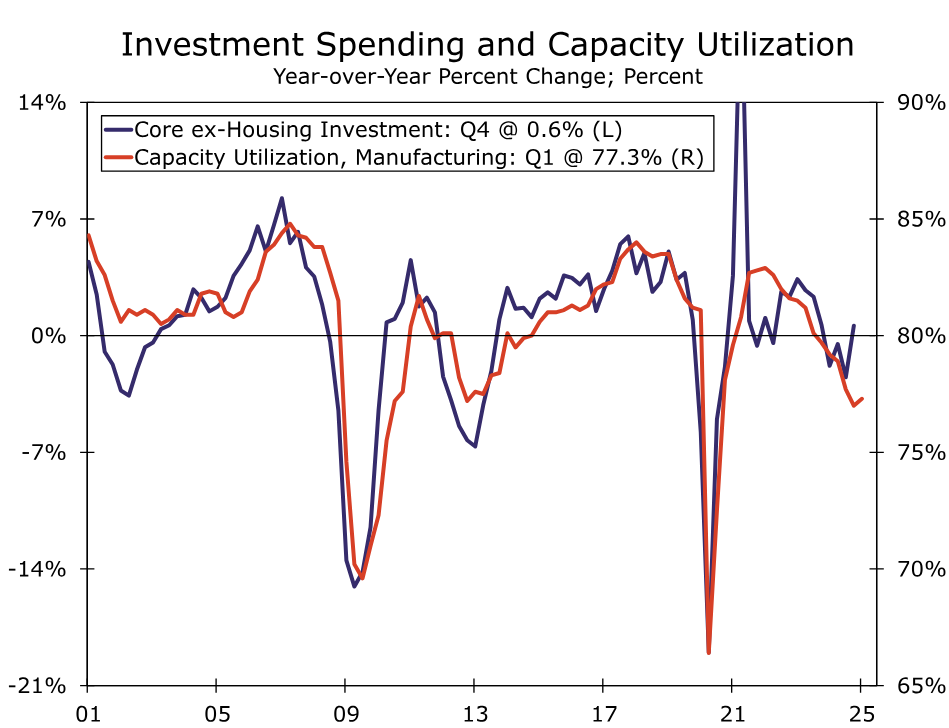
Eurozone GDP rose a moderate 0.2% quarter-over-quarter in Q4-2024 though, with upward revisions to prior quarters, that helped boost growth to 1.4% year-over-year. For the fourth quarter specifically, the expansion in economic activity was quite broad-based, as household consumption rose 0.4% quarter-over-quarter, government consumption also rose 0.4%, and investment spending rose 0.6%. The increase in investment spending was also notable in that it included an increase in core ex-housing investment (that is, excluding the volatile intellectual property products component). For now, growth in employee compensation and household disposable income continues to run ahead of consumer spending, suggesting there remains room for a further modest consumer recovery over the course of this year. The near-term outlook for investment spending is more mixed, however, given softening corporate profits and still-low levels of manufacturing capacity utilization.
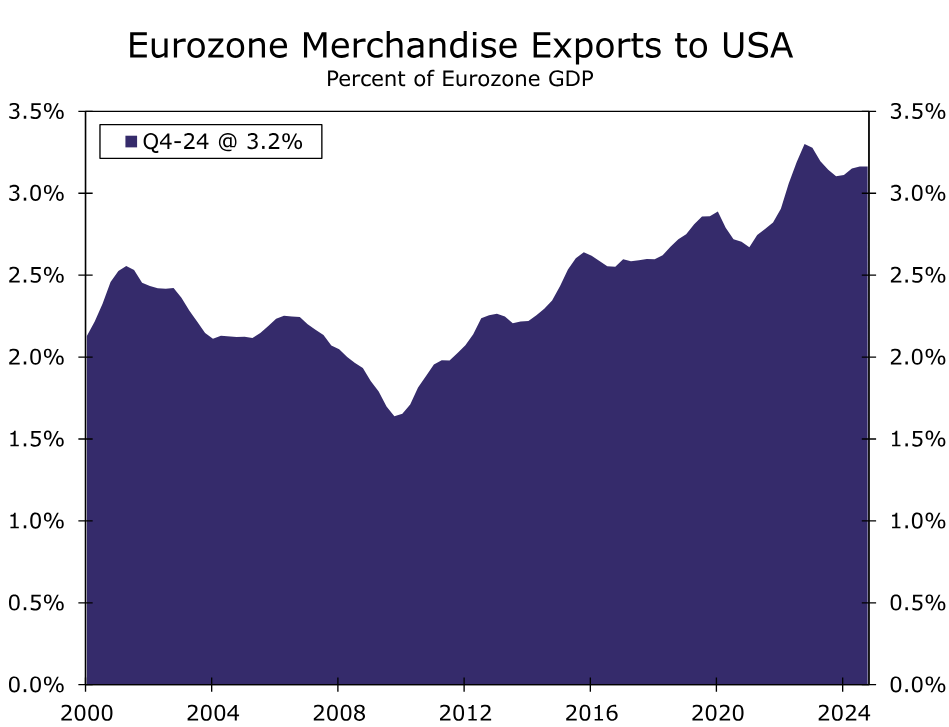
Indeed, the uncertain near-term outlook for investment spending and broader economic activity has been compounded by the growing threat of higher tariffs from the United States. President Trump has often highlighted the large trade imbalance with Europe, as well as some internal taxes within Europe. The latest available figures highlight that trade imbalance, with the Eurozone running a €183 billion merchandise trade surplus with the United States in the 12 months through January. Considering this backdrop, we anticipate the European Union will indeed face higher tariffs from the United States. From Q2-2025 and through the end of our forecast horizon (Q4-2026), we assume a 10% effective tariff rate on goods imported from the European Union, with a similar level of retaliation from Europe on the United States.
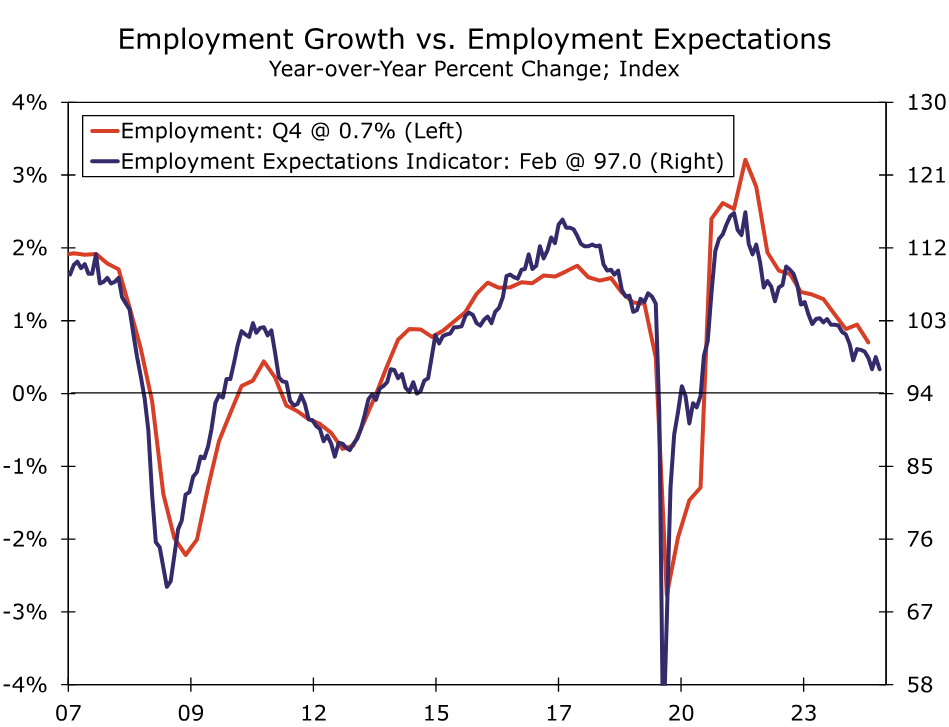
The direct impact of higher tariffs on the Eurozone will, we think, be moderate, with merchandise exports to the United States accounting for a little more than 3% of the region's GDP in 2024. That said, given the increased uncertainty stemming from increased trade and tariff tensions, the indirect effects on activity could be more pronounced. Indeed, there are signs that a more uncertain environment is already weighing on employment and spending decisions. For example, the European Commission Employment Expectations Indicator fell further to 97.0 in March, extending what had been an overall declining trend since early 2022. The further drop in the indicator suggests that employment growth, which was already just a tepid 0.7% year-over-year in Q4, could slow even further this year.
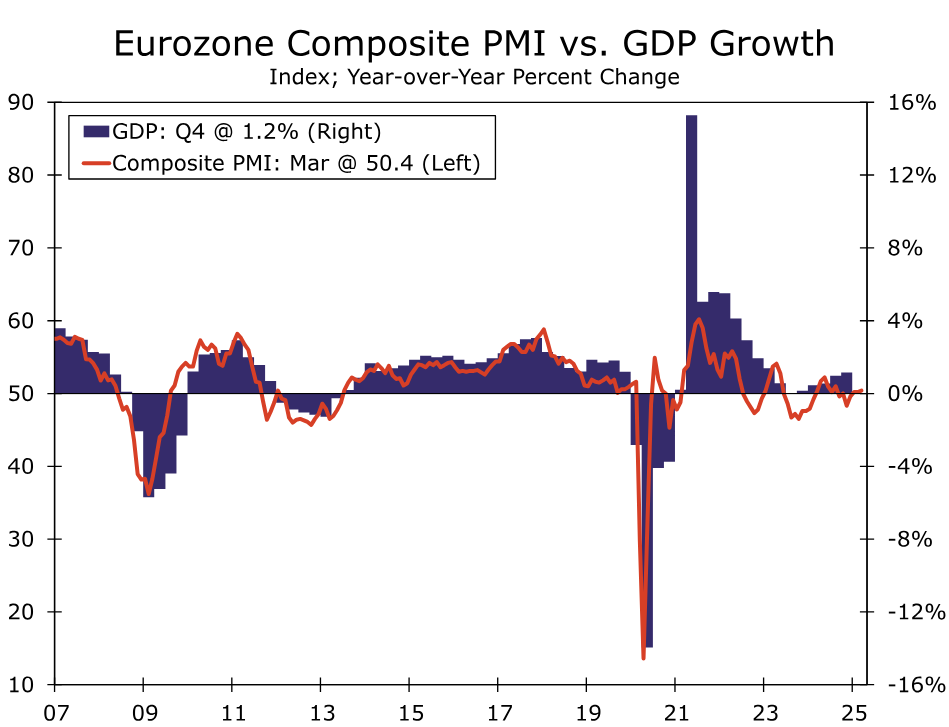
Meanwhile, sentiment surveys are, for now, consistent with only a modest pace of growth. In March, the manufacturing PMI rose to 48.7. While the improvement perhaps reflects increased hopes for spending on infrastructure and defense, a topic we will return to later, the index is nonetheless still at levels historically consistent with a contracting industrial sector. The Eurozone services PMI slipped to 50.4 in March, a third straight decline and suggests the economically significant services sector is struggling to gather any momentum during the early part of 2025. Overall, the composite or economy-wide PMI edged up to 50.4, a level also historically consistent with only modestly positive GDP growth. With some hints of slower employment and investment in early 2025, and considering the downside impact from higher tariffs, we do not envisage a Eurozone growth upswing this year. We forecast Eurozone GDP growth of 0.8% in 2025, broadly similar to the pace of expansion seen last year.
We do, however, believe Eurozone growth prospects for 2026 have improved considerably, primarily reflecting political developments in Germany and a landmark shift in German fiscal policy. Germany has traditionally been the Eurozone's most fiscally cautious economy and, since 2009, has incorporated the “debt brake” as part of the country's constitution. In recent years, debt brake laws have required the federal government to limit its structural budget deficit to no more than 0.35% of GDP and required German states to run balanced budgets except for times of national emergency or recession. However, following the late February election that has changed dramatically. After two years of economic contraction and as geopolitical developments have heightened European security concerns, Germany's Chancellor-in-waiting Friedrich Merz has engineered a remarkable fiscal stimulus despite coalition negotiations that are still in progress. The key elements of Germany's new fiscal measures include:
- Excluding defense spending in excess of 1% of GDP from the constitutional debt restriction. Germany reported to NATO that it spent around €90 billion on defense in 2024, through a combination of its regular budget, the use of special off-budget funds and some additional expenses.
- Allowing Germany's 16 states to borrow as much of 0.35% of their GDP as opposed to being required to run balanced budgets
- Establishing a special off-budget infrastructure fund that will be empowered to borrow as much as €500 billion over 12 years, or just under €42 billion per year. Of that amount, €100 billion will be transferred to the Climate and Transition Fund, while states will receive €100 billion for regional projects.
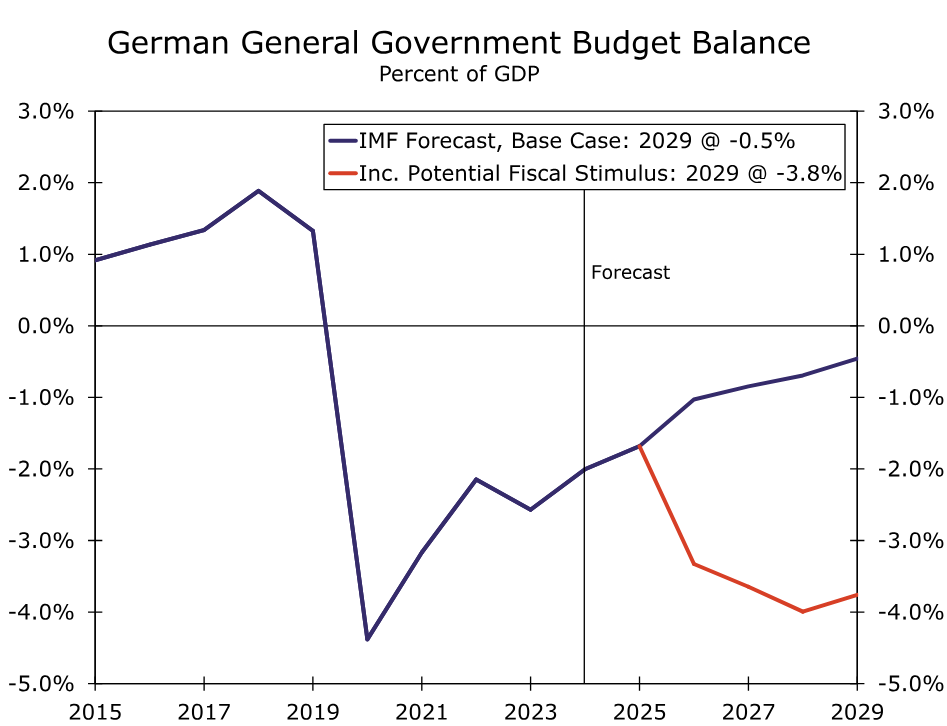
Altogether, the measures could be a momentous change for the German economy, and ultimately (though to a lesser extent) the broader Eurozone economy. To the extent an exemption of defense spending from the debt brake frees up room for spending that previously counted against the deficit limits, it could create potential space for ~1% of GDP for spending in other areas going forward. Should the federal government and states be able to fully utilize the leeway from the constitutional changes, that would equate to fiscal stimulus of 1.35% of GDP, while the infrastructure fund would equate to another 1% of GDP. While increased spending might not ramp up immediately, that suggests potential German fiscal stimulus of around 2.3% of GDP over the next several quarters, a development that should be beneficial for the 2026 growth outlook in particular. Should German defense spending indeed rise, German overall fiscal stimulus could amount to more than 3% of GDP over the next several years. That overall magnitude of German fiscal stimulus is also equates to Eurozone fiscal stimulus of 0.7%-0.9% of Eurozone GDP over the next several quarters to years. Even with higher tariffs, we view more expansive fiscal policy as a net positive for the region's economy, and have lifted our forecast Eurozone GDP growth forecast for 2026 to 1.6%. We also expect fiscal stimulus to kickstart Germany's economy, which has been a significant underperformer within the Eurozone in recent years.
European Central Bank to Shift to a More Gradual Easing Pace
The brighter medium-term outlook for the Eurozone is in our view likely to alter the destination, as well as the path, for the European Central Bank's monetary policy interest rate. For the past several meetings, up to and including its early March announcement, the ECB has been lowering its Deposit Rate at a steady 25-bps-per-meeting cadence. Although core inflation, and more particularly services inflation, have been decelerating at a rather gradual pace, the significant downside risks to the Eurozone economic outlook have given ECB policymakers the motivation, and the comfort, to reduce interest rates at a steady clip. With the Eurozone growth outlook now firmer and more balanced, that could argue for even more careful and considered deliberation by ECB policymakers at upcoming meetings.
One might in fact suggest that ECB policymakers took a small step toward this more cautious approach at their March announcement. In its introductory statement, the ECB, in a change of language, said “monetary policy is becoming meaningfully less restrictive,” while repeating that it will follow a data-dependent and meeting-by-meeting approach to determining the appropriate monetary policy stance. The ECB also repeated that it is not pre-committing to a particular rate path.
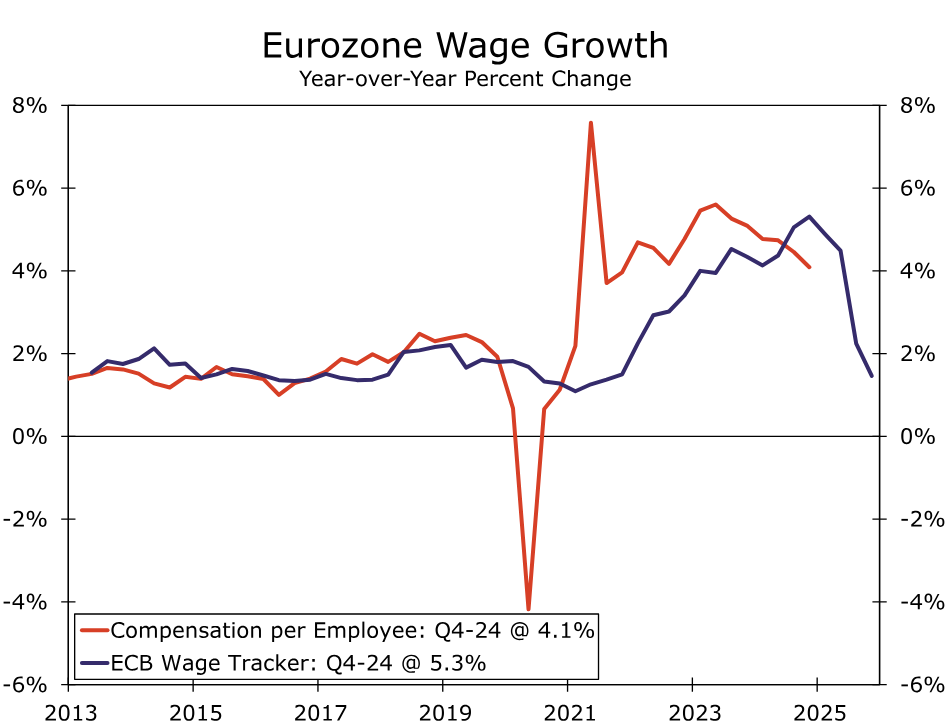
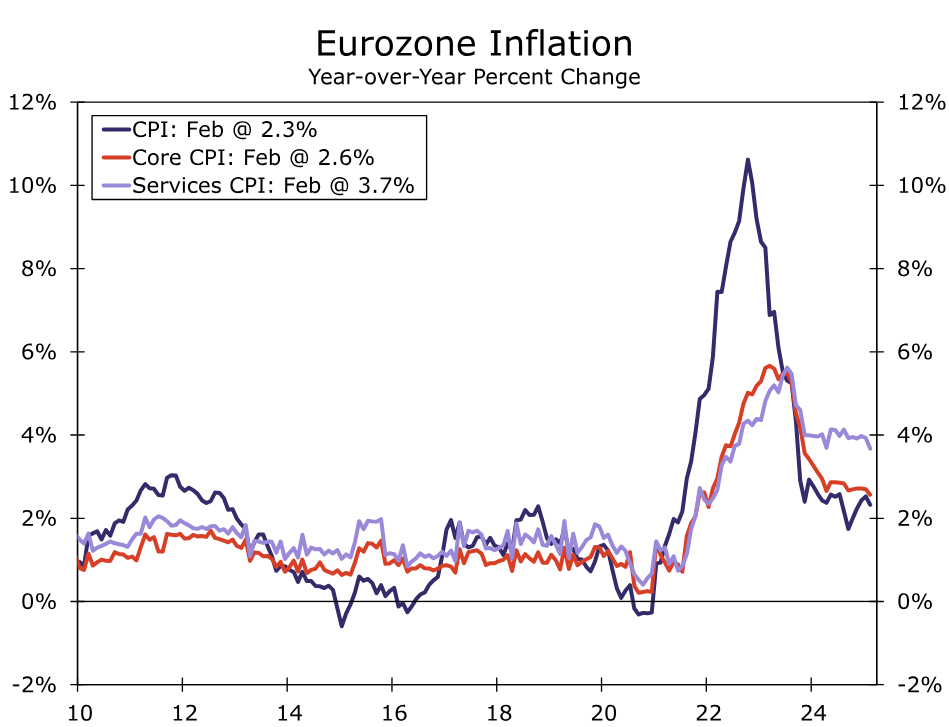
While most wage and inflation indicators are moving in a favorable direction, they remain at levels that are likely not consistent—not just yet, at least—with CPI inflation converging sustainably toward the central bank's 2% inflation target. Q4 compensation per employee slowed to 4.1% year-over-year, with productivity on a per-person basis up just 0.4% over the same period, unit labor costs also rose 3.7%. We would view wage growth of closer to 3%, and unit labor cost growth of closer to 2%, as more consistent with inflation converging sustainably towards target. That is particularly the case given the possibility of a modest uptick in goods inflation amid a global backdrop of higher tariffs. The ECB's Wage Tracker offers some encouragement that wage growth will indeed slow further, but amid a more balanced growth backdrop, policymakers may wish to see confirmation of that deceleration before proceeding with further easing. From a price perspective, the latest CPI reading for February saw core inflation at 2.6% year-over-year and services inflation at 3.7%. The latter would require a persistently low level of goods inflation to sustainably achieve the 2% target, a low level of goods inflation that might be more difficult to achieve given the current tariff dynamics.
Finally, the ECB earlier this year published research suggesting the neutral policy rate for the Eurozone lies in a region of 1.75% to 2.25%, though of course that estimated range is subject to inherent uncertainty. Still, given a more balanced outlook, we see less need for the ECB to “undershoot” its neutral policy rate, but rather simply return its policy interest rate towards a neutral range. In addition, a more balanced outlook perhaps argues for less urgency in adjusting the central bank's monetary policy setting. To be sure, an April rate cut is still possible, and may depend on whether there is a further significant deceleration is services inflation in March. Our base case, however, is for more gradual and less pronounced ECB monetary easing than we had previously envisaged. We expect the ECB to pause in April, cut rates 25 bps in June, pause in July, and cuts rates 25 bps in September, for the ECB's policy rate to reach a low of 2.00% by later this year. A firmer medium-term growth outlook and less dovish European Central Bank also has implications for the outlook for the European currency, especially when juxtaposed against our evolving U.S. outlook which sees softer GDP growth in 2025, and slightly faster Fed easing this year. In terms of our medium-term forecast we see a much more gradual pace of euro depreciation over the next several quarters than previously, and target a EUR/USD exchange rate of $1.02 by Q3-2026.
Eye on U.S. Reciprocal Tariffs Ahead of Key Job Market Reports
The United States’ administration’s announcement on reciprocal tariffs on Wednesday threatens to overshadow normally key job market reports for February in Canada and the U.S. on Friday.
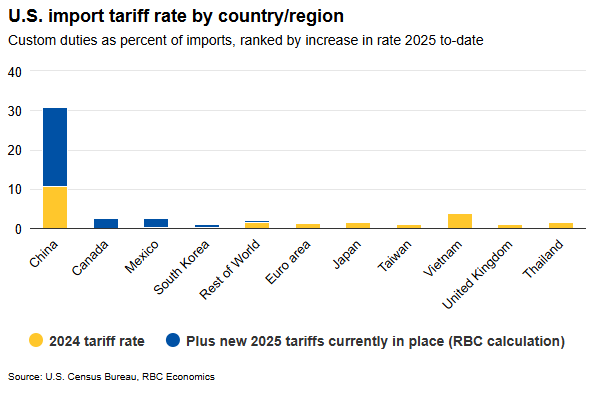
The start and stop of trade threats and actions from the U.S. have been dizzying, but as much as the uncertainty has intensified, U.S. tariffs implemented so far have not been large enough to cause a recession in Canada. By our count, the effective average U.S. tariff on imports from Canada has increased to about 2.5% from essentially zero in January.
The vast majority of U.S. imports from Canada that are USMCA/CUSMA compliant were quickly exempted from the more severe blanket 25% tariff imposed in early March. The additional steel and aluminium tariffs implemented on March 12 are large, but products impacted account for a relatively small share (about 4%) of Canadian exports to the U.S.
U.S. tariffs on finished motor vehicle exports announced this week are scheduled to kick in on April 3, and would add roughly another percentage point to that Canadian rate by our count. Still, most motor vehicle parts are (critically) not included in the initial auto tariff announcement and the value of U.S. intermediate products embodied in those finished vehicles, accounting for roughly half of the total value in Canada's case, are set to be excluded.
Canada has seen the second largest increase in the effective tariff rate applied by the U.S. to-date, but most (about 80%) of the doubling in the total U.S. tariff rate on all countries has still come from the additional 20% blanket tariffs imposed on China.
Activity hasn’t softened as much as sentiment suggests but unemployment ticked higher
Measures of business and consumer confidence have already pulled back significantly in Canada. Consumer confidence hit all-time lows in March. But, early reports on actual spending and hiring decisions have held up better than softening sentiment alone suggests.
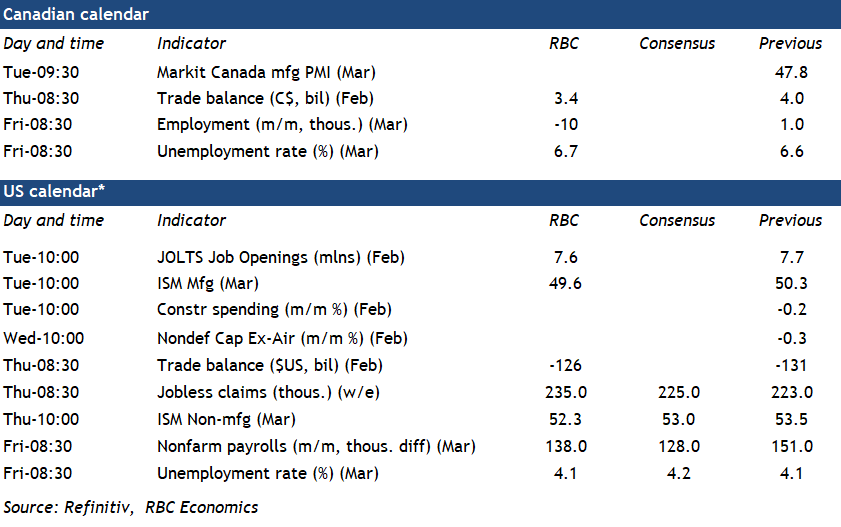
Our tracking of consumer purchases showed a mild pullback in retail spending in February, coinciding with the end of the federal tax holiday and a severe snowstorm in parts of Ontario. Hiring demand has showed some signs of slowing, but remains relatively resilient. Job openings posted on indeed.com have declined, but remain 11% above lows in October last year. We expect February’s pause in Canadian employment growth extended to a 10,000 decline in March and the unemployment rate rose to 6.7% from February’s 6.6%, but it still remains below November’s 6.9% peak.
Watch out for Canada’s rank as well as rate in reciprocal tariffs
Backward looking economic data in Canada still looks relatively resilient, but international trade risks are clouding the outlook. We know the U.S. reciprocal tariffs announcement is meant to represent a catch-all trade response to tariffs charged by trading partners, as well as a broad range of other policies the U.S. administration views as unfairly disadvantaging them (e.g., perceived currency manipulation, digital services taxes, value added taxes like Canada’s GST—see the Issue in focus here for more).
What exactly those measures look like remains highly uncertain, but targeting a broader swath of U.S. trade partners would mark a shift from measures announced so far that have been focused on the U.S.’s largest trade partners, namely China, Canada, and Mexico. We expect that where Canada ranks on the list of potential tariff increases next week compared to other regions will be as important as the rate itself. Canada was the U.S.’s second largest trade partner in 2024 in total export and import flows, but ranked as just the 9th largest source of the U.S. merchandise trade deficit (the deficit coming entirely from oil and gas products).
We have argued before that tariffs are unlikely to shrink the total U.S. trade deficit in the near-term (beyond potential distortions like the front-running of imports ahead of expected tariff hikes). But one of the major concerns from tariff measures to-date has been the narrow focus on a handful of countries including Canada, which provides a strong incentive for U.S. buyers to shift purchases away to other exporters. There are no absolute winners in a trade war, and the threat also remains that blanket tariffs briefly imposed on Canadian exports in early March could be re-imposed. But, a smaller tariff rate gap between Canada and other countries/regions could also arguably be a less damaging scenario for Canada than the current status quo.
Week ahead data watch
We expect Canadian employment edged down 10,000 in March after slowing to just 1,000 in February. It retraces only a fraction of the 76,000 jobs jump in January. Job openings from indeed.com into the second half of March are pointing to relatively resilient, but still softening hiring demand. Growth in the available labour supply will increasingly be restricted by slower population growth.
We expect the Canadian trade balance to come in at $3.4 billion in February, slightly down from the $4 billion in the prior month, but still elevated at least in part due to inventory building ahead of threatened U.S. import tariffs. We expect both exports and imports declined during that month given a 5% decline in oil prices lowering the energy trade balance. Rail carloading activities were also lower in February.
We expect U.S. payroll employment rose by 138,000 in March—roughly in line with the average increase over the prior two months. Hiring is expected to continue to slow in the public sector. We expect the unemployment rate to hold steady at 4.1%.
The advance estimate of the U.S. goods trade deficit edged lower, but remained wide after spiking higher in January. A 4% jump in exports was led by higher by auto products in the advance report, while imports remained high dipping just 0.2% after a 12.5% jump in January. Imports of industrial supplies edged down 5% after surging in the prior months on larger imports of non-monetary gold.
Tokyo CPI core rises to 2.4%, driven by soaring food and rent prices
In Japan, Tokyo’s CPI core, which excludes fresh food, rose from 2.2% yoy to 2.4% yoy in March, surpassing expectations of 2.2% yoy. Even more notable was the rise in the core, core measure, which strips out both food and energy—climbing from 1.9% yoy to 2.2% yoy, signaling broader-based inflation. Headline inflation also ticked higher to 2.9% yoy from 2.8% yoy.
The key driver behind the spike was food prices, which surged 5.6% yoy, the fastest pace since January 2024. A standout was the massive 92.4% yoy jump in rice prices, the steepest rise since 1976.
Adding to the inflationary pressure was the services sector, where prices rose 0.8% yoy, up from 0.6% yoy in February. Rent prices, a key component, increased by 1.1% yoy, the sharpest rise since 1994.
BoJ opinions highlight tariff risks, but path to further hikes still intact
The Summary of Opinions from BoJ’s March monetary policy meeting revealed growing concerns over the fallout from US trade policy, particularly the risk that new tariffs could negatively impact Japan’s real economy.
One board member warned that downside risks from the US have “rapidly heightened". I f tariff issues worsen, it could have a "negative impact" on Japan's real economy. BoJ should be “particularly cautious” when considering further interest rate hikes if trade tensions escalate.
Other members echoed similar concerns, citing elevated uncertainty from tariff threats, global supply chain disruptions, and stiff competition from low-priced Chinese products.
The tone suggests policymakers are carefully monitoring how these factors affect inflation expectations, wage growth, and investment—particularly among SMEs.
A separate opinion suggested that as underlying CPI inflation edges closer to the 2% target, BoJ should prepare to shift from accommodative to "neutral" policy.
Overall, BoJ still sees a path toward rate normalization—contingent on its inflation outlook materializing—but recent developments in global trade and domestic firm performance will dictate the pace and timing of the next move.
Fed’s Barkin: It’s “zero visibility” fog, pull over and turn on your hazards
Richmond Fed President Tom Barkin noted that the fast-moving policies of the new administration, particularly around tariffs, have created a “dense fog” of uncertainty. While acknowledging that recent high inflation could amplify the impact of new tariffs, he noted that the ultimate effect remains unknowable given the lack of clarity on final tariff rates and the responses of global actors.
Barkin warned that this heightened uncertainty is already weighing on sentiment. He explained that for consumers and businesses to spend and invest, "they need to have a certain level of confidence". Without that, demand may quiet, particularly as markets navigate the unknowns tied to policy shifts and geopolitical developments.
“It’s not an everyday ‘forecasting is hard’ type of fog,” he said, but rather one that demands a cautious approach—“a ‘zero visibility, pull over and turn on your hazards’ type of fog.”
In this context, Barkin reiterated that the Fed’s current moderately restrictive stance remains appropriate. “We are waiting for the fog to clear,” he concluded.
Fed’s Collins Advocates “active patience” with interest rates
Boston Fed President Susan Collins expressed her full support for Fed to keep interest rates unchanged last week, noting that continued economic uncertainty and inflation risks warrant a cautious approach.
Collins said that with upside risks to inflation still present, it would likely be appropriate to maintain current policy settings "for a longer time". She stressed the importance of “active patience” and flexibility as Fed monitors the evolving economy.
One of the key factors now clouding the outlook is tariffs. Collins acknowledged that new tariffs will almost certainly raise inflation in the near term. However, the longer-term implications depend heavily on how other countries react and whether businesses pass costs onto consumers. These elements could determine whether the inflationary shock is temporary or more persistent.
Cliff Notes: Assessing the Policy Stance
Key insights from the week that was.
Regarding Federal Budget 2025, our bulletin and conversation with Chief Economist Luci Ellis provides a detailed view of the Government’s expected fiscal position and economic plan for the coming four years, if re-elected. Cost-of-living relief is a priority with 2024/25’s energy rebates extended to end-2025 and a ‘top-up’ tax cut planned for 2026 and 2027 alongside spending on essential services and critical infrastructure. There was also some support for SMEs and the construction sector. The bottom line for the Government’s finances from these policies and the underlying economic environment is an increase in the deficit from 1.0% of GDP in 2024/25 to 1.5% of GDP in 2025/26 after which the deficit is expected to gradually easing back to 1.1% of GDP in 2028/29. Relative to international peers, Australia’s federal debt remains comparatively low.
As discussed by Chief Economist Luci Ellis, recently announced budget measures are unlikely to materially shift the outlook for the RBA. Other data released since the RBA’s February meeting also has not provided a meaningful deviation from the recent trend. Of note this week, the Monthly CPI Indicator printed broadly as expected, the monthly trimmed mean measure ticking down from 2.8%yr to 2.7%yr in February. Last week’s labour market data was also indicative of balance between demand and supply, and the international environment is likely to be of little consequence for Australian inflation over the forecast period. Hence, we continue to expect the RBA to remain on hold next week but to cut three more times this year to 3.35% as inflation tracks back to and remains at the mid-point of the RBA’s 2-3%yr medium-term range.
Offshore, this week saw more rumours and news regarding US trade policy. New tariffs were announced on cars "not made in the United States" effective 2 April, dubbed Liberation Day by the Administration. In addition, US President Donald Trump also announced 'secondary tariffs' on countries buying oil and gas from Venezuela, also to take effect on 2 April. The rapid escalation of US protectionism has seen manufacturing sentiment retreat of late – the Richmond Fed Index for March dipped to -4pts, with new orders and employment both weaker. The drop in the Richmond Fed survey was broadly consistent with the latest readings from the Dallas and Philadelphia Fed regions, which also signalled a loss of momentum and confidence across US industry.
More broadly, core durable goods orders disappointed at -0.3% in February, continuing business investment’s poor run over the past decade, equipment investment having averaged growth of just 1.9%yr and structures only 1%yr. Of more concern for the market this week was Conference Board consumer confidence, the headline index falling to its lowest level since early 2021, and expectations at a twelve year low. Views on the labour market are more mixed amongst US households, the Conference Board employment measure remaining relatively robust after respondents to the University of Michigan’s survey showed more concern. It’s worth noting that businesses continue to pull forward imports to the US to get ahead of the imposition of tariffs. This trend has even affected Australia’s trade with the US despite our distance. US monetary policy makers’ concern over the potential inflationary consequences of tariffs also looks to be growing, St Louis Fed President Musalem this week warning that the "risks that inflation will stall above 2% or move higher in the near term appear to have increased" and that "indirect, second-round effects on non-imported goods and services could have a more persistent impact on underlying inflation".
Across the Atlantic meanwhile, the UK CPI was a touch weaker than expected in February at 0.4% (consensus 0.5%), leaving annual inflation at 2.8%yr compared to 3.0%yr in January. Core inflation edged down from 3.7%yr to 3.5%yr, but services inflation held up at 5.0%yr. While services continued to dominate the headline pulse, the share of components rising beyond the BoE's 2.0% inflation target narrowed to 54.6%. This print came ahead of the Spring Budget which saw expectations for growth cut from 2.0% in 2025 to 1.0%. Markets were keenly awaiting this release as the Autumn Budget showed that, to ensure the government is able deliver a balanced budget by 2029-30, costs can only rise by GBP9.9bn. This limited fiscal headroom has since been put under further pressure by the strong increase in Gilt yields since January. Borrowing is anticipated to be higher in the short-term, due mostly to an increase in interest costs as well as near-term policy including increased spending on defence of GBP2.2bn in 2025-26, in an effort to see defence spending hit 2.5% of GDP by 2027. The GBP9.9bn margin remains; the Office of Budget Responsibility expects the government will reach its target with 54% certainty. Net debt is still anticipated to remain just below 100% of GDP over the forecast period.
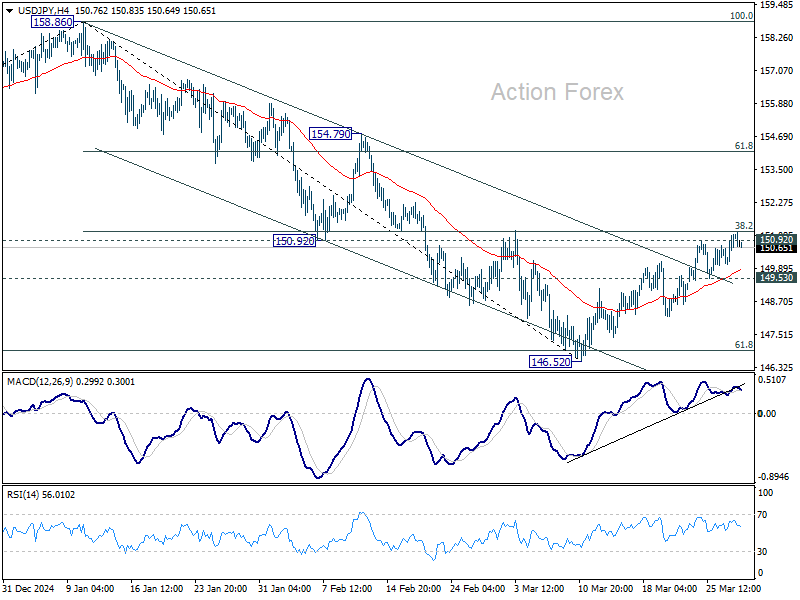
USD/JPY Back in Action—Key Levels to Watch for Further Gains
Key Highlights
- USD/JPY started a fresh increase above the 149.20 resistance.
- A key bullish trend line is forming with support at 150.00 on the 4-hour chart.
- EUR/USD tested the 1.0740 level and started a consolidation phase.
- GBP/USD could make another attempt to clear 1.3000.
USD/JPY Technical Analysis
The US Dollar started a fresh increase above 148.80 against the Japanese Yen. USD/JPY even cleared the 150.00 resistance zone to enter a positive zone.
Looking at the 4-hour chart, the pair settled above the 150.00 level, the 100 simple moving average (red, 4-hour), and the 200 simple moving average (green, 4-hour). The pair remains supported and aims for more gains above 151.20.
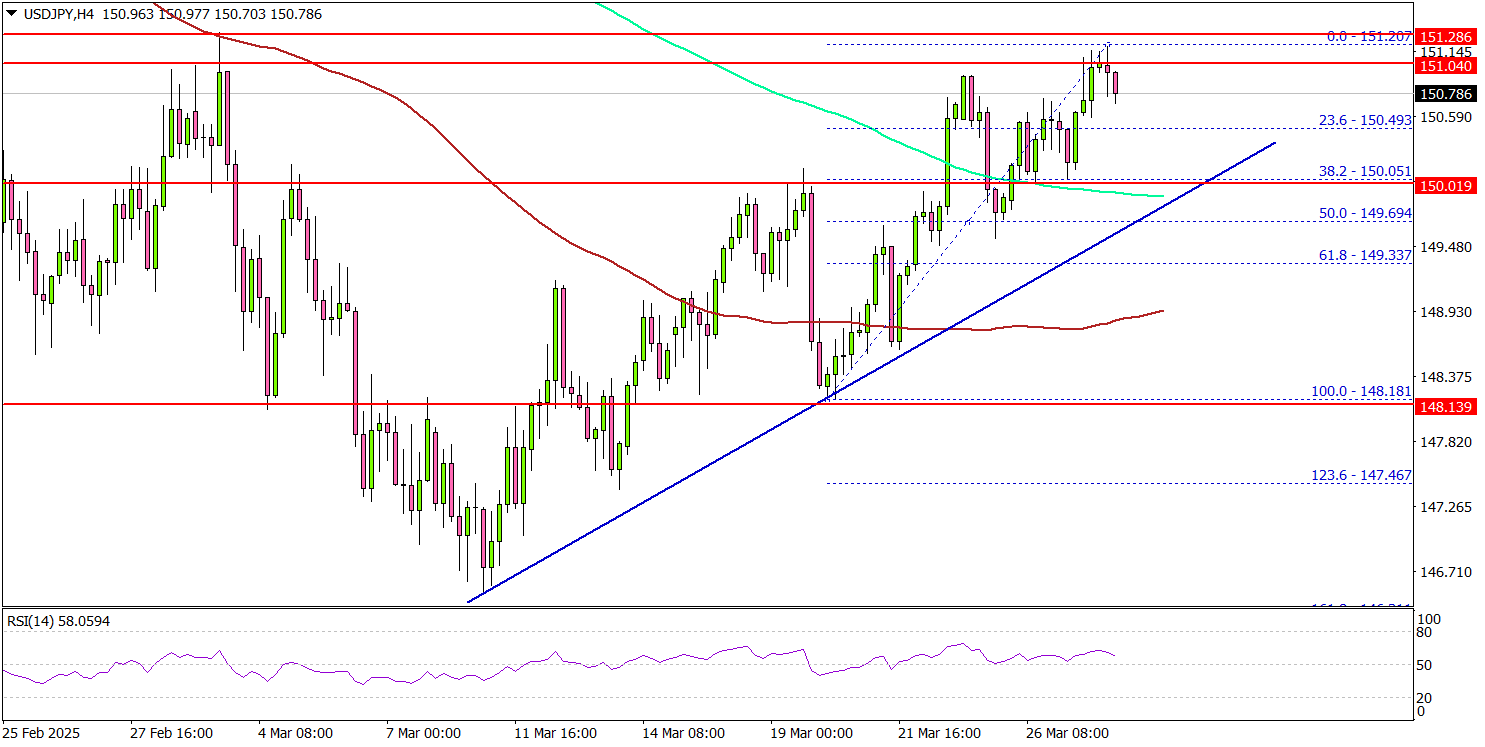
On the upside, the pair is facing resistance near the 151.50 level. The next major resistance is near the 152.00 level. The main resistance is now forming near the 152.50 zone.
A close above the 152.50 level could set the tone for another increase. In the stated case, the pair could even clear the 153.20 resistance.
On the downside, immediate support sits near the 150.20 level. The next key support sits near the 150.00 level. There is also a key bullish trend line forming with support at 150.00 on the same chart. Any more losses could send the pair toward the 149.20 level.
Looking at EUR/USD, the pair corrected gains, tested 1.0740, and might struggle to start a recovery wave above the 1.0850 resistance.
Upcoming Economic Events:
- US Personal Income for Feb 2025 (MoM) - Forecast +0.4%, versus +0.9% previous.
- US Core Personal Consumption Expenditure for Feb 2025 (MoM) - Forecast +0.3%, versus +0.3% previous.
GBPCAD Finds Support in Blue Box, Buyers Achieve First Target
Hello traders. Welcome to another ‘blue box’ post where we discuss the recent trade setup that Elliottwave-forecast members traded. In this post, the spotlight will be on the GBPCAD currency pair.
In the long term, GBPCAD is developing as a bearish market within a proposed diagonal structure. The Supercycle degree wave (I) was completed in May 2010, followed by a bounce for wave (II), which ended in November 2015. From that point, wave (III) moved lower and completed in October 2022. Notably, waves (I), (II), and (III) are all 3/7 swing structures, supporting our proposed long-term diagonal structure for members. Diagonals are often composed of five sub-waves, with each wave subdivided into three waves.
Currently, the rally from October 2022, where wave (III) ended, is unfolding as another three-swing sequence. Therefore, we can classify this rally as wave (IV). However, it appears that wave (IV) is an incomplete corrective sequence. Based on projections, wave (IV) could extend to at least 1.96 – 2.08.
We prefer trading along the path of an incomplete sequence. With this in mind, we advised members to buy pullbacks in 3, 7, or 11 swings, while keeping invalidation levels intact at each stage. Let’s now discuss the latest setup we shared with members.
GBPCAD Elliott Wave Trade Setup – 27th March 2025
At the January 2025 low, wave ((2)) of (1) of c of (IV) was completed. From this low, an impulsive sequence began, forming wave (1) of ((3)). Within wave (1) of ((3)), a pullback for wave 4 of (1) started in March 2025 after the pair reached its highest price since July 2016.
We planned to buy from the extreme of wave 4 of (1), provided it completed a 3-swing or 7-swing pullback—also known as zigzag and double zigzag structures, respectively. As the pullback for wave 4 of (1) approached its extreme, we shared the H4 chart below with members
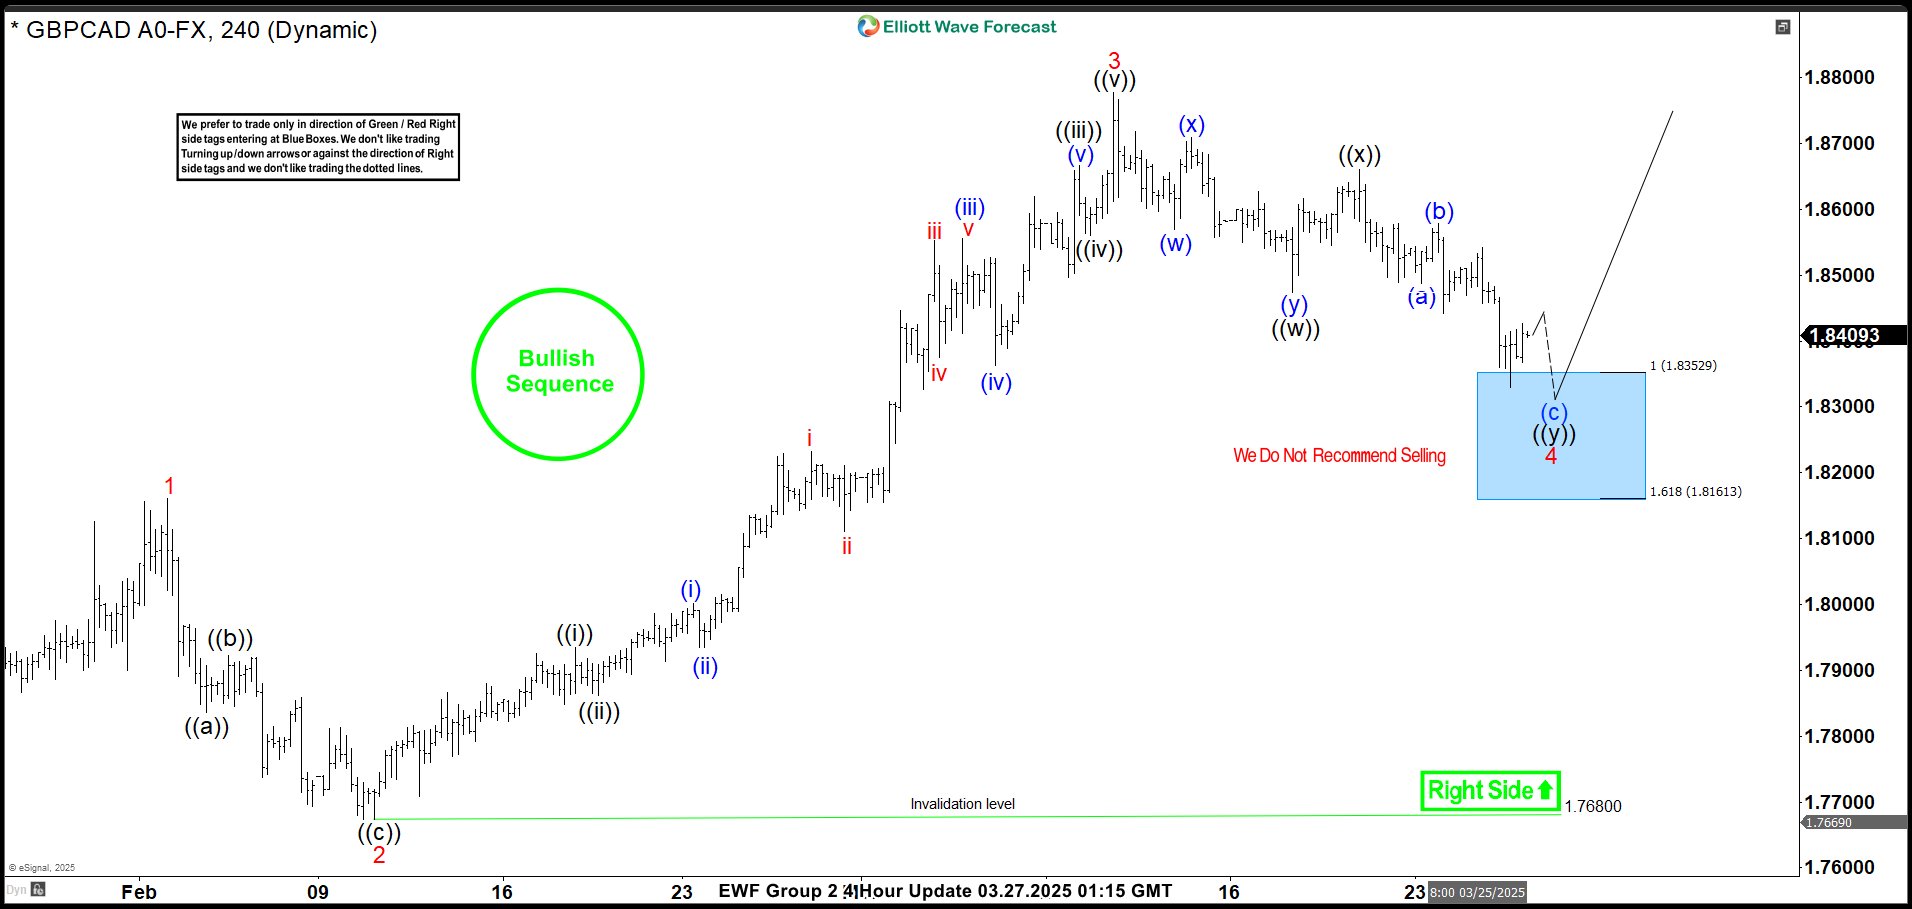
The chart above highlights the Blue Box where we expected members to enter long positions. We anticipated that wave 4 would complete in this zone, providing support for wave 5 of (1).
If the price rallied as expected, we advised members to take partial profit at 1.8530 and move the remaining position to breakeven. This strategy allowed for preparation in case wave 4 developed into a double correction. However, if an impulsive move emerged for wave 5, we planned to take the second profit at 1.9050.
GBPCAD Elliott Wave Trade Setup – 27th March 2025
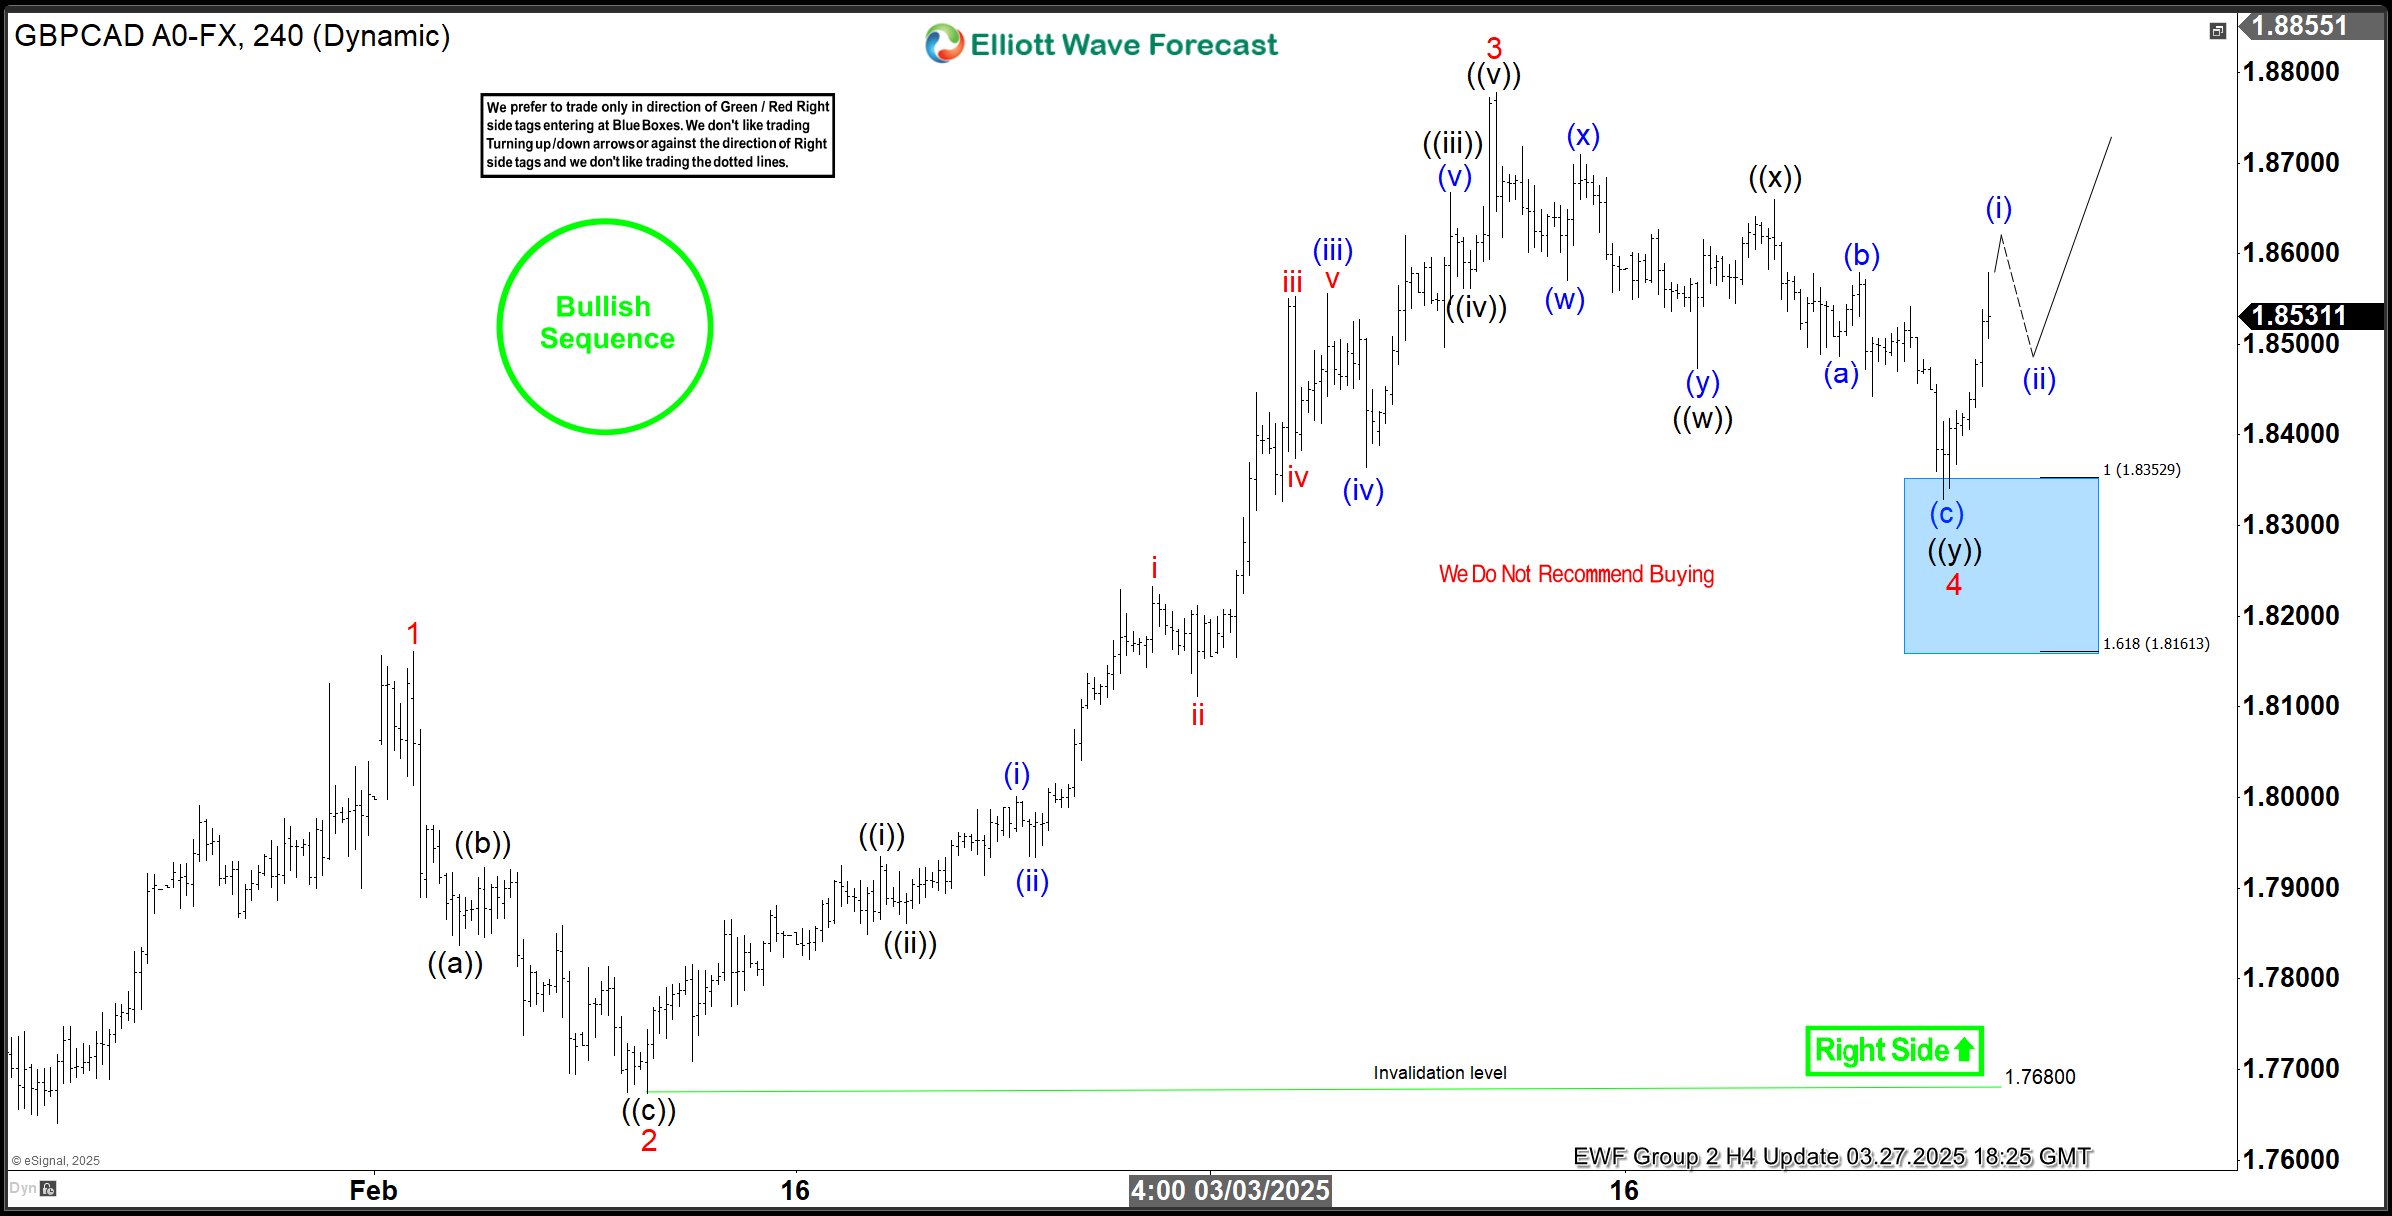
Later, on March 27, 2025, GBPCAD rallied from the Blue Box, as anticipated. The price surpassed the first target at 1.8530, allowing traders to take partial profit and adjust the stop on the remaining position to breakeven.
With this risk-free setup, traders could shift their focus to other opportunities while still anticipating further profits on this pair. This was a high-confidence setup, carefully analyzed and executed. This approach exemplifies how we apply Elliott Wave theory in our service.