Sample Category Title
Upbeat Markets Ahead Of Busy Week
The mood in financial markets is relatively upbeat at the start of a very busy week, as investors shrug off the G7 meeting which didn't exactly go to plan as Donald Trump rejected the prepared communique and left early.
While everyone will have hoped for a better outcome from the meeting, I don't think anyone is surprised given Trump's views on trade and his combative approach to the country's allies on the issue. Perhaps it was the expectation that this was a likely outcome that has led to investors shrugging it off and turning their attention to something more interesting, and there's certainly plenty for them to focus on in the coming days.
Trump's next meeting with North Korean leader Kim Jong Un on Tuesday will be of interest as the US President looks to score a victory and distract from the country's souring relationship with its Western allies. Whether the two leaders are actually on the same page in regards to the goals of the meeting could determine just how successful the talks are but Trump in particular will be keen to be seen making progress towards denuclearisation.
Central banks will be very much in focus this week, with the Federal Reserve, European Central Bank and Bank of Japan all meeting and announcing monetary policy decisions. The Fed and ECB meetings will be of particular interest, with the former widely expected to raise interest rates for the second time this year and lay the groundwork for at least one more, possibly even two given the progress made on its inflation goal.
The ECB has been gradually drawing a close to its quantitative easing program over the last 15 months, first reducing monthly purchases from €80 billion to €60 billion in March last year and then to €30 billion from the start of this year. With that expiring in September, an announcement on whether we'll see another small taper and extension is expected at this meeting or the next and discussions will very likely take place on Thursday, as has been indicated by some officials. With new economic projections also being released, the meeting should provide some insight into what we can expect for the rest of the year.
The first day of the week may be a little quieter, but we've already had some manufacturing data from the UK which was disappointing. The UK itself won't be far from the headlines in the first half of the week, with jobs data due out tomorrow, inflation numbers on Wednesday as well as two days of talks in parliament over the amendments to the Brexit bill.
NIESR: UK growth slowed materially with risks weighed to the downside
NIESR said UK GDP is estimated to have grown 0.2% in the three months ending May, following 0.1% grow in the three months ending April.
Amit Kara, Head of UK macroeconomic forecasting, said:
"Economic growth has slowed materially since the start of this year and it continues to remain weak."
"One reason for sluggish growth is the disruption caused by severe weather in March, particularly to the construction sector.:
"The latest data also shows a notable slowdown in manufacturing sector output that appears to be driven by both domestic and external conditions."
"By contrast, the retail sector and the dominant services sector may be recovering."
"Looking ahead, we expect the economy to strengthen from here mainly because monetary policy in the UK and elsewhere continue to remain accommodative."
"The risks to that outlook are, however, weighed to the downside. The most important of these remains Brexit but there are others, most notably an escalation of tensions in international trade and a potential flare-up in uncertainty in the Euro Area because of political developments in Italy."
GBPUSD Outlook: Falls On Downbeat UK Data, Risk Of Reversal Increases
Cable fell sharply on Monday, hit by disappointing UK data. UK Manufacturing Production dropped 1.4% in April vs forecasted increase of 0.3%, which marks the biggest drop since Oct 2012. Industrial production was down 0.8% in April, undershooting the forecast for 0.2% rise.
Trade gap widened to 14.04 billion pounds in April from forecasted 11.35 billion gap and previous month’s downward-revised gap at 12 million pounds. Strong miss in all UK data releases today are hit for hawks advocating UK rate hike in August.
Fresh weakness increases downside risk and on track to confirm reversal.
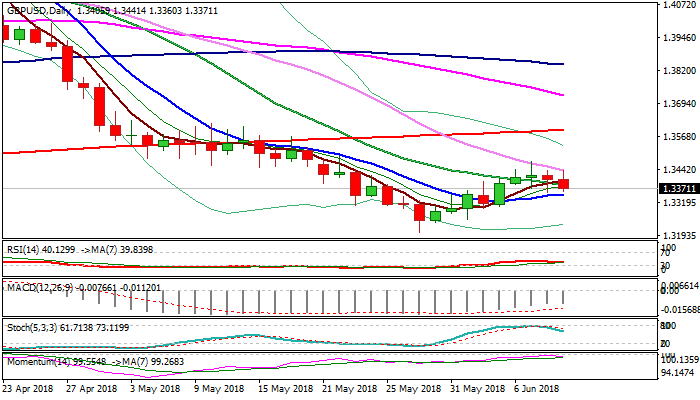
Near-term structure weakened after falling 55SMA capped the upside for the third straight day and subsequent fall adding on rising negative tone.
Pivotal support at 1.3349 (10SMA) came under pressure after fresh bearish acceleration cracked initial pivot at 1.3369 (Fibo 38.2% of 1.3204/1.3472 upleg).
Break and close below 10SMA is needed to confirm reversal and lower top at 1.3472 (07 June high).
Momentum turned lower after failing to break into positive territory, while slow stochastic heads south after reversal from overbought territory, showing a plenty of space at the downside. Only break and close above descending 55SMA would sideline bearish threats.
Res: 1.3400, 1.3441, 1.3472, 1.3520
Sup: 1.3349, 1.3338, 1.3306, 1.3267
ECB Preview – Members to Discuss QE Tapering This Week, Attention Moves to Rate Hike Path and Forward Guidance
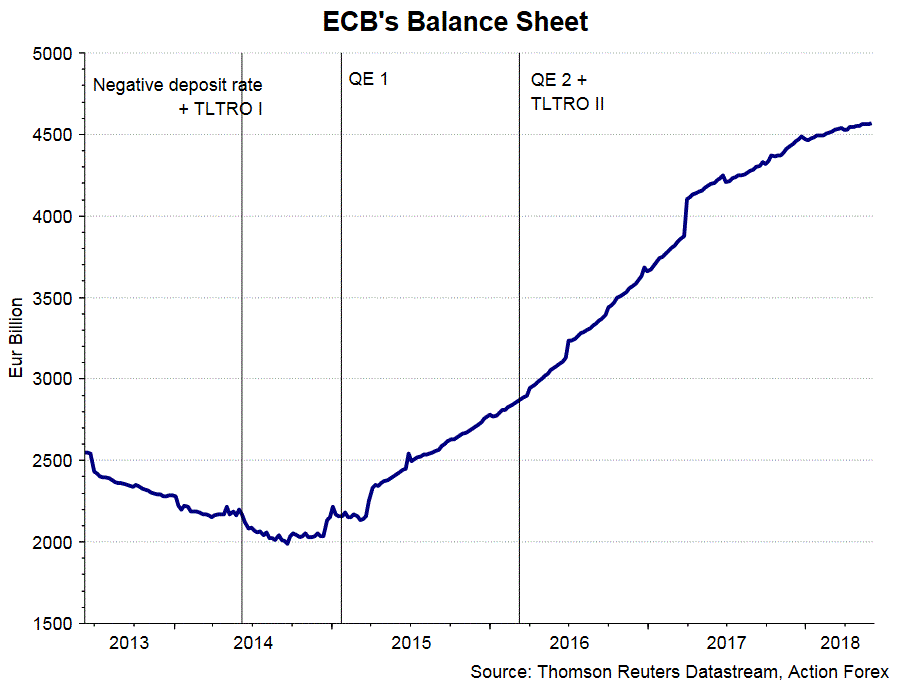
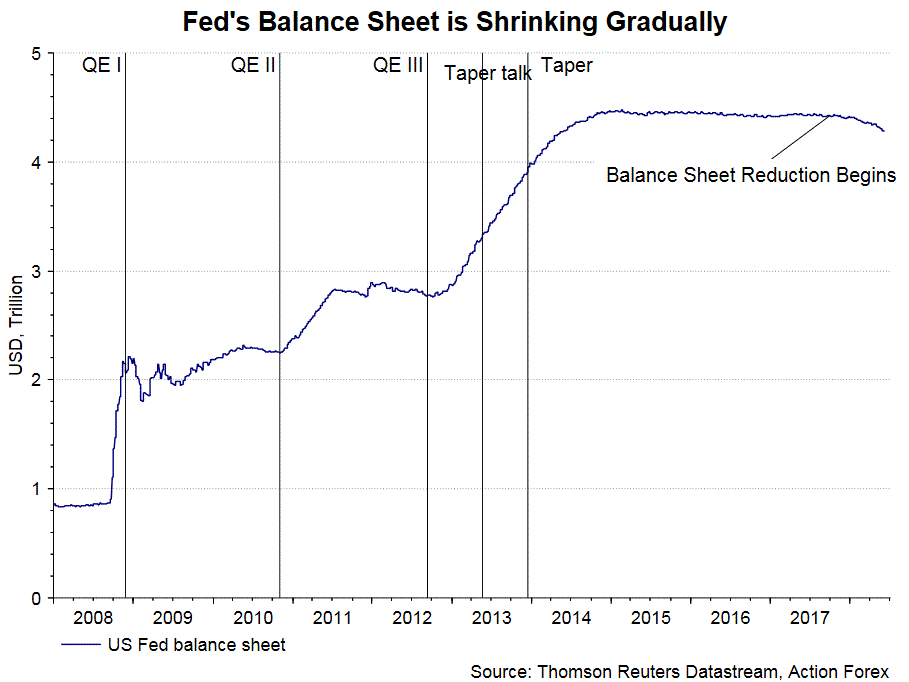
The recovery in euro since late-May gathered momentum last week after ECB Chief Economist and executive board member Peter Praet signaled the central bank would discuss QE tapering at this week’s meeting. We are not surprised by this as it is appropriate for the members to communicate with the market its next week after the current asset purchases end in September. We believe July would be a better time for the announcement as the members could assess more indicators before making a decision. This is particularly important at the current period of economic growth slowdown, rising protectionism from the US and ongoing political uncertainty in the peripheral Eurozone. The single currency would likely strengthen after the tapering announcement. Yet, any further appreciation would be short-lived as policy divergence between the Fed and ECB remains. After the QE exit (we expect by December 2018), ECB would reinvest the proceeds from the maturing bonds, similar to what the Fed was doing to maintain its expanded balance sheet at US$ 4.5 trillion during the period of 2014 to 2017. Yet, the Fed has already finished the process and is now occupied with balance sheet reduction and rate hike.
As Praet suggested last week, “signals showing the convergence of inflation toward our aim have been improving, and both the underlying strength in the Euro area economy and the fact that such strength is increasingly affecting wage formation supports our confidence that inflation will reach a level of below, but close to, +2% over the medium term”. He added that “waning market expectations of sizeable further expansions of our program have been accompanied by inflation expectations that are increasingly consistent with our aim”. Probably the most important part of his speech is as follows: “next week, the Governing Council will have to assess whether progress so far has been sufficient to warrant a gradual unwinding of our net purchases”. This is interpreted as a hawkish message by the market, as it signals less stimulus going forward.
ECB’s current asset purchase of 30B euro per month will end in September. It is widely understood that the members would have to communicate with the market the next step in either June or July, as September would be to rush for the market to prepare. We expect the June meeting would be one for the discussion on the available options of the tapering process while an announcement of the decision would be made in July. That said, we do not feel surprise if an announcement is made this month. In our opinion, there are several approaches that the members to take. For instance, ECB could choose to reduce the purchase to zero in September. It might also trim the purchase size to 10B euro per month until December or take a even linear approach by reducing the monthly buying size to 15B euro, 10B euro and 5B euro in October, November and December, respectively. Our base case is that ECB would prefer to end the program by December. As such either of the above approaches should not make might difference.
We should start to move the focus to the rate hike schedule. ECB has affirmed for some time that the key ECB interest rates would “remain at their present levels for an extended period of time, and well past the horizon of our net asset purchases”. We do not expect any rate hike at least until September 2019 but any move should be data-dependent. The forward guidance is of great importance. We expect to see a change in forward guidance on the same day as QE tapering announcement. For a more concrete forward guidance, we believe it would help improve communication with the market if the central bank is more specific about for how much more time the current interest rate would remain. It would also help if ECB assures that any rate hike would gradual and in small size, e.g. +10 bps.
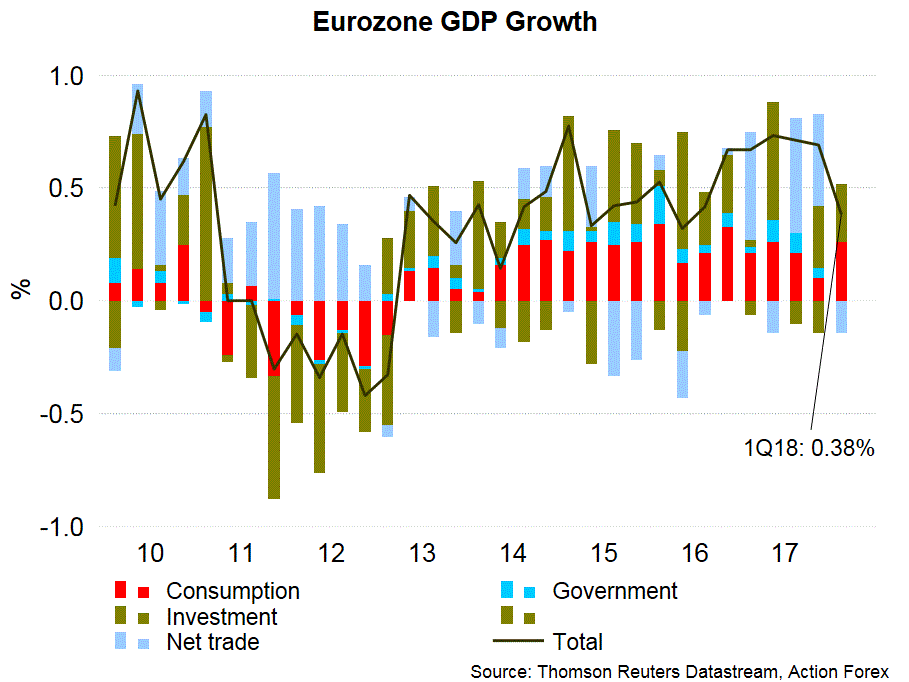
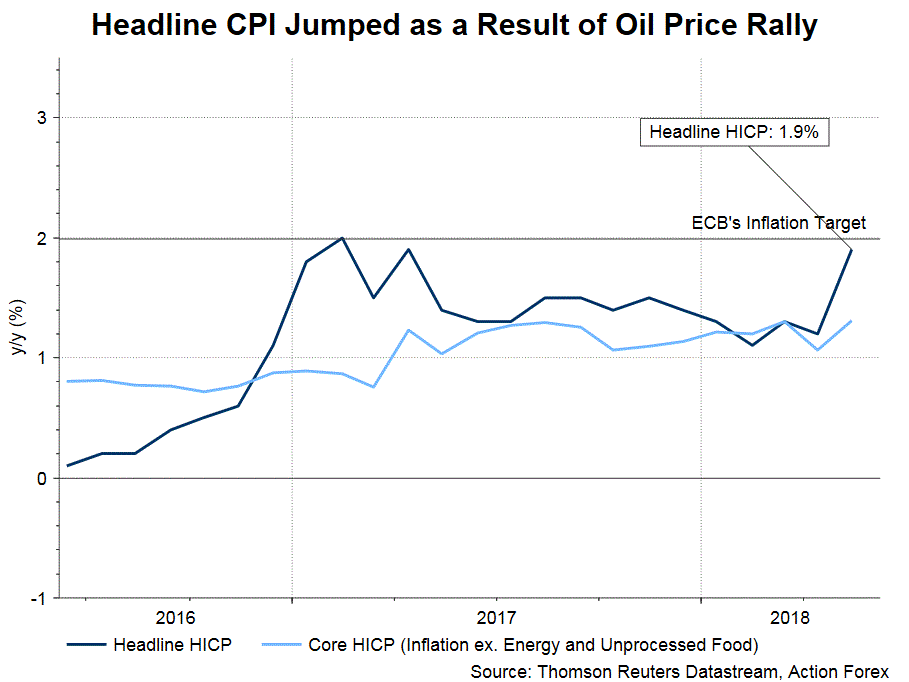
What is certain to be released in June is the updated staff economic projection. GDP growth moderated to +0.4% q/q in 1Q18, from +0.7% in the prior month. Headline CPI accelerated to a 13-mongh high of +1.9% y/y in May, up from +1.2% in the prior month. However, this was mainly driven by the rally in oil price and weakness in the euro. Excluding energy and unprocessed food, core inflation remained soft, improving to +1.3% from April’s +1.07%. We expect the members to revise lower economic growth forecast, reflecting greater concern over protectionism, and revise higher inflation outlook.
Gold Maintains Short-Term Neutral Bias, Weak Movement Over Last 3 Weeks
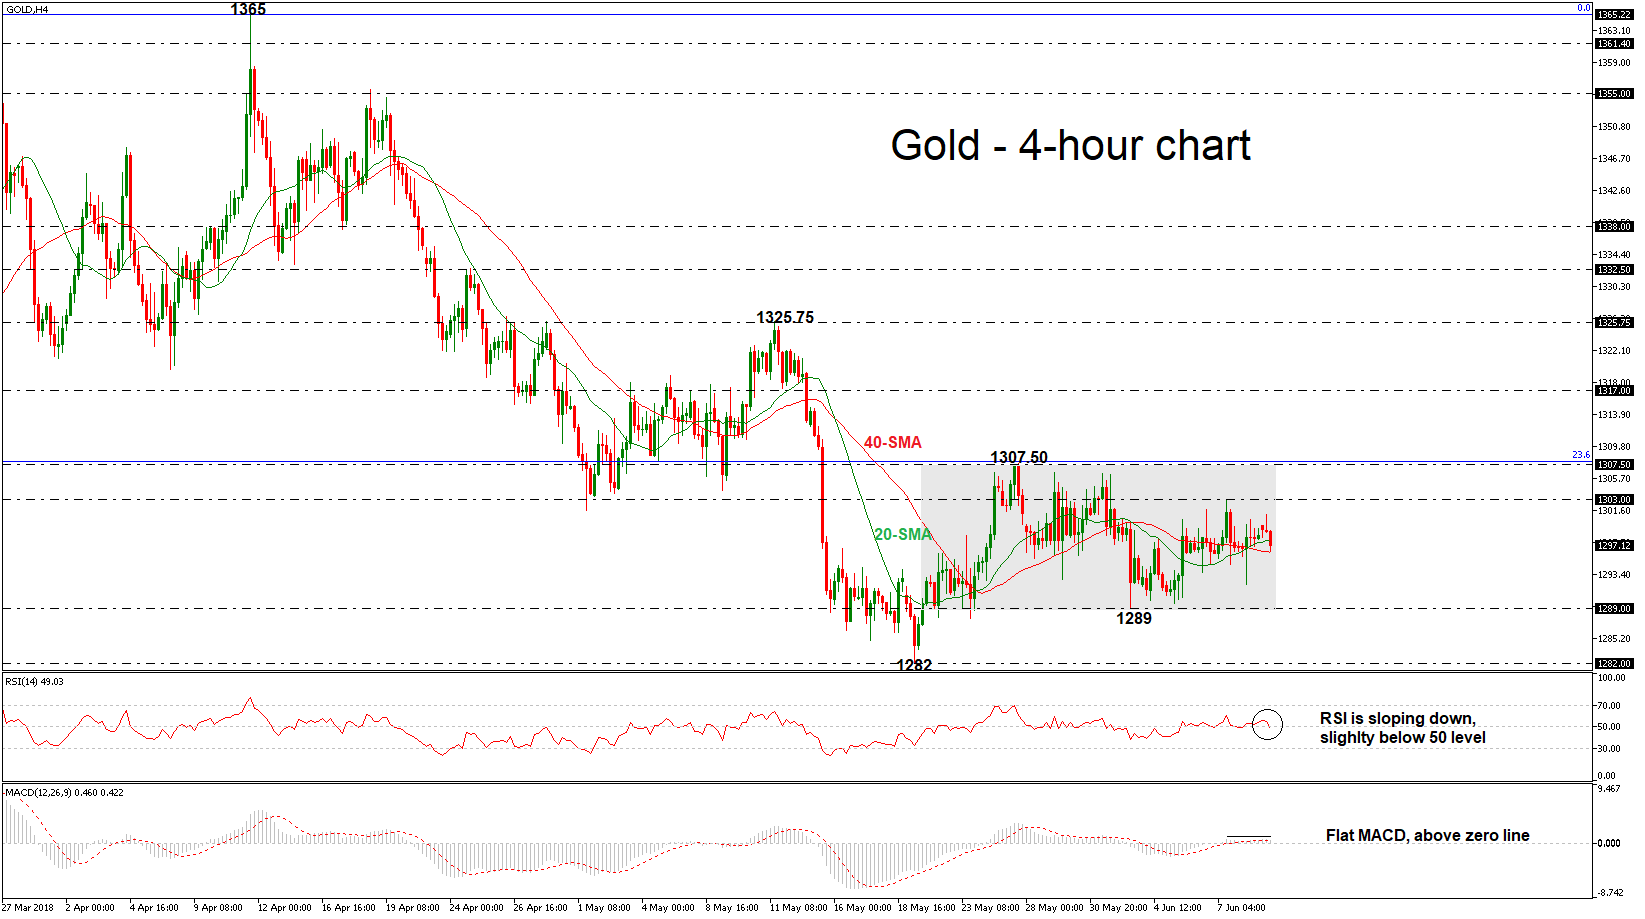
Gold remains under pressure as it has been consolidating within a trading range over the last three weeks with upper boundary the 1307.50 resistance level and lower boundary the 1289 support barrier. The short-term technical indicators are bearish and point to more weakness in the market.
Looking at the 4-hour chart, gold prices are looking capped by the 20-simple moving average (SMA). The Relative Strength Index (RSI) is heading lower below the 30 level and is sloping downwards, while the MACD oscillator is flattening near the zero line.
The next target to have in mind to the downside is the lower boundary of 1289. At this stage, a drop below this area would likely see a resumption of the downtrend and challenge the 1282 support hurdle. Further losses could drive the precious metal towards the 23.6% Fibonacci retracement level of the upleg from 1122 to 1366, around 1272.
Upsides moves are likely to find resistance above the 1300 key level. Rising above this zone would push the price until the upper boundary of the consolidation area of 1307.50, which overlaps with the 200-day SMA. Clearing this level would shift the focus to the upside towards the 1317 resistance barrier and turn the bias to bullish.
In the short-term, the neutral phase remains in play especially if gold price continues to trade below the 23.6% Fibonacci and under the psychological 1300 level.
Fed Hike Leads Busy Week For Central Banks
Central banks to take centre stage
It was a busy week on the geopolitical side as the G-7 meeting didn’t have a very happy ending, while the world eyed the upcoming meeting between Donald Trump and Kim Jung-Un, which will take place on Tuesday morning in Singapore. Market participants do not seem concerned about these two subjects. On Monday morning, the greenback eased slightly against most of its peers as the dollar index returned to 93.42, down 0.12%. After tumbling on the 1.1854 resistance on Friday, the single currency erased Friday’s losses partially and tested 1.1821. Safe haven currencies lost ground as buyers didn’t show up despite unstable geopolitical situation, which suggests that the investors are definitely not too worried about it.
Nevertheless, developments in the option market suggests that there is certain nervousness out there. This just a nothing to do with Trump. Indeed, it is going to be a busy week for central banks as the ECB, the Fed and the BoJ are holding their rate decision meeting. The 1-week implied volatility in EUR/USD jumped to 9.95%, from 7.57% last Wednesday. The downward move in the 1-week risk reversal measure – from to 0.21% to -0.16% - shows that investors are rather buying protection against a weaker currency pair. On the contrary, both the implied volatility and risk reversal measure in USD/JPY were little changed, suggesting that the market will focus its attention on the ECB and FOMC meeting. We expect that investors will pay less attention to the Trump/Kim Jong-Un meeting, and developments related to trade tariffs, and will focus on Powell and Draghi speeches.
Trump pounds MXN and CAD
US President Donald Trump’s verbal bombardment of Canadian Premier Justin Trudeau after the weekend’s G7 summit threatens the ongoing renegotiation of the North American Free Trade Agreement (NAFTA) considerably. We would remain short on MXN and CAD, as Trump’s blasts are unlikely to promote a deal.
Meanwhile, Trump is working on an de-nuclearisation deal for North Korea, which is a pawn in US-China relations. North Korea, as a puppet of China, will signal what its master wants and will do. Failure to deliver a positive result will likely trigger a Trump backlash of tariffs against China. A positive result could see Trump deescalated his China bashing (already he has waived restrictions on ZTE, a Chinese telecommunications equipment firm). Next week the US will likely release the final list of $50 billion in Chinese import tariffs – their shape and extent will depend on how the Trump-Kim summit goes.
As widely reported, Trump blew up the G7 by disavowing the communique after it was released. In a tweet Saturday Trump referred to Trudeau as “very dishonest and weak.” Trump advisor Peter Navarro piled on the Canadian PM, telling Fox news “there is a special place in hell for any leader that engages in bad faith diplomacy with Trump.”
Forex Analysis: NZDJPY Wave Analysis
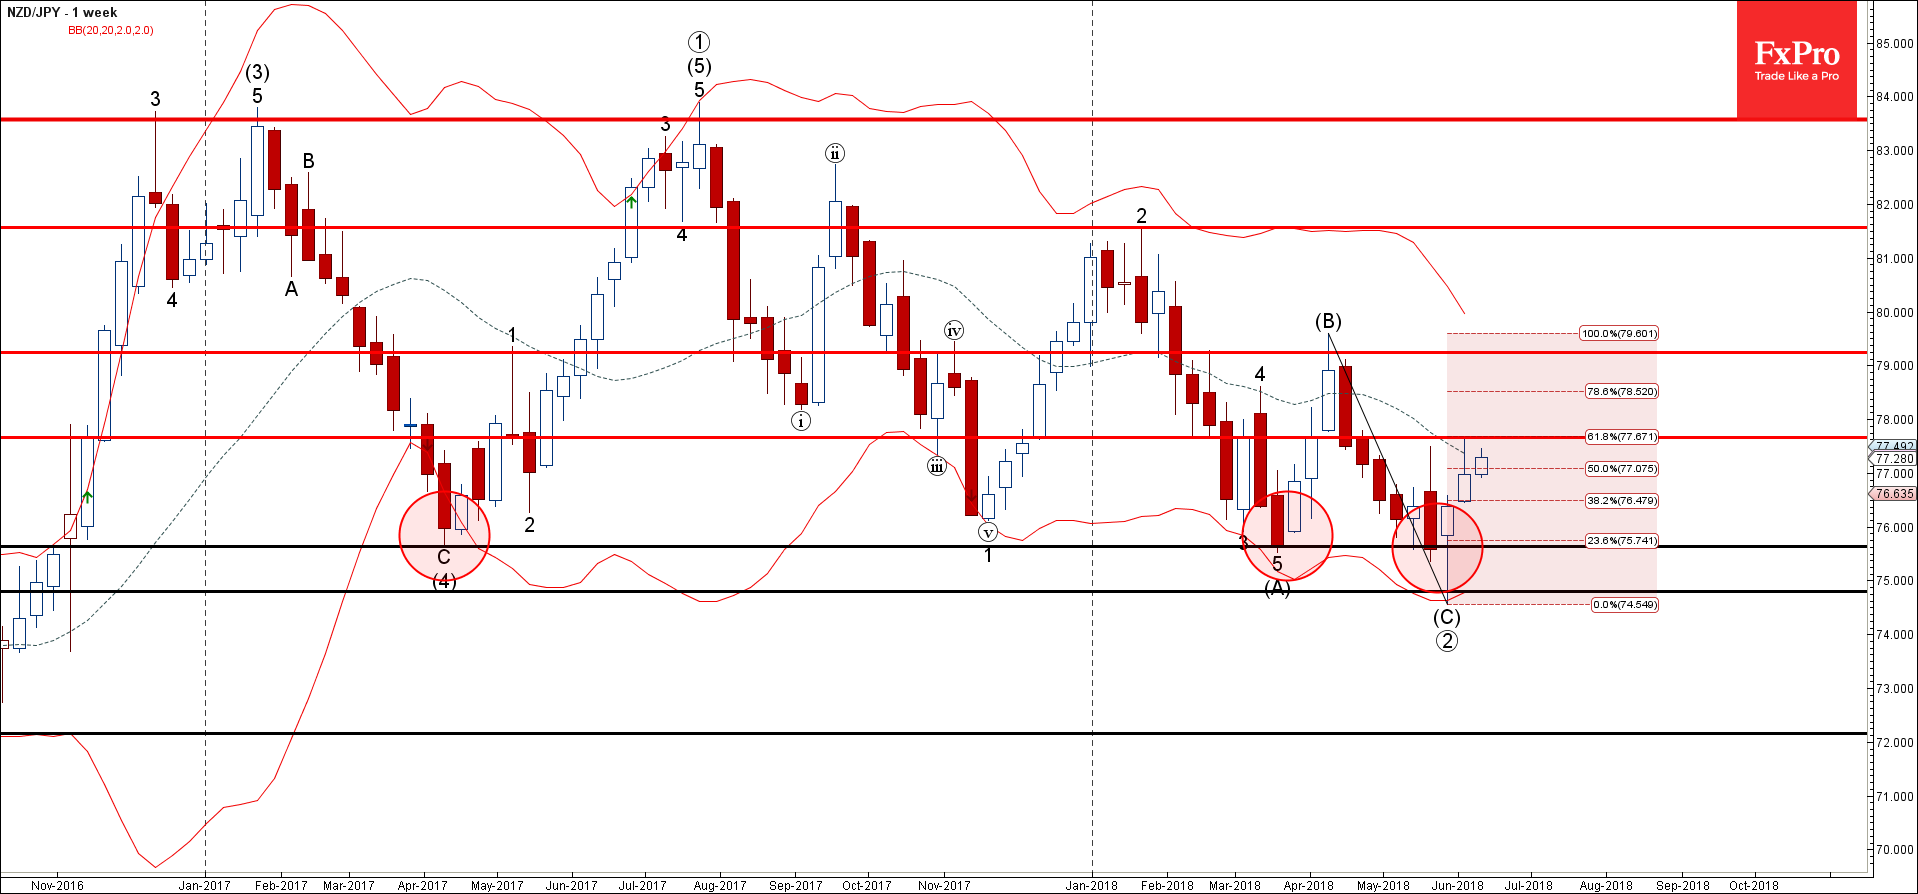
NZDJPY rising inside impulse wave 3
Further gains are likely
NZDJPY continues to rise inside the long-term impulse wave 3, which started earlier from the support zone lying between the support levels 74.80, 75.60 (which has been reversing the price from April of 2017) and the lower weekly Bollinger Band.
The upward reversal from the aforementioned support zone created the weekly Japanese candlesticks reversal pattern Hammer, highlighter below.
NZDJPY is expected to rise further and re-test the next resistance level 77.70 (which reversed the price last week) – intersecting with the 61.8% Fibonacci correction of the previous downward impulse (C).
Forex Analysis: AUDUSD
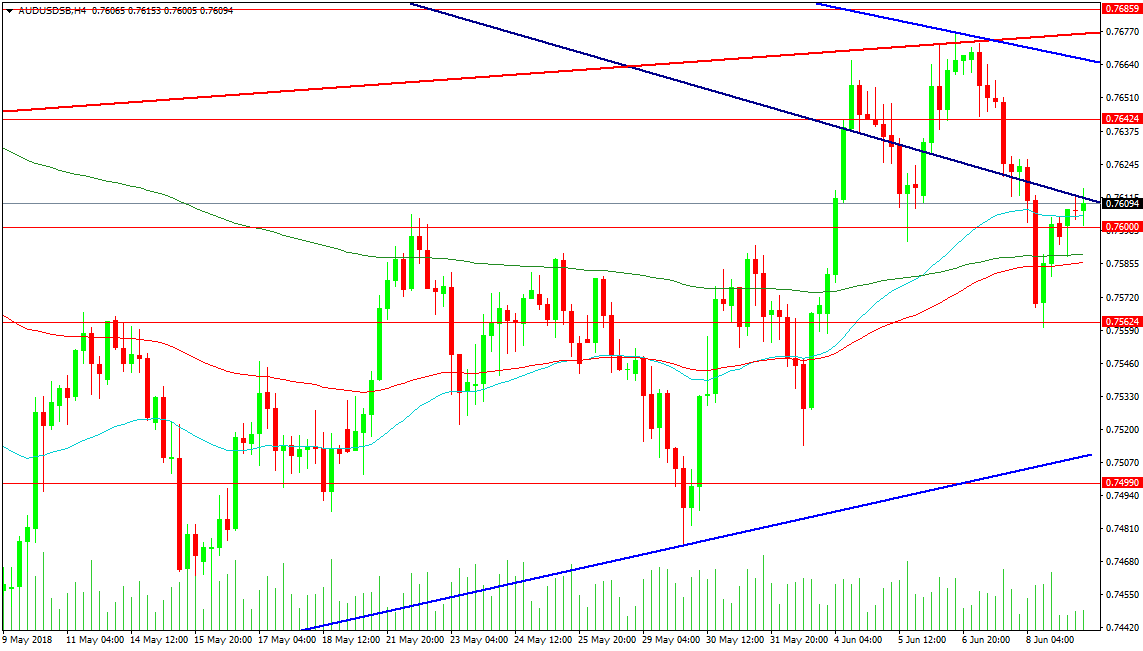
The AUDUSD pair is testing resistance at the first falling blue trend line today in an attempt to regain higher prices after failing at the red line last week. Price is trading between the resistance at 0.76150 and support at 0.76000. There is support to lean against at the 200 and 100 period MAs at 0.75893 and 0.75862 respectively but a loss of these levels can see a move to support around 0.75624. A move under this level would result in sellers engaging with the market as a lower low is created with a retest of the rising blue trend line at 0.75090 needing buyers to defend to avoid a push down to 0.74500.
Resistance at 0.76124 is the first hurdle to overcome but the area above 0.76640 becomes more difficult for longs. The high from the beginning of last week is positioned there with the upper blue falling trend line that was used as the high for last week. A Move above the blue line just pushes price into the red line at 0.76770and last week’s high. So as can be seen this band of resistance is tricky to negotiate but as time passes it will disperse. Above the 0.76859 level the 0.77110 level comes into view followed by the 0.77606 area.
Forex Analysis: USDCAD
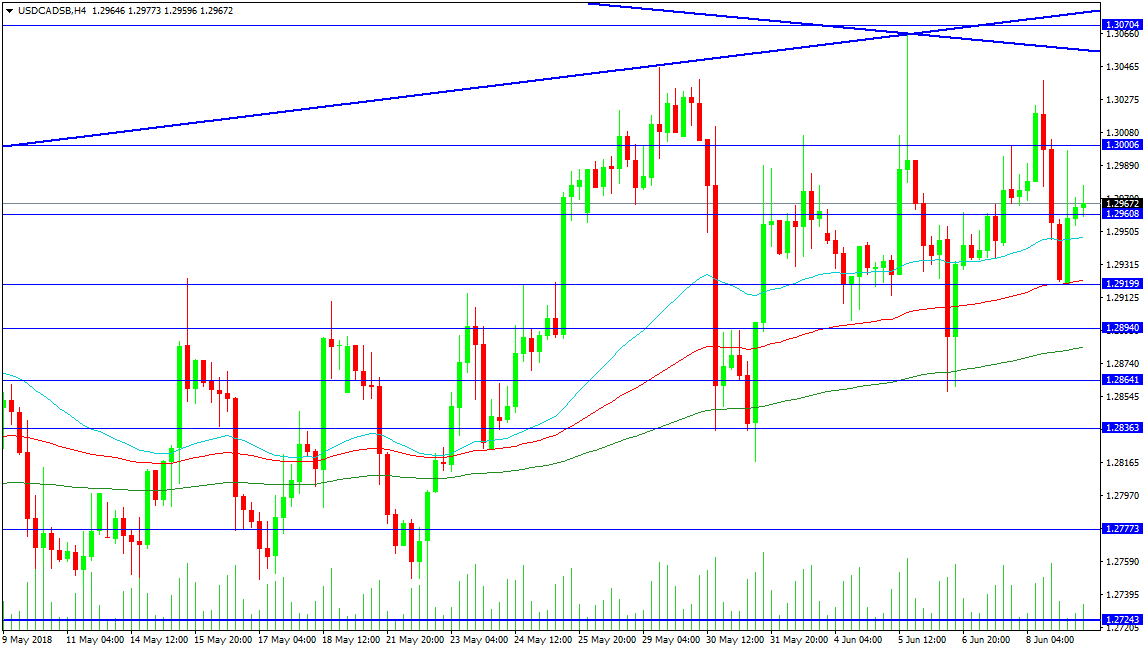
This pair was sent lower last week when it collided with the crossing of the resistance trend lines at 1.30657. Price fell to the area of the supporting 200 period MAs in a repeat of the move from the previous week. The rebound higher failed above 1.30000 and has since rebounded from its 100 period MA at 1.29200. The ongoing battle of wills between US President Trump and Canada is impacting the pair but with no clear winner price is largely range bound. Resistance is forming a zone from 1.30000 to 1.30704. A breakout higher targets the March high at 1.31241 with higher targets at 1.33000 and 1.35000.
Support for the pair comes at the 200 period moving average at 1.28835 followed by the series of higher lows at 1.28600, 1.28200 and 1.27417. A drop under the 1.27143 support level can lead to a more bearish switch in sentiment for the pair with a retest of the April low on the cards at the 1.25300 level. Further moves lower can target support at 1.24500 where rising trend line support is expected to reach should a moderate selloff occur this month.
CRUDE OIL Sideways
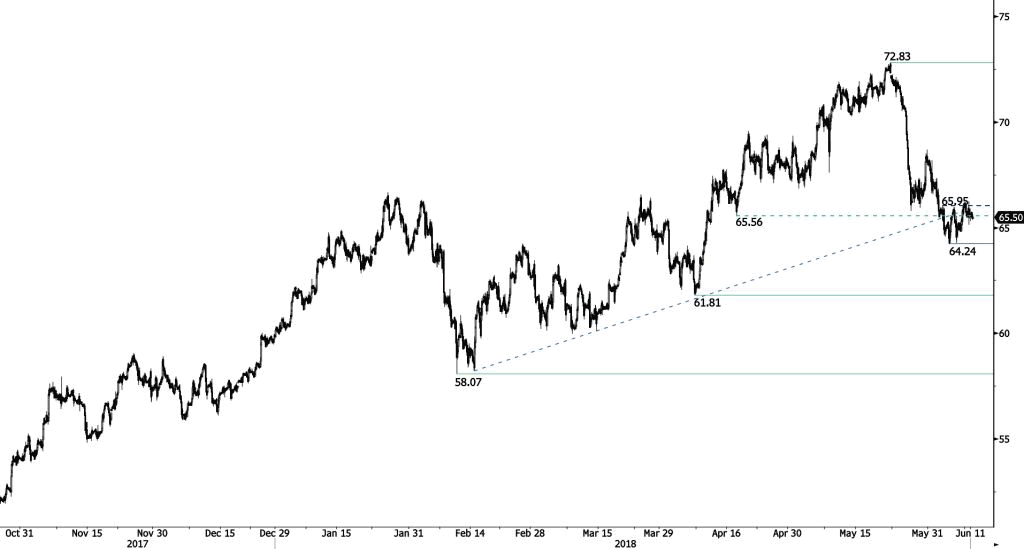
Crude oil bounce from 64.22 (05/06/2018 low) continues, approaching 66. Hourly support and resistance are given at 61.81 (06/04/2018 low) and 72.83 (22/05/2018 high). The technical structure suggests short-term increase.
In the long-term, crude oil has recovered after its sharp decline last year. However, we consider that further weakness is very likely. For the time being, the pair lies in an upside trend since June 2017. Support lies at 42.20 (16/11/2016) while resistance is located at 77.83 (20/11/2014). Crude oil is trading largely above its 200 DMA.