Sample Category Title
EUR/USD Bouncing Further
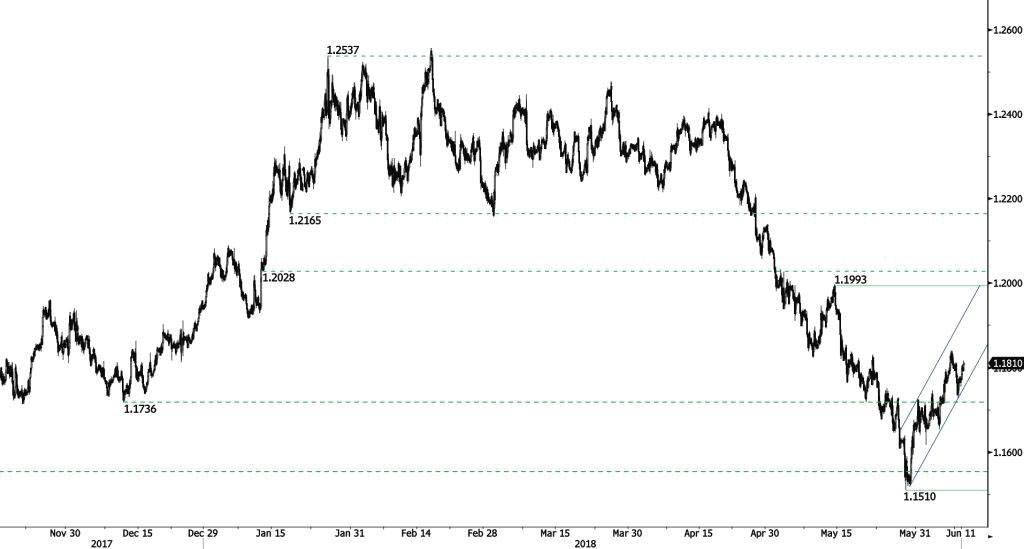
EUR/USD has broken the resistance at 1.1736 leading to renewed buying pressure. The shortterm trend remains negative as long as prices remain below hourly resistance at 1.1993 (14/05/2018 high). Hourly support is given at 1.1510 (29/05/2018 low).
In the longer term, the momentum is turning largely negative. We favor a continued bearish bias. Key resistance is holding at 1.2886 (15/10/2014 high) while strong support lies at 1.0341 (03/01/2017 low).
Forex Technical Analysis: EUR/USD, USD/JPY, GBP/USD
EUR/USD
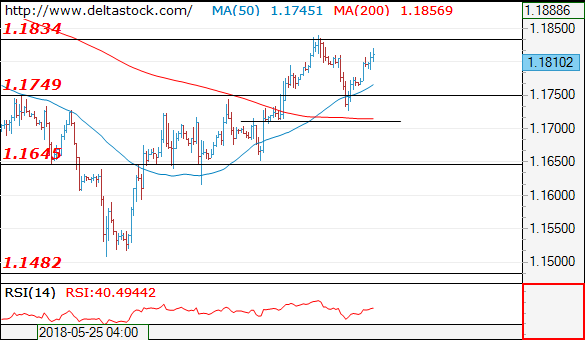
Current level - 1.1810
My outlook is counter-trend below 1.1830, for a reversal and downswing towards 1.1710. Trigger on the downside is 1.1790.
| Resistance | Support | ||
| intraday | intraweek | intraday | intraweek |
| 1.1830 | 1.1830 | 1.1790 | 1.1480 |
| 1.1830 | 1.2060 | 1.1710 | 1.1300 |
 USD/JPY
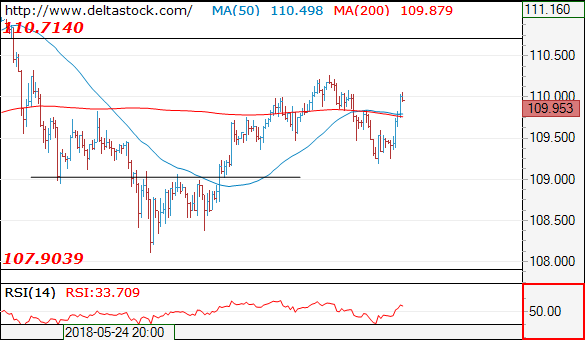
Current level - 109.95
The reversal at 109.26 signals a risk of another upswing beyond 110.30, to 110.70. Nevertheless, the mentioned resistance should provoke a slide towards 107.90.
| Resistance | Support | ||
| intraday | intraweek | intraday | intraweek |
| 110.30 | 111.40 | 109.25 | 107.80 |
| 110.70 | 114.40 | 107.90 | 106.70 |
GBP/USD
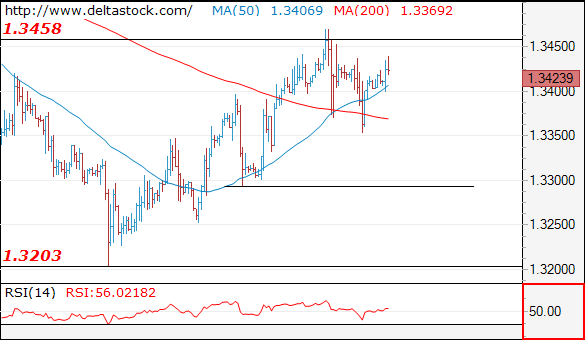
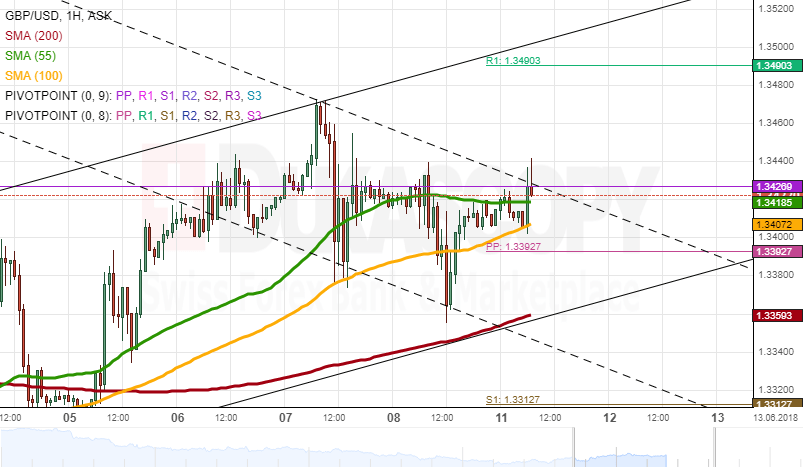
Current level - 1.3423
The outlook is bearish below 1.3460, for a slide towards 1.3290.
| Resistance | Support | ||
| intraday | intraweek | intraday | intraweek |
| 1.3460 | 1.3618 | 1.3380 | 1.3210 |
| 1.3620 | 1.3990 | 1.3290 | 1.3040 |
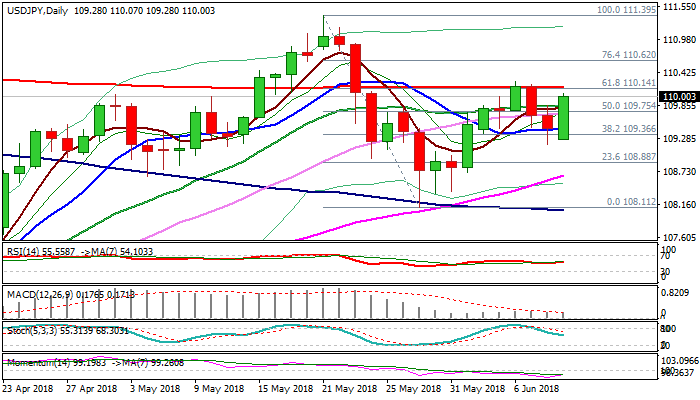
USDJPY Outlook: Regains 110 Handle But Faces Again Strong Headwinds From Key 200SMA/Fibo Barriers
The pair regained traction in late Asian/early European trading on Monday, after starting week with gap-lower on renewed trade war fears, following G7 meeting failure as President Trump pulled out of G7 joint communique.
The dollar surged to 110 barrier and pressures again key 200SMA barrier (110.16) as risk appetite returns to play ahead of historic US/North Korea summit on Tuesday.
Fresh bullish acceleration formed higher low at 109.20 and sidelined fears of further weakness, but the downside is expected to remain at risk while 200SMA caps.
Momentum is strengthening and 5/10/20MA’s returned to bullish setup, supporting the notion, as rising and thickening daily cloud continues to underpin the action.
Break and close above key 110.14/16 barriers (Fibo 61.8% of 111.39/108.11 bear-leg/200SMA), after two unsuccessful attempts last week, is needed to confirm continuation of bull-leg from 108.11 (29 May trough).
Meanwhile, strong offers at this zone may slow bulls.
Broken daily Kijun-sen offers solid support at 109.75, which should ideally contain dips and keep fresh bulls intact, while deeper downticks are expected to hold above 10SMA (109.50).
Strong negative signal could be expected on return and close below 10SMA.
Res: 110.16, 110.26, 110.62, 110.90
Sup: 109.75, 109.50, 109.30, 109.20
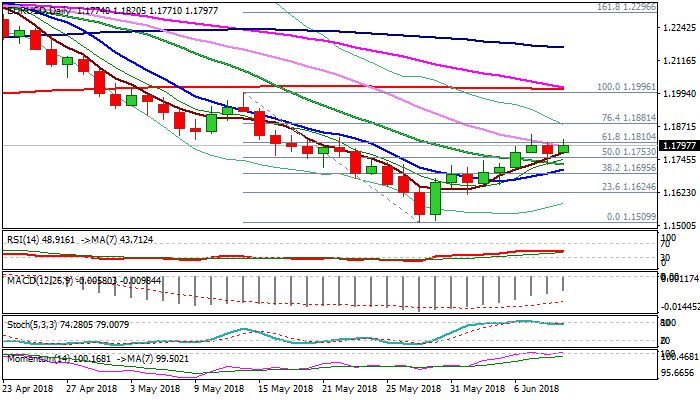
EURUSD Outlook – Fresh Bullish Acceleration Probes Again Through Key 55SMA Barrier
The Euro remains bid in early Monday's trading despite trade war concerns after G7 failure.
Fresh strength probes through key barriers (55SMA / Fibo 61.8% of 1.1996/1.1509 bear-leg) at 1.1796/1.1810 respectively, after falling 55SMA capped the action in past two trading days.
Recovery leg off 1.1509 (29 May low) made shallow pullback on Friday, with correction being contained by 20SMA at 1.1727, while rising 5SMA (1.1772) continues to underpin recovery.
Rising bullish momentum supports fresh advance, but sustained break above 55SMA is needed to signal recovery continuation.
Extended consolidation cannot be ruled out while 55SMA caps, while increased downside risk could be expected on break and close below 20SMA (1.1728).
Res: 1.1796, 1.1810, 1.1822, 1.1881
Sup: 1.1772, 1.1728, 1.1710, 1.1684
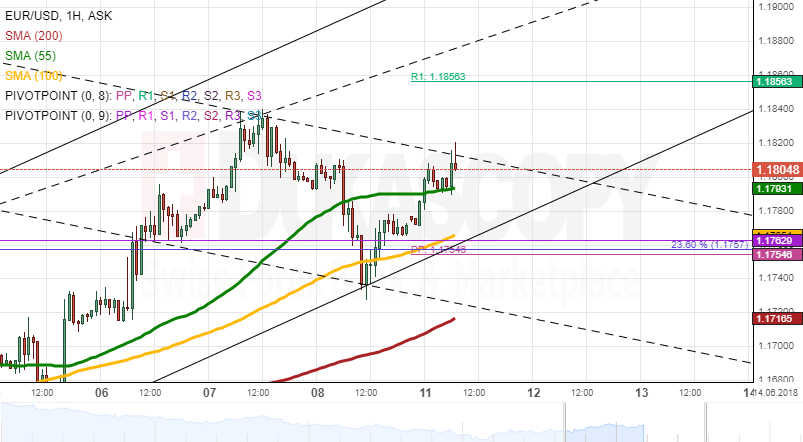
EUR/USD Analysis: Expected To Advance Today
EUR/USD remained downwards-tended until mid-Friday when it reversed from the 100-hour SMA near 1.1740. By this morning, it has breached the 23.60% Fibo retracement, the monthly PP and the 55-hour SMA.
It seems that the rate might still edge higher in this session, with the upper limit being the weekly R1 and an upward-sloping trend-line circa 1.1870. Advance above this mark is not expected during the following two days, as the Euro is starting to diminish its trading range within a two-week channel up.
In terms of support, it is likely that bears lack the necessary strength to push the pair below its nearest support formed by the 100-hour SMA and the monthly and weekly PPs at 1.1760, especially if no significant data releases are scheduled for today.
GBP/USD Analysis: Points To Decline
Despite some volatility throughout the day, the GBP/USD exchange rate remained stable during Friday's trading session. From above, it was restricted by the monthly PP at 1.3427, while a fall below the 1.3360 level was stopped by the 100-period (4H) SMA.
In general, the pair has maintained its tendency north in an ascending channel during the following two weeks. Technical signals suggest that the Sterling could re-test this 100-period and 200-hour SMAs near 1.3360 today. The bottom channel line is likewise located there. The general bullish tendency suggests that this level might mark a reversal to the upside within the aforementioned channel.
In case the 55-hour SMA is breached, daily gains should be capped near the weekly R1 and the 200-period (4H) SMA at 1.3490.
USD/JPY Analysis: Hits Strong Barrier At 109.80
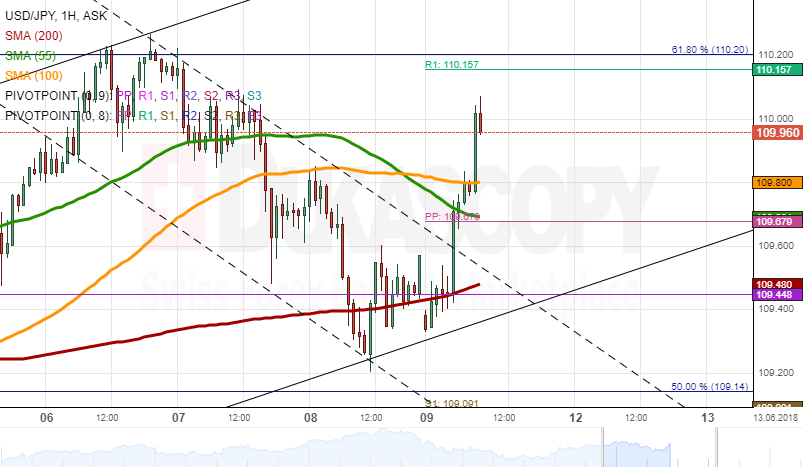
USD/JPY was trading in a neat channel down for last two sessions. Following a test of the more senior channel and the 55-period (4H) SMA mid-Friday, strong upside risks pushed the rate out of this short-term channel and towards the 109.80 mark where the 100-hour and 100-period (4H) SMAs are located. These moving averages might work as strong resistance, thus reversing the rate back down to the 200-hour SMA and the monthly PP at 109.40.
From technical point of view, the pair should continue its current up-move and target the upper channel line, the monthly R1 and the weekly R2 at 110.75 this week. Technical indicators are also bullish for this session, suggesting that the 109.80 level should eventually surrender.
Gold Analysis: With No Changes
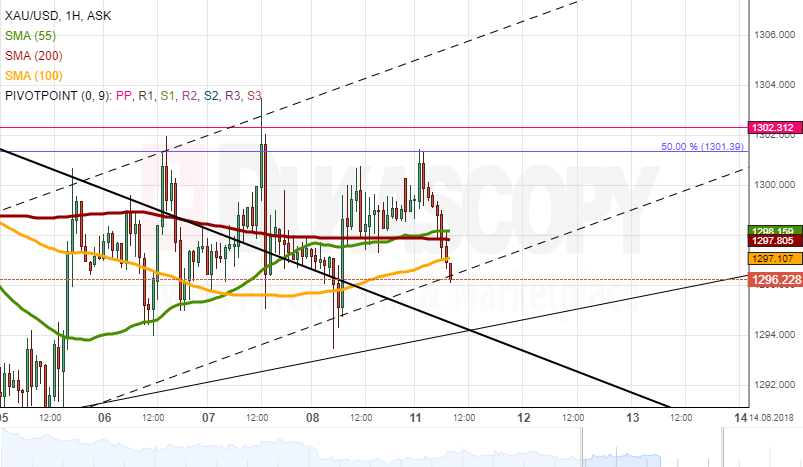
Gold is showing no changes in its positioning against the US Dollar for the sixth consecutive session. Similarly to other days, the 50.00% Fibonacci retracement and the monthly PP proved to be a strong resistance level, thus restricting any attempts to move above 1,302.00.
Meanwhile, it is apparent that the pair is gradually moving away from a four-week channel. This suggests that the 55– and 200-hour SMAs could guide the pair higher today. However, significant gains might not follow, as the 1.305.00 mark is restricted by the 200-period (4H) SMA.
The rate being stranded between these strong barriers are likely to result in yet another calm day for the yellow metal.
GBP/CAD 4H Chart: Pound Sterling Still Bearish
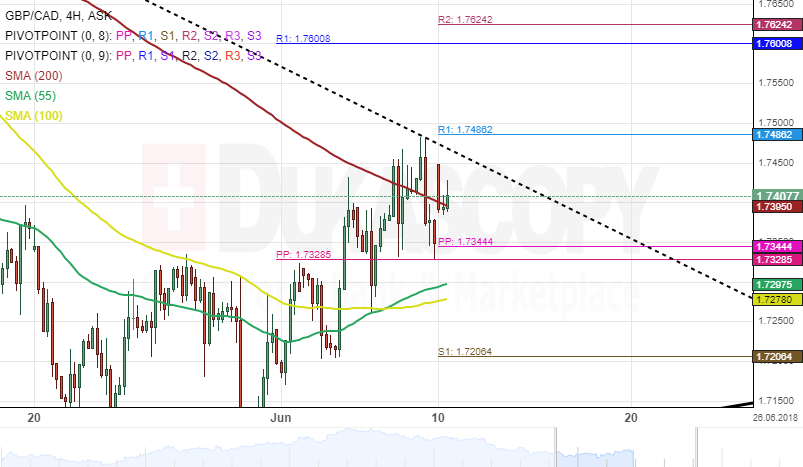
GBP/CAD has been moving in a descending channel during the past two months. Within this period, the currency pair has tested the upper boundary of the prevailing pattern three times.
The currency exchange rate continues to diminish its trading range and moving along the descending channel.
Meanwhile, technical indicators flash bearish signals during this week, thus suggesting that bears might continue to grow stronger during the following trading sessions.
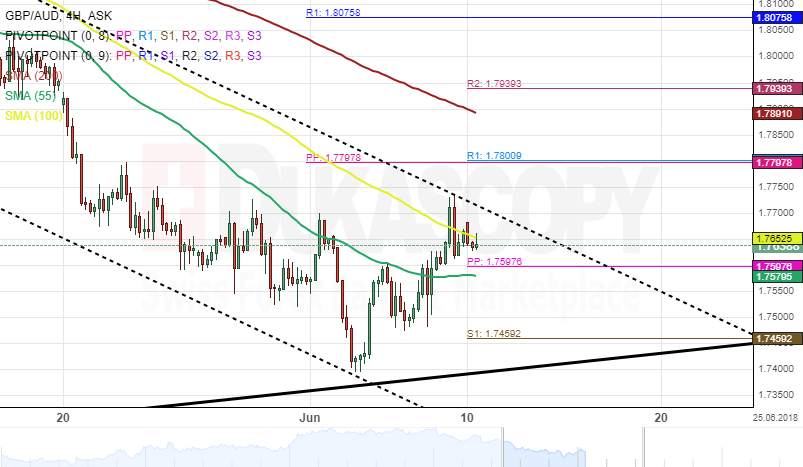
GBP/AUD 4H Chart: Channel Likely To Be Respected
The GBP/AUD currency pair has been guided by a two-month descending channel. This pattern was formed on April 26 and has driven the rate lower toward the bottom boundary of an ascending channel.
Following a test of the southern border of the dominant ascending channel on June 4, bulls tried to take control of the market; however, a resistance set by doubleheader pushed the pair south.
Everything being equal, it is likely that the currency exchange rate strengthens during the following trading sessions toward the 200-hour simple moving average. In addition, technical indicators favour bulls to grow stronger.