Sample Category Title
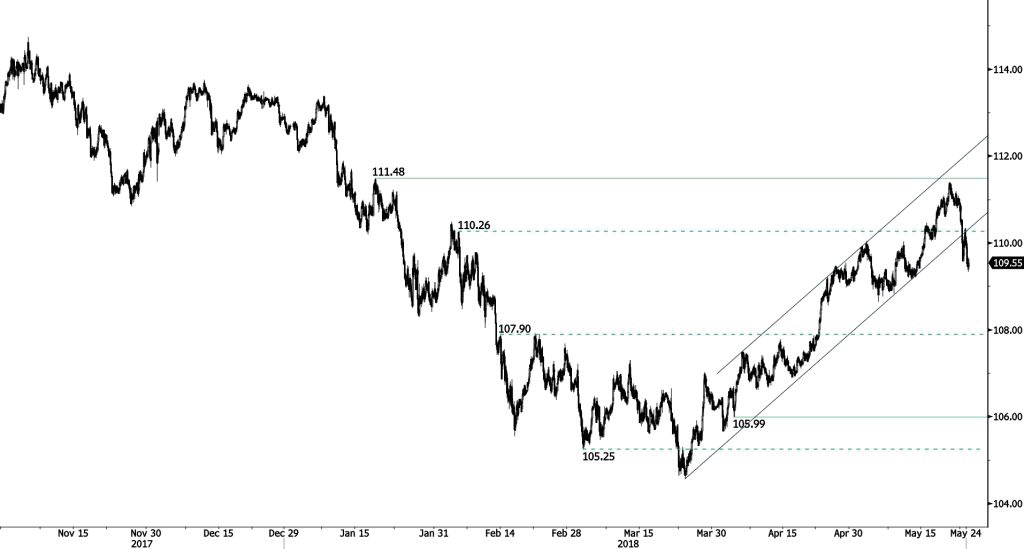
USD/JPY Breaks Uptrend Support
USD/JPY has breached the key uptrend support at 110.15. The short-term technical structure is negative. Strong support and resistance are located at 108.74 (25/01/2018 low) and 111.48 (18/01/2018 high). The technical structure suggests short-term sideways trading moves.
We favor a long-term bearish bias. Support remains at 101.20 (09/11/2016 low). A gradual rise toward the major resistance at 125.86 (05/06/2015 high) seems unlikely. Expected to decline further support at 101.20 (09/11/2016 low). The pair trades slightly above its 200 DMA.
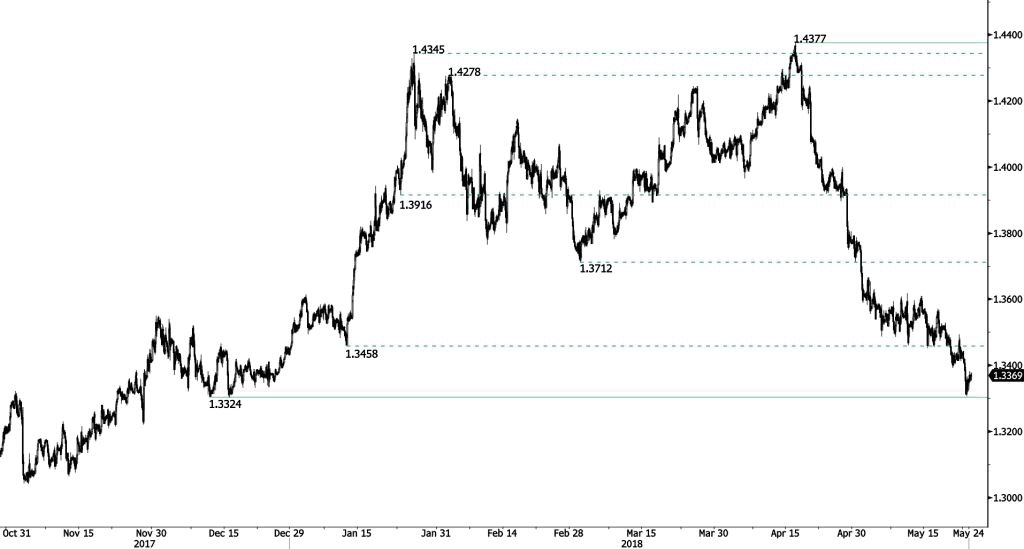
GBP/USD Trying To Bounce
GBP/USD is trying to bounce near the 1.03324 strong support. Hourly support and resistance are given at 1.3324 (19/12/2017 low) and 1.3458 (11/01/2017 low. The technical structure suggests further downside.
The long-term technical pattern is reversing. The Brexit vote had paved the way for further decline but the pair is moving to 2016 highs. Long-term support and resistance are given at 1.1841 (07/10/2017 low) and 1.5018 (24/06/2016 high).
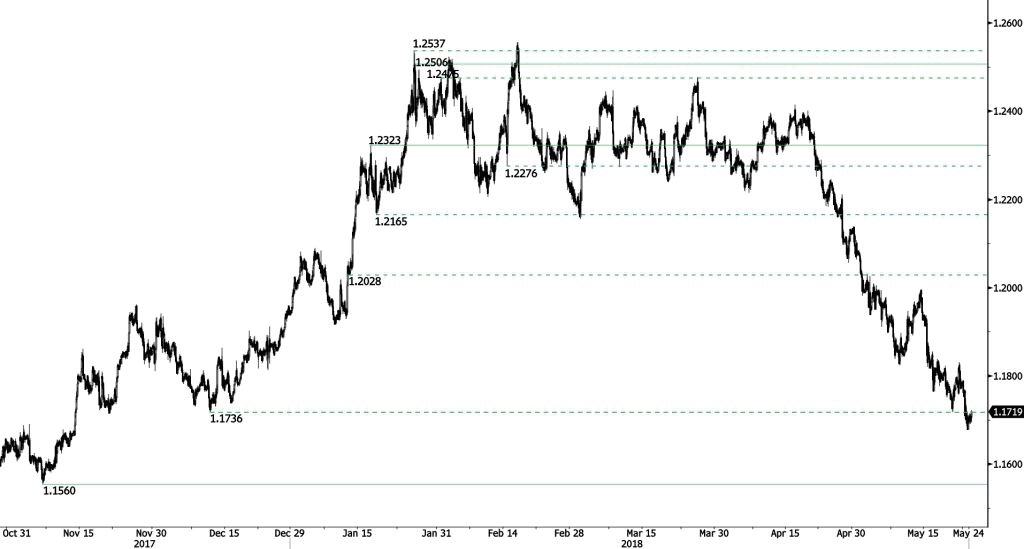
EUR/USD Remains Weak
EUR/USD has breached the key support at 1.1736 (12/12/2017 low). The short-term technical structure is negative as long as prices remain below the hourly resistance at 1.2036 (11/01/2017 low). Next key support and resistance are now given at 1.1720 (21/05/2017 low) and 1.2323 (17/01/2018 high).
In the longer term, the momentum is turning largely negative. We favor a continued bearish bias. Key resistance is holding at 1.2886 (15/10/2014 high) while strong support lies at 1.1554 (08/11/2017 low).
Bitcoin Thin Demand
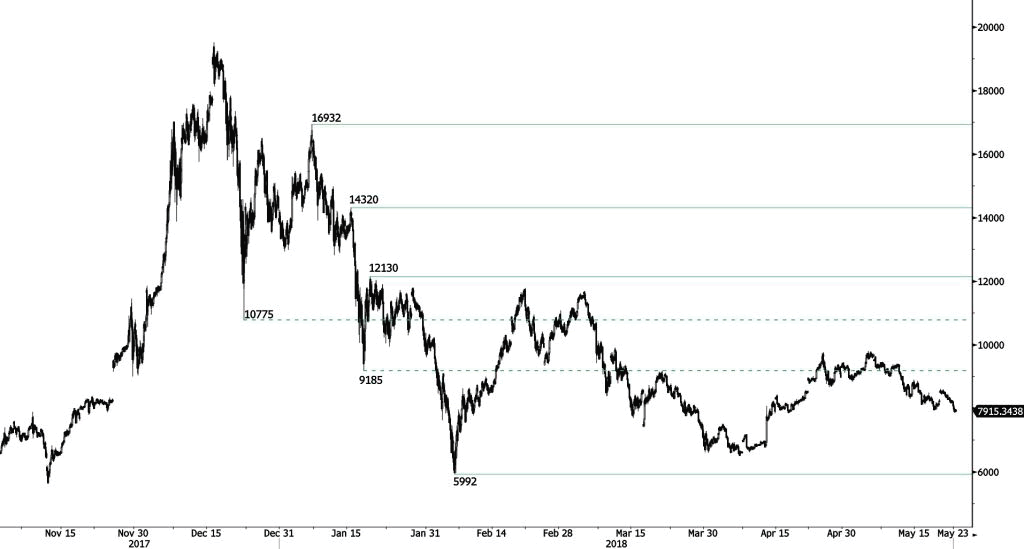
Bitcoin bullish momentum quickly faded suggesting persistent selling pressure. The pair is contained between strong support and resistance given at 6306 (13/11/2017 low) and 10232 (01/02/2018 high). The technical structure suggests short-term decrease.
In the long-term, the digital currency has had an exponential growth but also presented important downturns. There is decent likelihood that the currency could stabilize between 7'000 - 12'000 in 2018. Bitcoin is trading below its 200 DMA (8500 range).
USDJPY Outlook – Loss Of 200SMA Was Bearish Signal, Daily Cloud Twist Could Attract Further Weakness
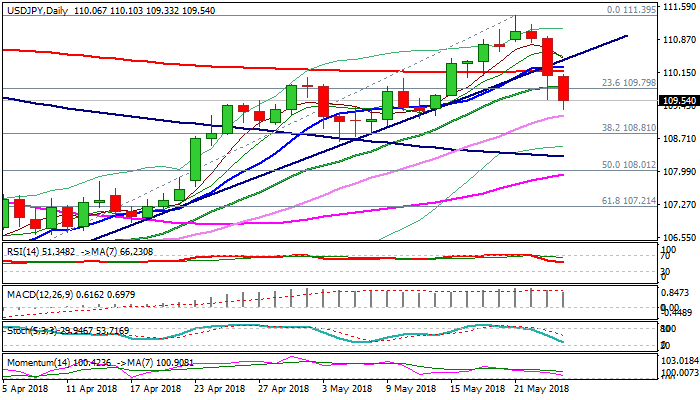
The dollar holds in red against yen for the second consecutive day and extended pullback on Thursday to new 1 ½ week low at 109.33.
The greenback came under pressure after markets saw minutes of Fed’s last meeting as more dovish than expected.
The minutes indicated that another rate hike could be expected if the US economic outlook remains positive, but eased expectation that the Fed would accelerate the pace of rate hikes.
Another factor that pressured the greenback were President Trump’s threats of imposing new tariffs on imported cars as well as doubts about meeting with North Korea’s leader.
Close below 200SMA (former pivotal barrier) was negative signal, as bearish extension on Thursday broke below 20SMA (109.82) and pressures rising 30SMA (109.21), loss of which would expose strong support at 108.81 (Fibo 38.2% of 104.63/111.39) and 108.64 (04 May trough).
Weakening momentum supports the notion along with daily cloud twist (107.20) which could attract for further weakness.
Broken 200SMA now acts as strong barrier (110.17), followed by broken trendline (110.42), which is expected to cap upticks and keep fresh bears in play.
Res: 109.82, 110.17, 110.27, 110.42
Sup: 109.21, 108.81, 108.64, 108.30
GBPUSD Outlook: Consolidates Above New Multi-Month Low, UK Retail Sales Eyed For Fresh Signals
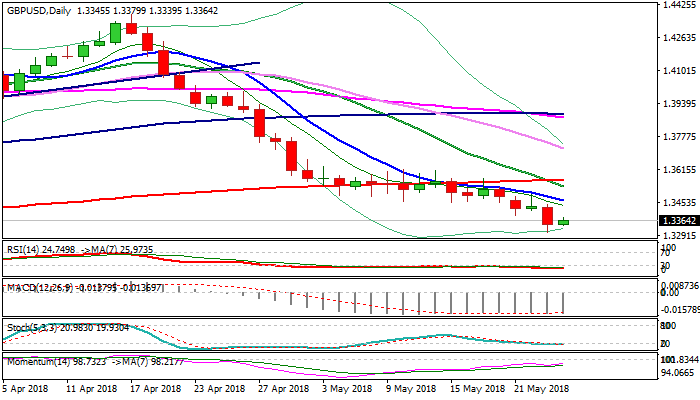
Cable trades within narrow consolidation on Thursday, holding above Wednesday's new low at 1.3305 (the lowest since mid-Dec), awaiting release of UK retail sales for fresh signal. Pullback from 1.4376 peak could extend further as strong bearish signal was generated on break below 1.3442 pivot (Fibo 38.2% of 1.1930/1.4376 recovery phase), as violation of top of thick weekly cloud 1.3205) would generate fresh bearish signal. Better than expected UK retail sales (Apr 0.8% f/c vs -1.2% prev) could spark stronger recovery for test of pivotal barrier at 1.3464 (falling 10SMA). Weaker dollar and positive signal from rising momentum support the notion, but overall outlook remains bearish.
Res: 1.3380, 1.3451, 1.3464, 1.3491
Sup: 1.3339, 1.3305, 1.3250, 1.3205
EURUSD Outlook – Falling 10SMA Should Cap Current Consolidation
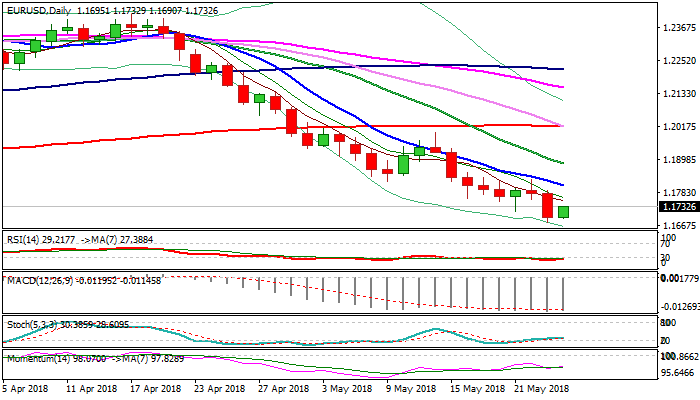
The Euro moved higher on Thursday in modest recovery from new low at 1.1675 (the lowest since 14 Nov 2017) after bears tested strong support at 1.1675 (top of thick daily cloud).
Overall structure remains bearish, with concerns about economic slowdown in the EU and political uncertainty in Italy, additionally weighing on the single currency.
Bears may take a breather above weekly cloud before continuing lower, as rising momentum and sideway-moving slow stochastic warn.
Recovery attempts are expected to be limited and capped under pivotal barriers at 1.1806 (falling 10SMA) and 1.1830 (Tuesday’s high).
Res: 1.1752, 1.1789, 1.1806, 1.1830
Sup: 1.1690, 1.1675, 1.1662, 1.1600
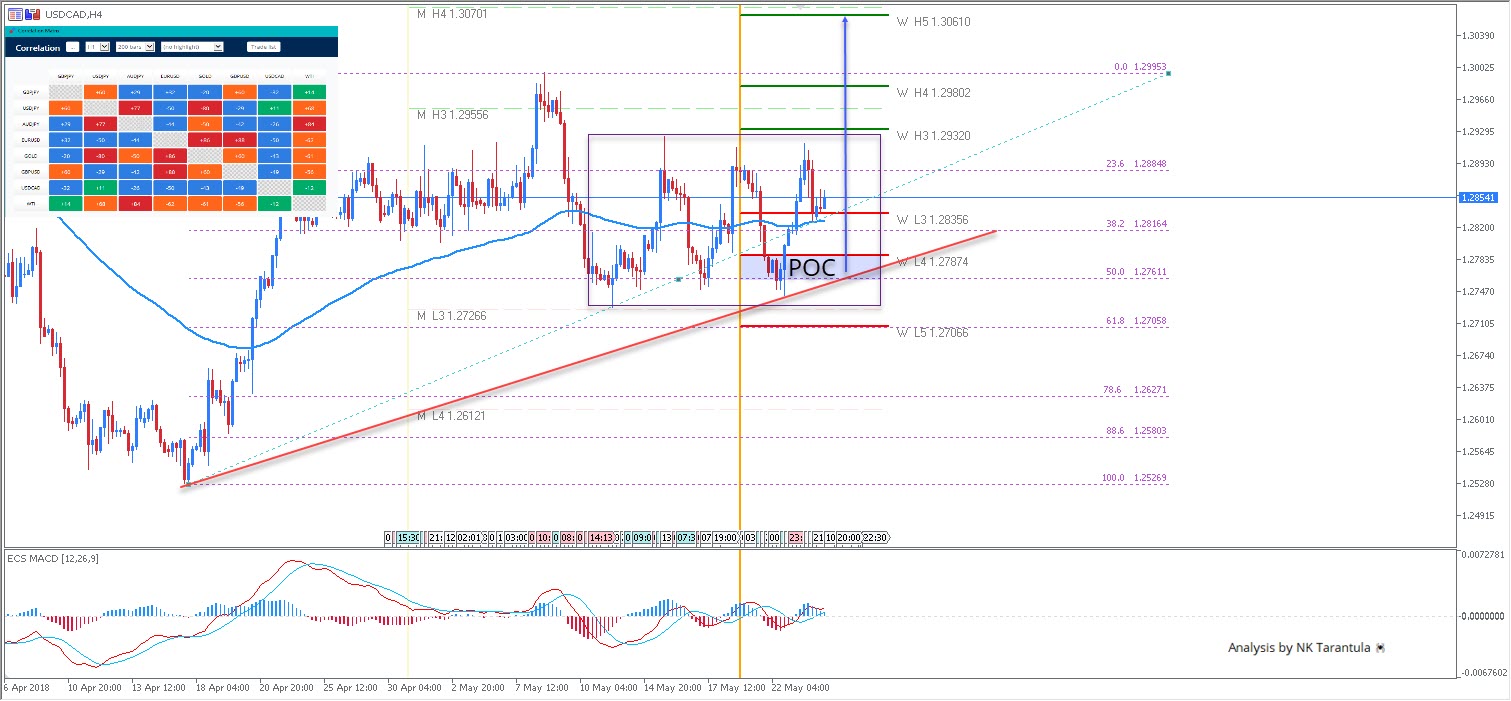
USD/CAD Rectangle Consolidation Above Ascending Trend Line
The USD/CAD has been consolidating within the rectangle range above M L3 pivot point. Consolidation is also between the W L3 and H3 above the ascending trend line, so I assume the price is still bullish. 1.2760-1.2787 is the POC zone and we might expect a bullish bounce once the price retests the zone. However, if the candle breaks and closes above W H3 -1.2932 we should see a continuation to the upside targeting 1.2980 and 1.3060.
W L3 - Weekly Camarilla Pivot (Weekly Interim Support)
W H3 - Weekly Camarilla Pivot (Weekly Interim Resistance)
W H4 - Weekly Camarilla Pivot (Strong Weekly Resistance)
D H4 - Daily Camarilla Pivot (Very Strong Daily Resistance)
D L3 – Daily Camarilla Pivot (Daily Support)
D L4 – Daily H4 Camarilla (Very Strong Daily Support)
POC - Point Of Confluence (The zone where we expect price to react aka entry zone)
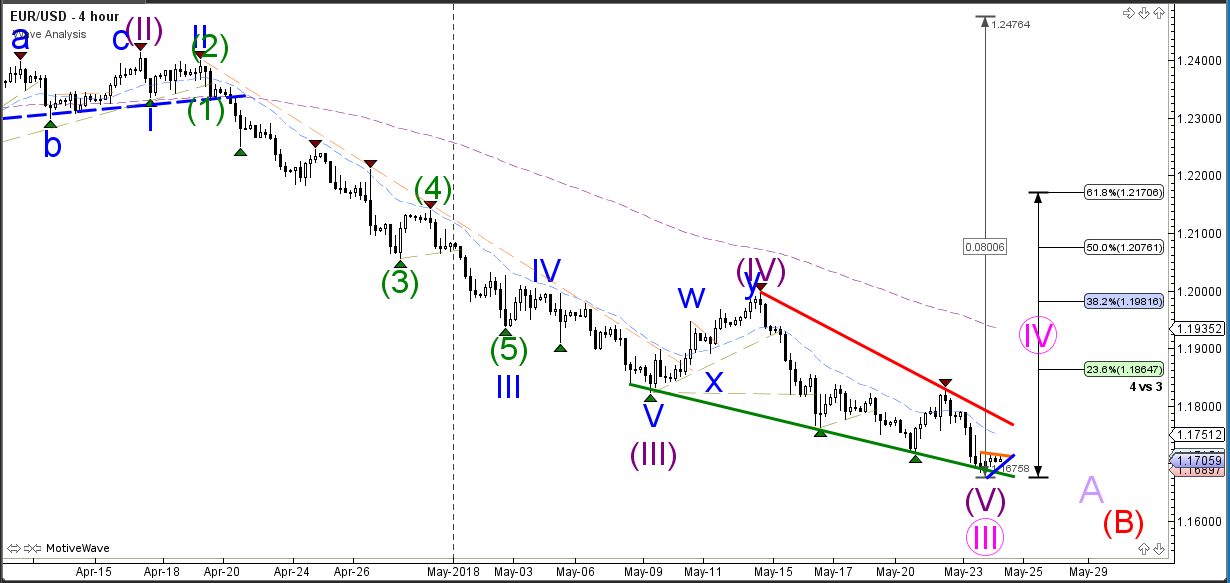
EUR/USD Bearish Break And Continuation Expected Below 1.1750
The EUR/USD challenged and broke below the 1.1750 support zone and price continued with the downtrend yesterday. Price would need to break below the support trend line (green) and 1.1675 before a new bearish continuation could be expected whereas a bullish break above the resistance trend line (red) could indicate a larger bullish retracement within wave 4 (pink).
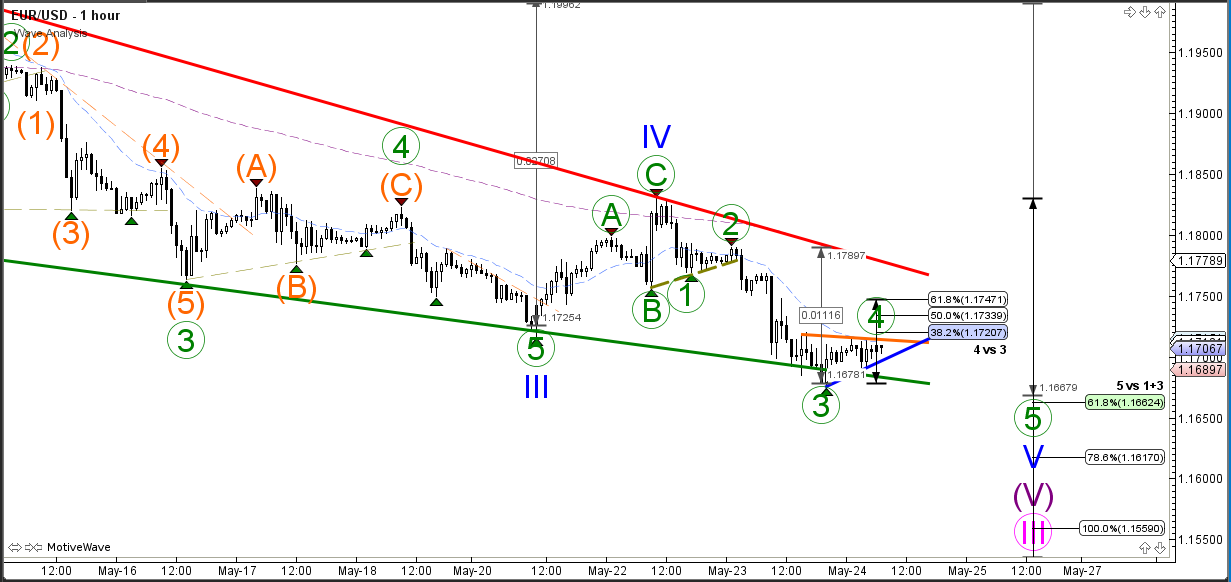
The EUR/USD is most likely building a wave 4 (green) correction as long as price stays below the 61.8% Fibonacci retracement level of wave 4 vs 3. A break above the 61.8% and bottom of wave 1 invalidates the current wave patterns. A bearish break below the support trend lines could see a bearish breakout towards the Fibonacci targets of wave 5.
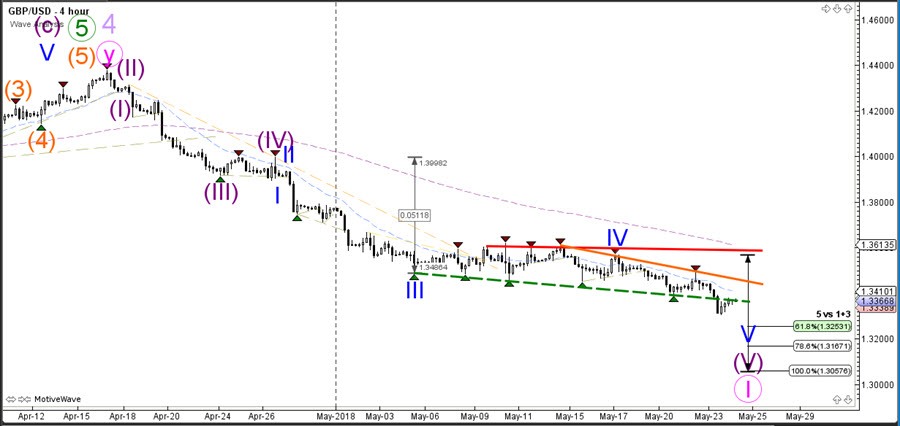
GBP/USD Wave 4 Retracement Reaches Bearish Reversal Zone
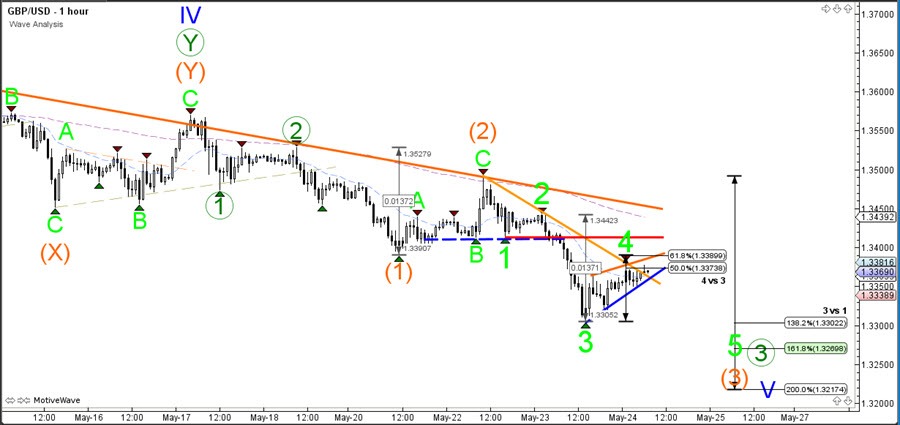
The GBP/USD broke below the support trend line (dotted green) and important 1.3380-1.34 Fibonacci support zone. The bearish breakout makes a continuation lower more likely, especially if price bounces at the broken support that now could act as resistance.
A bearish continuation could see price move lower towards the Fibonacci targets of wave 5. For the moment the bears remain in strong control and that would not change unless price breaks above the resistance trend lines (orange/red).
The GBP/USD could be building a corrective pattern within wave 4 (green). A bearish bounce at the Fibonacci retracement levels of wave 4 (green) could start the wave 5 (green) but a break below the support trend line (blue) is needed as a confirmation. A break above the 61.8% Fibonacci level of wave 4 (green) invalidates the current wave pattern.