Sample Category Title
GBP/AUD 4H Chart: Bears Market
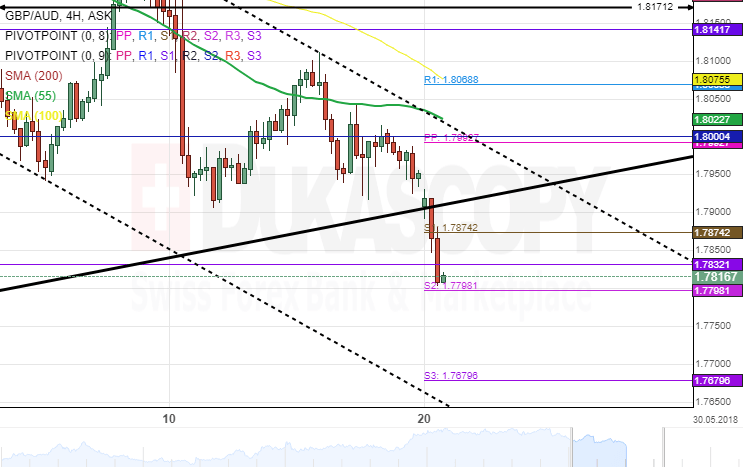
During the past one month, the British Pound has depreciated heavily against the Australian Dollar. The currency pair reversed from the upper boundary of a dominant ascending channel on April 28 and has reached two months low level.
A breakout has occurred through the lower boundary of the dominant ascending channel as can be observed on the chart. Also, the GBP/AUD exchange rate has continued to trade in a descending pattern and has provided confirmations on both sides that the rate is likely to decline further south.
Given that the aforementioned breakout had occurred, the currency exchange rate could continue to fall until it encounters a support set by the weekly pivot point near the 1.76 mark.
EUR/USD Analysis: Should Remain Calm
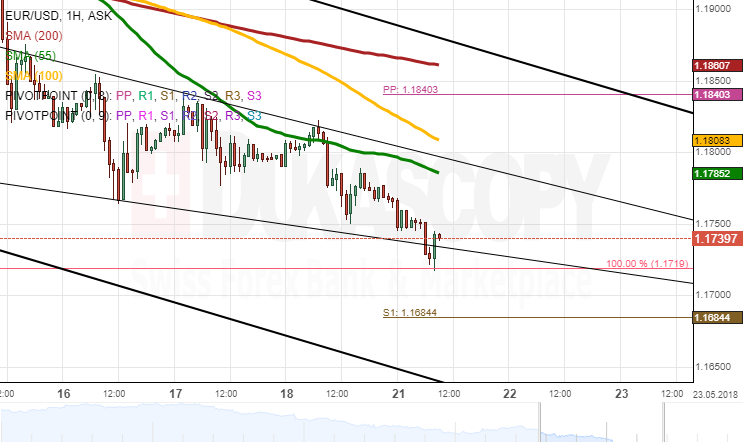
Despite attempting to edge higher early on Friday, the Euro lost momentum against the Greenback and thus had reached the 1.1740 mark on Monday morning. The 2018 low is located at 1.1720.
During the past trading sessions, the rate has been moving relatively sideways with a slight tendency south. The same situation might occur during this session, as well; however, no massive leaps either direction should occur due to several European banks being closed today.
Bears might try to push the rate down to the weekly S1 at 1.17, but a move below it is rather unlikely. If looking at the upside potential, the pair is expected to find strong resistance near 1.1820 where the 55– and 100-hour SMAs and the monthly S2 are located.
GBP/USD Analysis: Reaches New 2018 Low
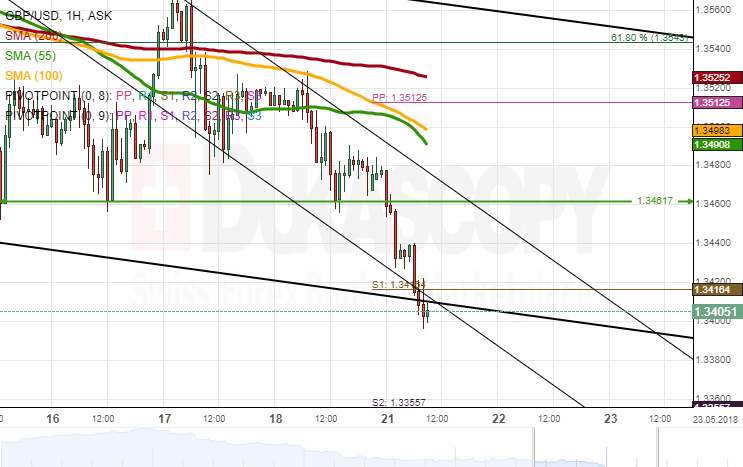
The Sterling continues to weaken against the US Dollar for the second consecutive session. As a result, the pair breached an important support level, which is also the 2018 low, at 1.3462.
On Monday morning, the Pound was trading near the weekly S1 and the bottom boundary of a three-week channel at 1.34. It is expected that the pair still edges lower down to this psychological mark during the first part of the day. However, the general direction should nevertheless be northwards this week. The nearest significant resistance is the 55-, 100– and 200-hour SMAs and the weekly PP circa 1.3515.
Given that no important data releases are scheduled for today, it is unlikely that the 1.3400/1.3515 range is breached in this session.
USD/JPY Analysis: Approaches Channel Line
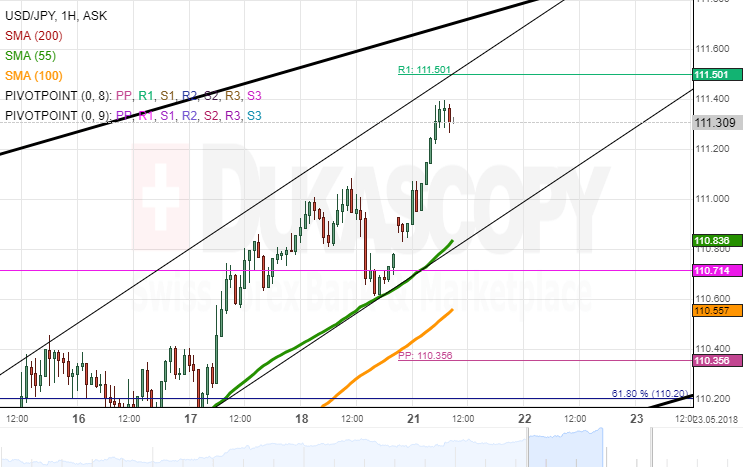
Strong upside risks remain dominant for the USD/JPY exchange rate, as the rate has been supported by the 55-hour SMA since early last week. This move up has formed a neat short-term channel in a more senior pattern.
The US Dollar strengthened during the first hours of Monday's trading session, thus being located near the weekly R1 and the upper boundary of the senior channel circa 111.60. Even if this level does not hold the rate, the monthly and weekly R2s at 112.10 should remain intact today, as technical indicators on the 4H ad 1D charts are pointing to a soon decline.
It is expected that the pair remains trading in the senior channel and thus reverses near the 111.80 area. Meanwhile, a fall below the 55-hour SMA at 110.70 should not occur today.
Gold Analysis: Still Lingers Near Senior Channel
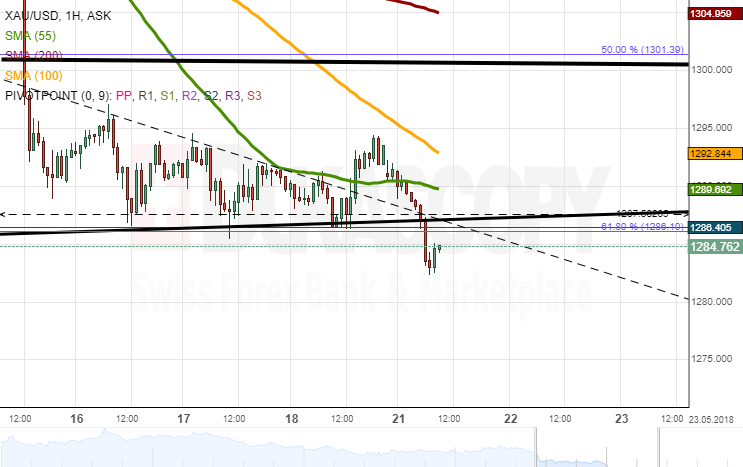
Gold managed to break out from the short-term triangle and consequently move above the 55-hour SMA mid-Friday. However, this strong bullish sentiment did not last long, as the rate had returned at the senior channel line and the 61.80% Fibonacci retracement near 1,286.00 by Monday morning.
It is likely that the 55-hour moving average continues to pressure the rate lower and past the senior channel. Apart from this nearest southern barrier, there are no other support levels until the monthly S2 at 1,275.00. Technical indicators flash bearish signals for this session. Even if a fall occurs, it should not exceed the aforementioned monthly S2.
Meanwhile, the 1,300.00 mark should likewise remain intact, limited by the 50.0% Fibo and another channel line.
USD/CAD: Canadian CPI
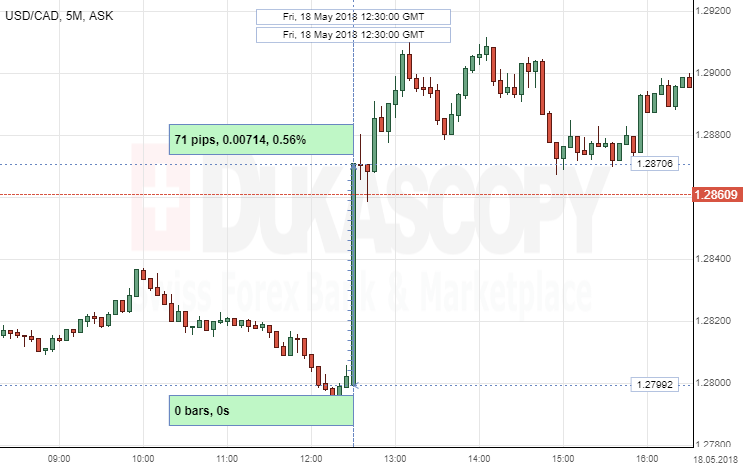
The Canadian Dollar weakened against the Greenback, following Canadian CPI data release on Friday. The USD/CAD currency pair gained 71 pips, or 0.56%, to continue fluctuating in the 1.2880 area.
The Statistics Canada simultaneously released seven data sets, where Consumer Price Index came in line with economists expectations of 0.3% in month-to-month basis for the period of April.
However, USD/CAD currency change in the market was made due to other data releases, such as Core Retail Sales, which came lower-than-expected of negative 0.2%, instead of the forecast of 0.5% and 0.0% in the previous period.
Forex Technical Analysis: EUR/USD, USD/JPY, GBP/USD
EUR/USD
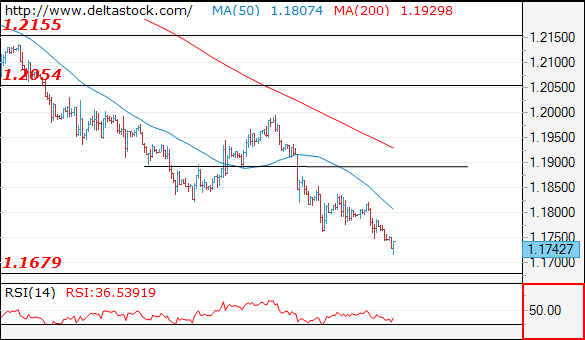
Current level - 1.1742
The downtrend has been renewed, currently heading towards 1.1680. Initial resistance lies at 1.1760, followed by the crucial 1.1820.
| Resistance | Support | ||
| intraday | intraweek | intraday | intraweek |
| 1.1760 | 1.2000 | 1.1680 | 1.1680 |
| 1.1820 | 1.2160 | 1.1480 | 1.1480 |
 USD/JPY
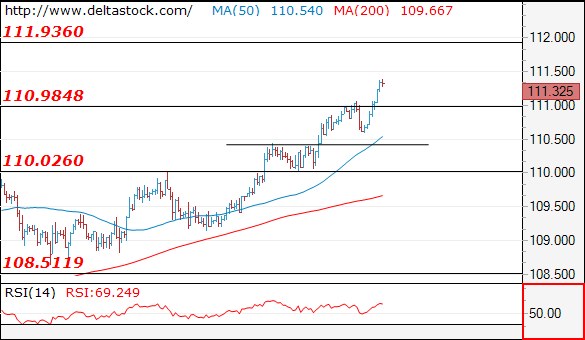
Current level - 111.35
The recent pullback has been limited above 110.50 and the downtrend is renewed, towards 111.90 zone. Initial intraday support is projected at 111.00 and crucial on the downside is 110.60.
| Resistance | Support | ||
| intraday | intraweek | intraday | intraweek |
| 111.90 | 111.90 | 111.00 | 110.00 |
| 111.90 | 114.40 | 110.60 | 108.50 |
GBP/USD
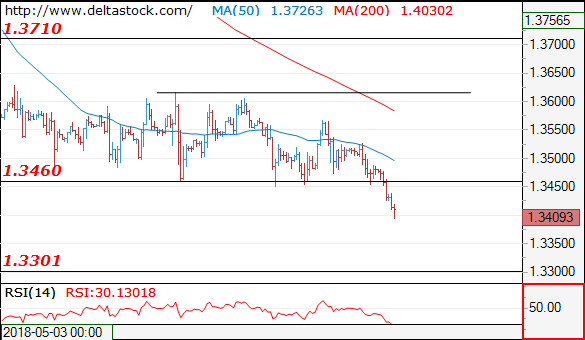
Current level - 1.3409
The violation of 1.3460 has cleared the road for a dip to 1.3300 zone. Key resistance lies at 1.13460 and crucial on the upside is 1.3570 peak.
| Resistance | Support | ||
| intraday | intraweek | intraday | intraweek |
| 1.3460 | 1.3990 | 1.3390 | 1.3310 |
| 1.3570 | 1.4100 | 1.3310 | 1.3310 |
Turkish Lira Hit New Historical Low And May Fall Further If CBRT Doesn’t Hike
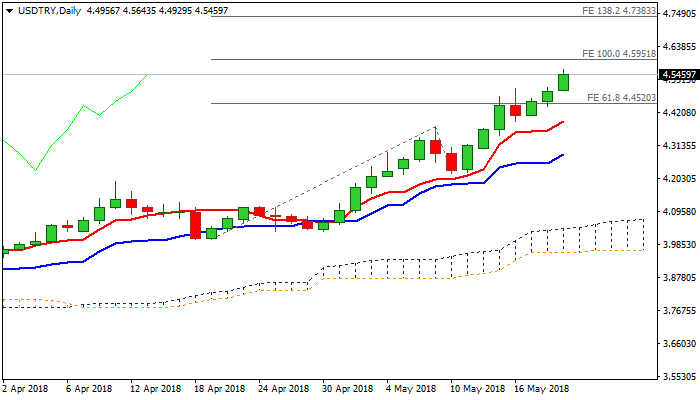
The USDTRY hit new record high at 4.5643 in early trading on Monday, extending steep upleg from 3.7153 (2018 low), as the pair advanced nearly 19% since the beginning of the year.
nother easy break through psychological barrier (4.50 in this case) signals that there are very little obstacles for lira to weaken further, as Turkey is sliding into crisis. Analysts agree that such scenario would be fully home-made as Turkey's central bank has all tools to stabilize the situation.
The problem appears in divergence between President Erdogan's view about the interest rate, as he supports lower interest rates and CBRT, who needs to increase rates in respond to two-digit inflation and slow down lira's steep fall.
If the central bank does not hike rates, following recent meeting of President Erdogan with his economy team, scenario for lira would remain disastrous.
The pair is currently riding on the third wave of five-wave cycle from 4.0051 (19 Apr low) which eyes its 100% Fibonacci expansion (4.5951) to verify wave principles.
Break higher could extend rally towards FE 138.2% at 4.7833.
Broken psychological 4.50 barrier now acts as support which should contain dips.
Res: 4.5643, 4.5951, 4.6000, 4.6228
Sup: 4.5328, 4.5000, 4.4929, 4.4675
UK 100 And EURCAD
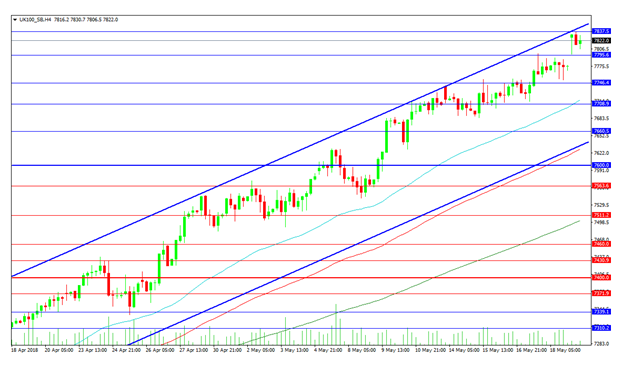
The UK 100 Index has put together a stellar performance, with a breakout higher today to a new high. The pre market high comes in at 7837.5 with support in the area of the 7800.00 level. A continued bullish move would go on to test 7850.00 followed by 7900.00. Ultimately the 8000.00 level remains a major goal for bulls to reach with the possibility of a significant number of shorts waiting at that level. In the near term it is possible that the gap higher over the weekend gets filled before a new leg higher begins. A failure to do so structurally weakens the subsequent leg up and can fire the bellies of bears around 8000.00.
Support comes in at the close from Friday at 7775.0 with further support positioned around the 7750.00 area. A break down to the 50 period MA at 7716.00 could provide a decent opportunity for bulls. The bullish trend line can be encountered at 7633.30 with the 100 period MA at 7628.80 close-by. A loss of the 7600.00 level can alter the dynamic of the market with a retest of the 200 MA at 7500.00 needing to hold to prevent a deeper retracement to 7400.00.
UK 100 4 Hour chart
EURCAD
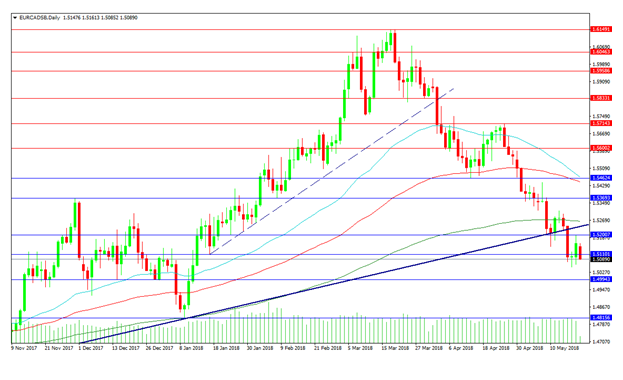
The EURCAD pair has seen a loss of its trend line support last week with the EUR exerting influence on the chart in the face of rising Oil prices and NAFTA headlines. The pair rallied on Friday but the 1.52000 level has become too strong and price is now trading down at 1.50890. This leaves the 1.50000 area to do the heavy lifting and prevent a full rout in the pair. This could turn out to be too much for the pair with the January low being eyed by shorts at 1.48156. Further losses could see the September swing low at 1.44413 tested.
Resistance at the trend line comes in at 1.52355 with the 200 DMA at 1.52640. The 1.53693 level also forms resistance and a swing high from late 2017 with a move above this level targeting the 100
and the 50 DMAs around the 1.54624 area. A successful move above this area would see the late April high at 1.57143 tested as resistance.
EURCAD Daily chart
Gold Posts New Trough Near 1282, Bearish In Short And Medium-Term
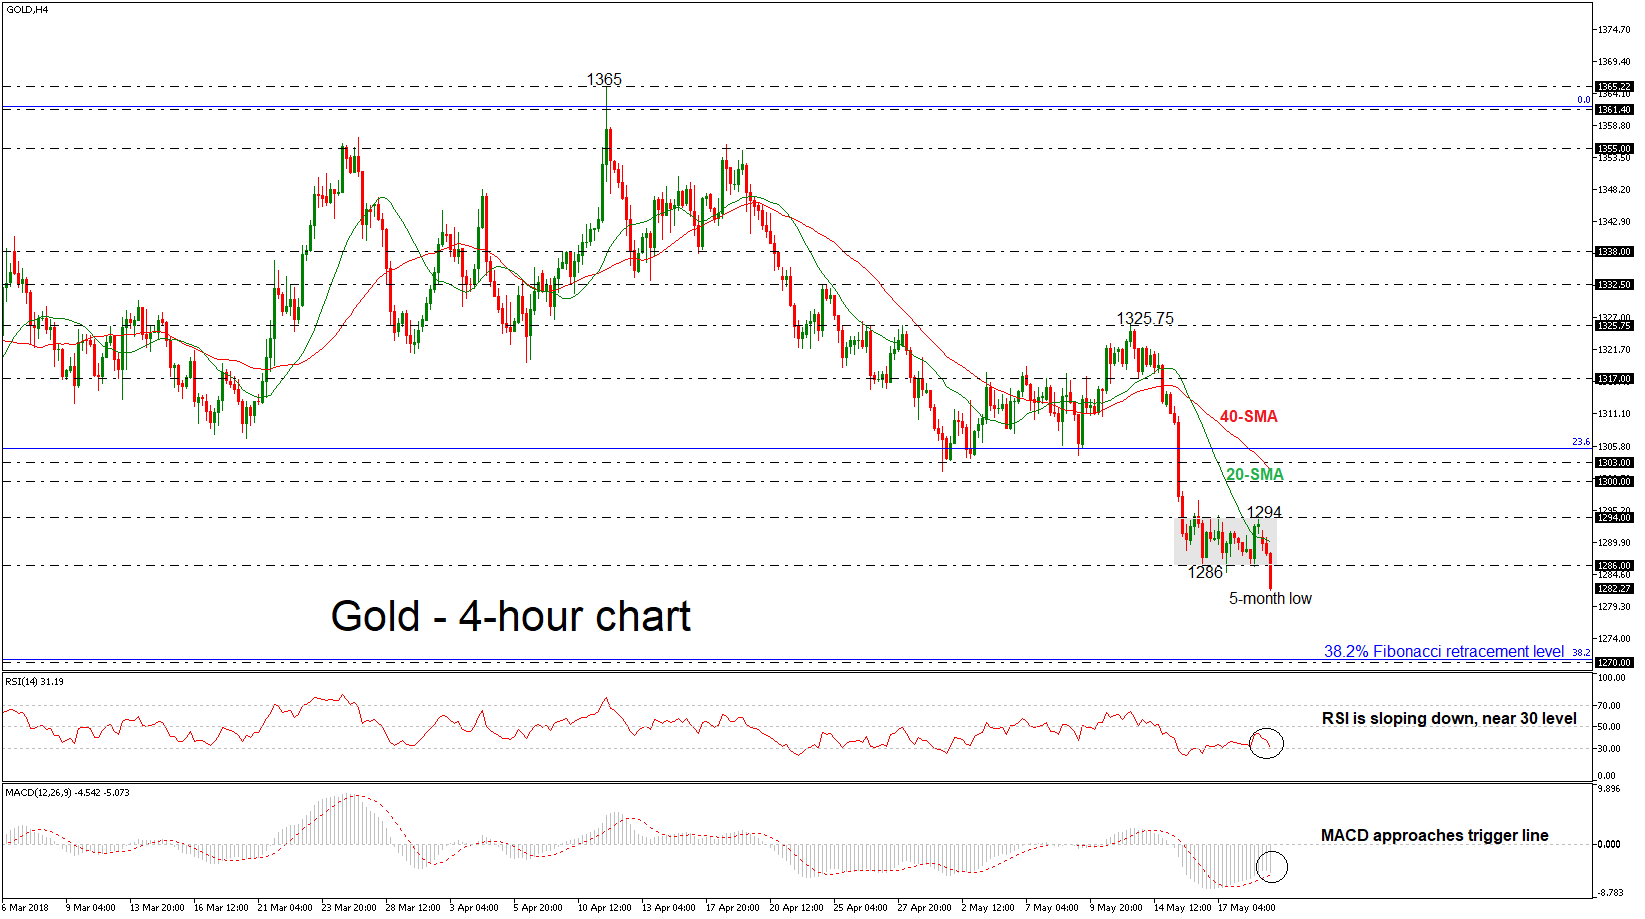
Gold is on course to post a strong trading day of losses, which have taken the price towards a fresh five-month low of 1281.96. The sharp sell-off, especially in the past week, has shifted the near-term bias from neutral to negative. The momentum indicators are supportive of the bearish picture in the 4-hour chart.
The RSI is currently increasing negative momentum towards its 30 level and is approaching the oversold level, while the MACD oscillator is moving lower below the zero line, both hinting that the next move in prices could be further to the downside.
Should the market extend losses, as the price slipped below the narrow range of 1286 – 1297, support would be met at the 1270 barrier, which overlaps with the 38.2% Fibonacci retracement level of the upleg from 1122 to 1355. A significant leg below this area could open the way towards the 50.0% Fibonacci near 1242.
On the flip side, if the pair bounces up, immediate resistance could be met at the 1294 resistance level. A jump above this zone could extend gains until the 1300 – 1303 region, where the 40-simple moving average (SMA) holds within this area.
In the bigger picture, the precious metal is bearish as long as it holds below the SMAs and has plunged below 1286 over the last hours.