Sample Category Title
US Pompeo outlined steep demand for Iran, or the strongest sanctions in history
US Secretary of State Mike Pompeo outlined a list of demand for Iran to comply to, and threatened the country with "the strongest sanctions in history" if Iran doesn't change course.
12 requirements were listed out. Some include:
- Iran must "stop enrichment" of uranium
- Iran must also allow nuclear "unqualified access to all sites throughout the country."
- Iran must declare all previous efforts to build a nuclear weapon
- Iran must cease from a range of activities throughout the Middle East that have long drawn the ire of the U.S. and its allies.
- Iran must end support for Shiite Houthi rebels in Yemen,
- Iran must "withdraw all forces" from Syria, halt support for its ally Hezbollah and stop threatening Israel.
- Iran must also "release all U.S. citizens" missing in Iran or being held on "spurious charges".
Pompeo also added that "I know our allies in Europe may try to keep the old nuclear deal going with Tehran. That is their decision to make." But, 'they know where we stand."
Now, it's time for EU to respond.
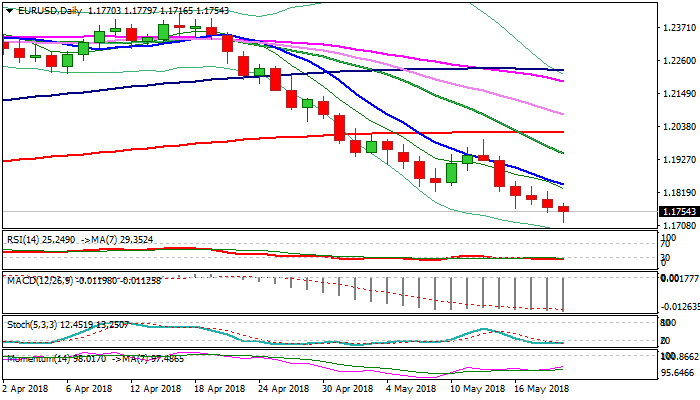
EURUSD – Bears Face Headwinds from Key 1.1709 Support But Upside Was So Far Limited
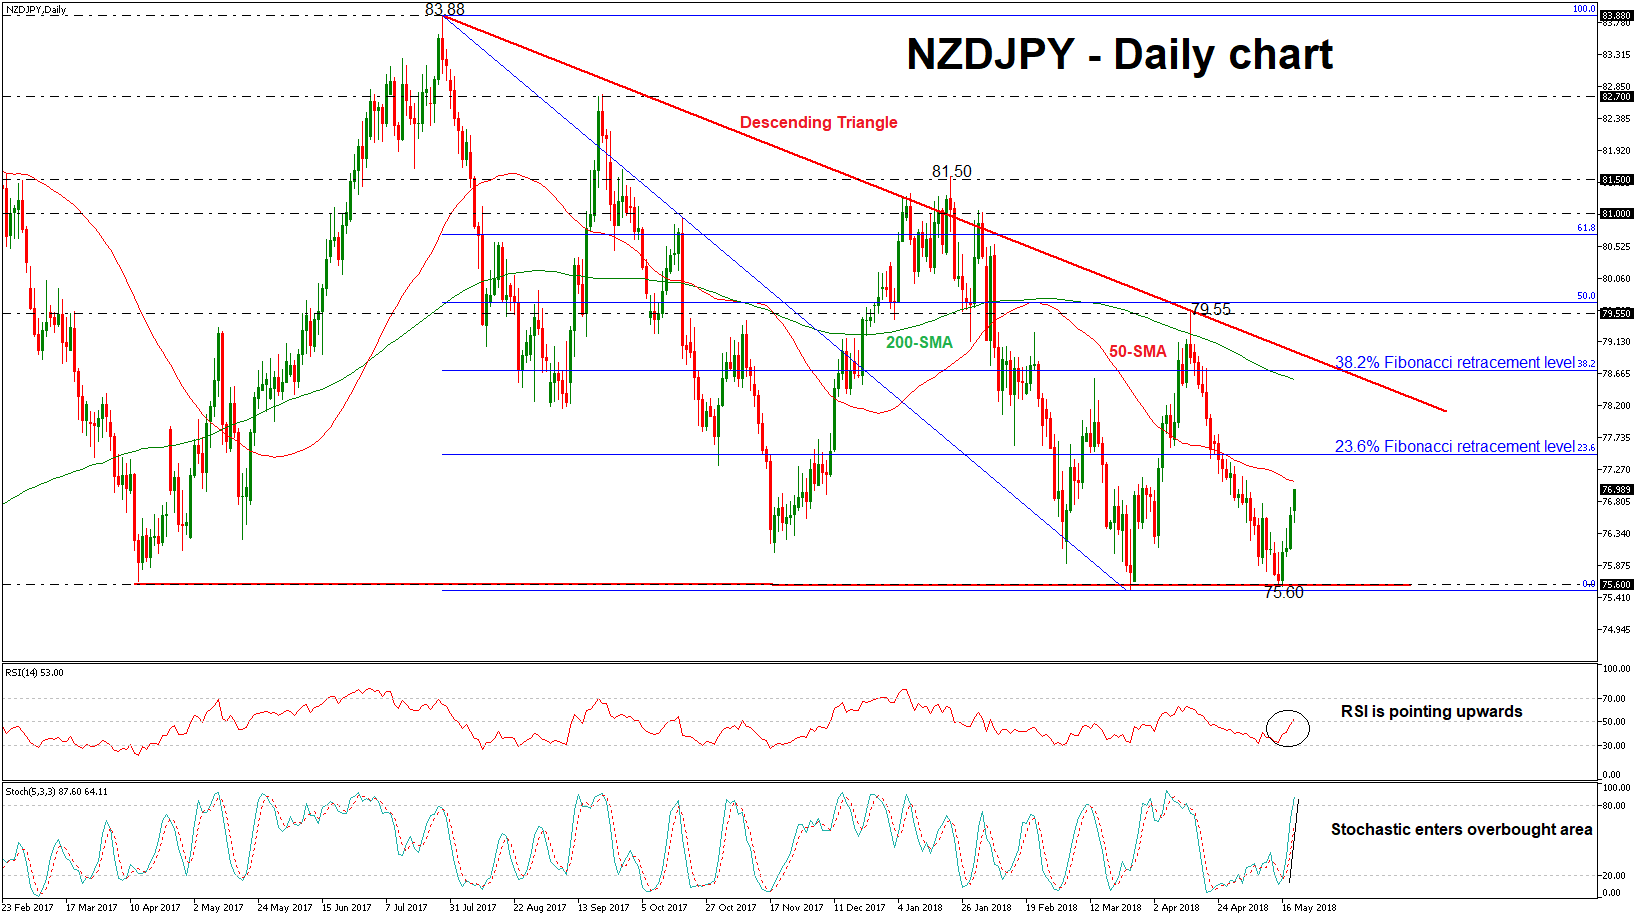
The Euro faced headwinds on approach to key 1.1709 support (Fibo 38.2% 1.0340/1.2555 rally) but recovery action was limited.
Conflicting indicators on daily chart (oversold RSI & slow stochastic are both in sideways mode while 14-d momentum heads north) were so far unable to generate stronger bullish signal.
Bounce from new multi-month low at 1.1716 showed signs of stall just ahead of initial resistance at 1.1782 (Fibo 23.6% of 1.1996/1.1716 bear-leg), keeping intact more significant barriers at 1.1822 (former low of 09 May / Fibo 38.2%) and falling 10 SMA (1.1845), as the latter was expected to cap extended upticks.
The pair may hold in extended consolidation before larger bears of 1.2555 peak continue, as violation of key supports at 1.1709 and 1.1675 (weekly cloud top) would spark stronger bearish acceleration.
Alternative scenario requires close above 10SMA to sideline bears and signal stronger recovery.
Res: 1.1782; 1.1822; 1.1845; 1.1889
Sup: 1.1716; 1.1709; 1.1675; 1.1662
Minneapolis Fed Kashkari: Fed should hike only to neutral policy stance
Minneapolis Fed President Neel Kashkari said in a article that "inflation and wage growth have been surprisingly low" despite tight job market. Now, wages is only growing at 2.7% annually, comparing to 3.5% before the financial crisis.
He pointed out that the headline unemployment rate in the US "captures" only those who are actively looking for jobs. Therefore, the 3.9% unemployment rate may not "capture the true slack" in the market. And "hidden slack" could explain the modest wage growth.
And Kashkari concluded that Fed should hike "only to a neutral policy stance, and not move too quickly". And that's until there are more evidence of wage growth and the US is "really" at maximum employment.
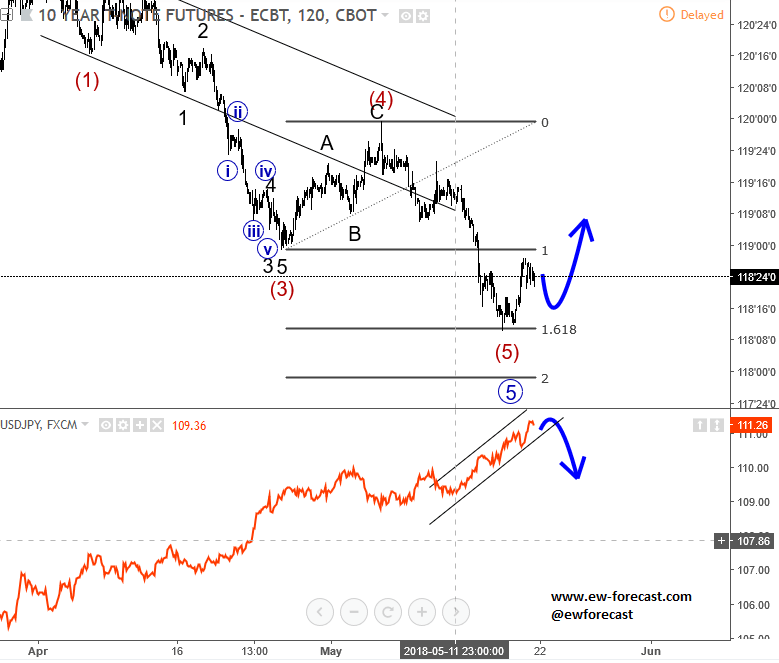
10 Year US Notes with Relation to USDJPY
10 year US notes moved nicely lower into a fifth wave in the last two weeks, riight into our Fibonacci extension levels, therefore we have to be aware of a bounce since we know that after every five waves market is expected to turn into the opposite direction. If 10 year US note would bounce, then at the same time we have to look on a possibly turn down on USDJPY, especially if channel connected from May 11th on USDJPY is broken to the downside.
USD/JPY Mid-Day Outlook
Daily Pivots: (S1) 110.55; (P) 110.82; (R1) 111.02; More...
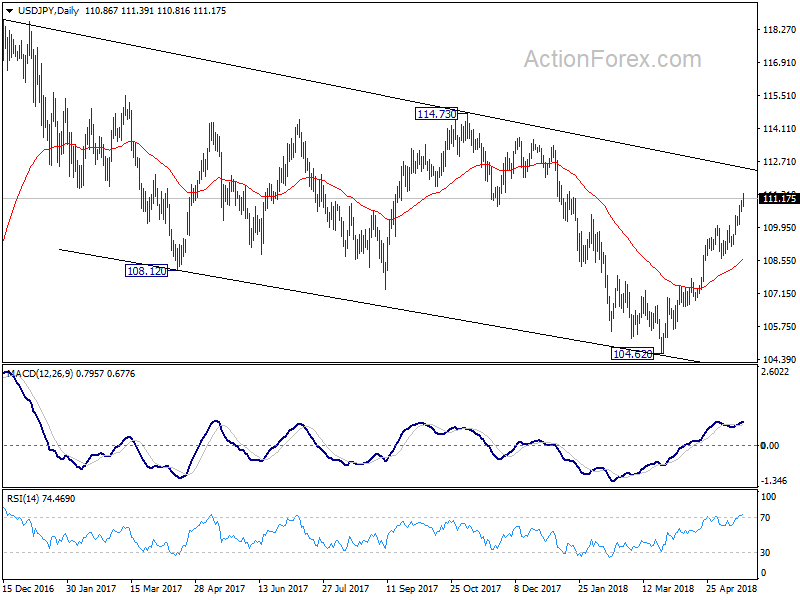
Intraday bias in USD/JPY remain son the upside. Current rally should extend to trend line resistance at 112.33. Firm break there will target 114.73 resistance next. On the downside, below 110.60 minor support will turn bias neutral again and bring consolidations. But strong support should be seen from 109.14/110.02 support zone to bring rally resumption.
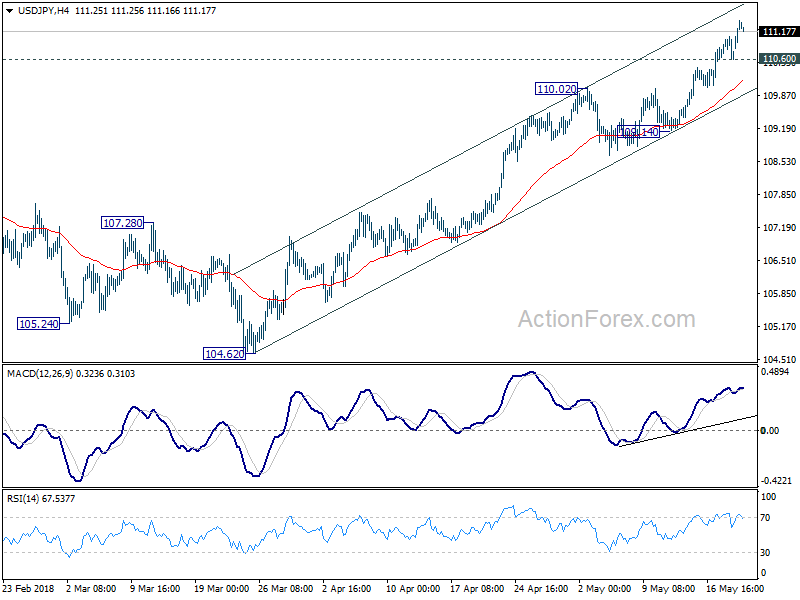
In the bigger picture, corrective decline from 118.65 (2016 high) has completed with three waves down to 104.62. Rise from 104.62 is possibly resuming the up trend from 98.97 (2016 low). This will be the preferred case as long as 55 day EMA (now at 108.65) holds. Decisive break of 114.73 resistance will confirm our view and target 118.65 and above.
USD/CHF Mid-Day Outlook
Daily Pivots: (S1) 0.9943; (P) 0.9983; (R1) 1.0015; More...
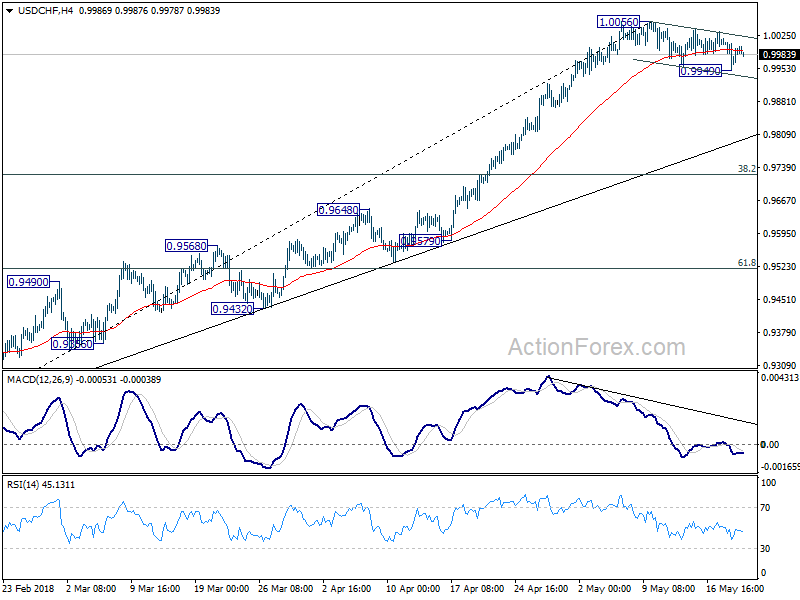
Intraday bias in USD/CHF remains neutral at this point. Correction from 1.0056 could extend with another fall. But we'd expect strong support from trend line (now at 0.9799) to contain downside to bring rebound. On the upside, firm break of 1.0056 will confirm rise resumption for 1.0342 key resistance.
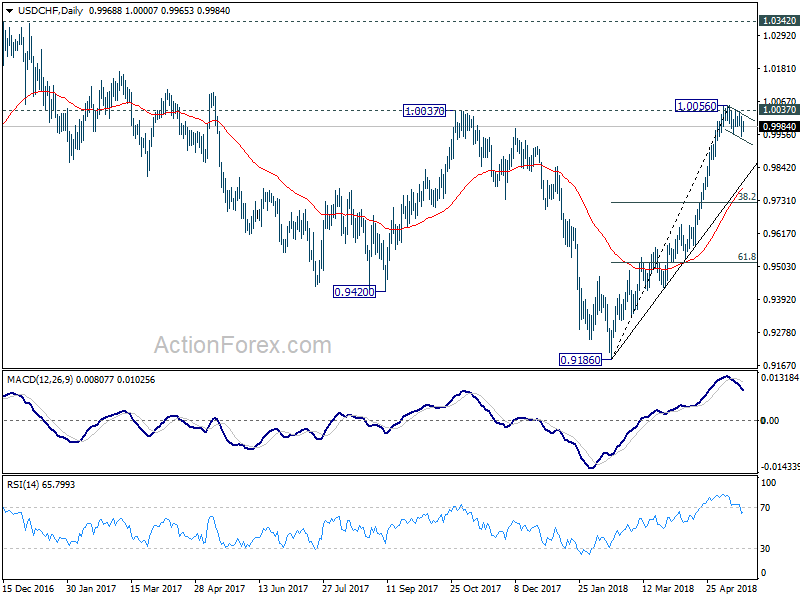
In the bigger picture, medium term decline from 1.0342 has completed with three waves down to 0.9186. Rise from there is currently viewed as a leg inside the long term range pattern. Hence, while further rally would be seen, we'd be cautious on strong resistance from 1.0342 to limit upside. For now, further rise is expected as long as 38.2% retracement of 0.9186 to 1.0056 at 0.9724 holds.
EUR/USD Mid-Day Outlook
Daily Pivots: (S1) 1.1739; (P) 1.1782 (R1) 1.1814; More....
EUR/USD recovers after dipping to 1.1716 but intraday bias remains on the downside. Sustained break of 38.2% retracement of 1.0339 to 1.2555 at 1.1708 will target 50% retracement at 1.1447 next. However, considering possible bullish convergence condition in 4 hour MACD, break of 1.1821 minor resistance will suggest short term bottoming and bring stronger rebound back to 1.1995 resistance.
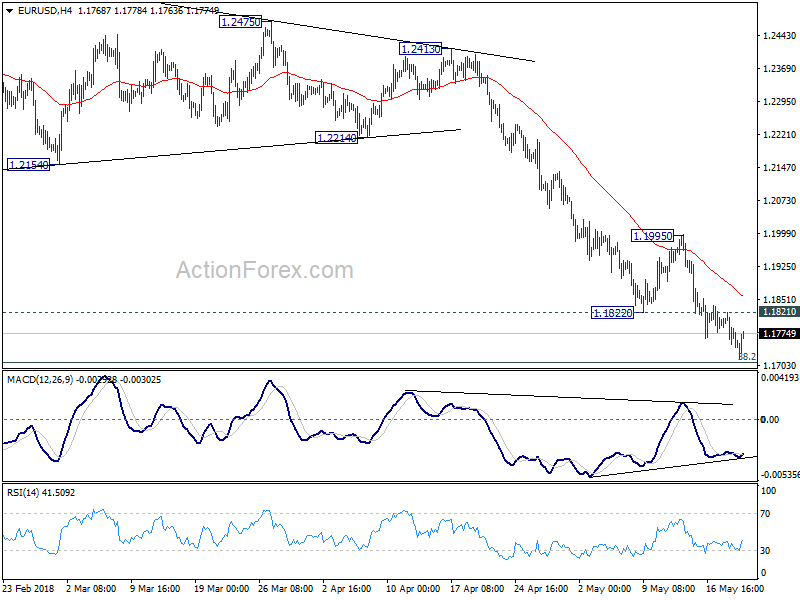
In the bigger picture, current development suggests that EUR/USD was rejected by 38.2% retracement of 1.6039 (2008 high) to 1.0339 (2017 low) at 1.2516. And, a medium term top was formed at 1.2555 already. Decline from there should extend further. Break of 38.2% retracement of 1.0339 to 1.2555 at 1.1708 will pave the way to 61.8% retracement at 1.1186. For now, even in case of rebound, we won't consider the fall from 1.2555 as finished as long as 55 day EMA (now at 1.2113) holds.
NZDJPY Rebounds on 75.60 and is Set to Post Another Green Day; Holds in Descending Triangle in Long-Term
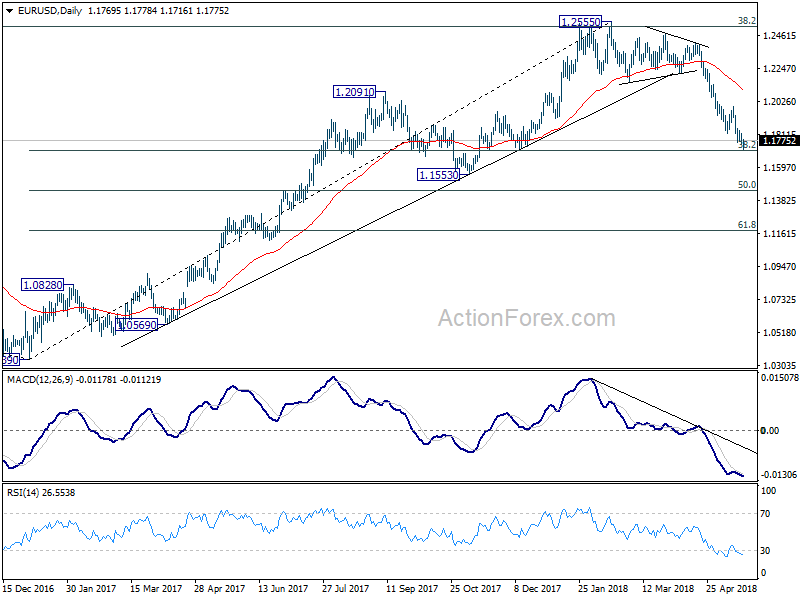
NZDJPY has reversed back up again after finding support at the 11-month low of 75.60, achieved on March 23. This low is the lower boundary of the descending triangle in the long-term timeframe and currently, the pair is set to record the fourth consecutive green day.
Momentum indicators are pointing north to a positive bias in the short-term with the RSI indicator just above the 50 threshold. The stochastic oscillator is moving strongly upwards as the %K line entered the overbought zone and the %D line is following this momentum, underscoring the current upside reversal.
Further gains should see the 23.6% Fibonacci retracement level of 77.50 of the downleg from 83.88 to 75.51 come into scope. The next level to have in mind is the 38.2% Fibonacci region of 78.70, which stands near the 200-day SMA. A climb above this level would reinforce the bullish structure in the near-term.
In the event of the continuation of the downside trend, the 75.60 trough could act a barrier before being able to break the triangle formation. A drop below this area would endorse the bearish outlook and would take the pair towards the 73.70 support barrier, identified by the low of November 2016.
In the long-term timeframe, NZDJPY has been developing within a descending triangle since April 2017, with a weak penetration to the upside in January 2018.
Japanese Yen Dips as Trade War Tensions Ease
The Japanese yen has started the week with losses. Currently, USD/JPY is trading at 111.28, up 0.48% on the day. On the release front, Japan’s trade surplus was unexpectedly strong at JPY 0.55 trillion, crushing the estimate of 0.11 trillion. In the US, the sole event is a speech from FOMC member Raphael Bostic. On Tuesday, the US releases the Richmond Manufacturing Index. Japan will publish BoJ Core CPI and Flash Manufacturing PMI.
After weeks of an escalating trade war between the US and China, there was a breakthrough of sorts on Sunday. The US dollar has posted gains after Treasury Secretary Steven Mnuchin announced that the two sides had made significant progress and the trade war was being ‘put on hold’. Just last week, the White House sounded pessimistic about a deal being reached with China. The two economic giants had traded stiff tit-for-tat tariffs in recent weeks, worth billions in trade. These moves had raised fears of a bilateral trade war between the two largest economies in the world. The respite in tariffs means that the US can sit down with the Chinese and discuss the US trade deficit with China, which President Trump has long complained is a result of a non-level playing field with China. The news that the sides had backed down sent stock markets higher, and traders will likely be greeted with gains when European markets reopen on Tuesday.
Is the Bank of Japan looking to exit from its ultra-accommodative stimulus program? The cautious central bank will certainly move carefully. Any steps will be small and incremental in nature, in order not to rattle the markets or the yen exchange rate. The bank took one such step in April when it removed a deadline for hitting its inflation target of around 2 percent. Currently, BoJ policymakers are looking to raise bond yields from their near-zero levels as part of normalizing monetary policy. The stimulus program was introduced in 2013, when a confident BoJ Governor Kuroda claimed that he would reach the inflation target within two years. Fast forward to 2018, and the inflation target remains elusive, despite the bank spending trillions of yen in stimulus. The Japanese economy has shown some improvement, which will make it easier for the BoJ to exit from its radical easing policy. Still, traders should be prepared for small, incremental steps towards this end.
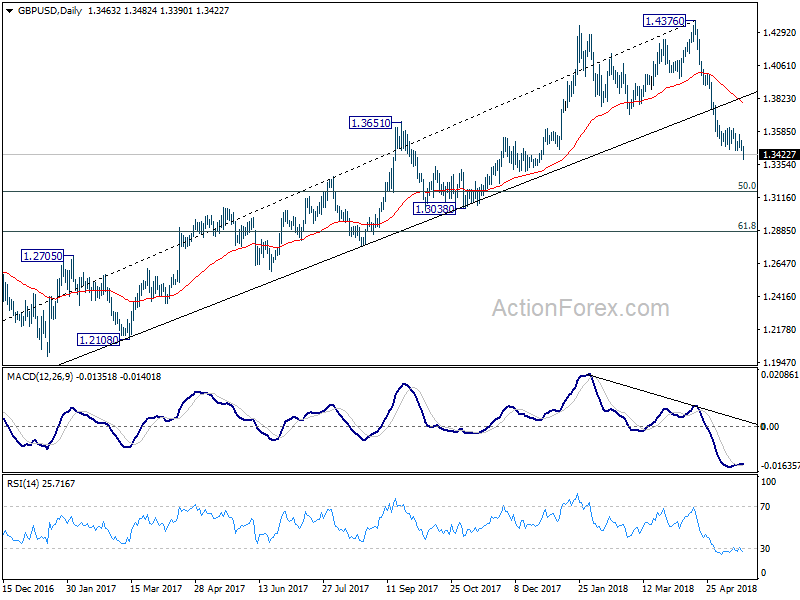
GBP/USD Mid-Day Outlook
Daily Pivots: (S1) 1.3442; (P) 1.3485; (R1) 1.3515; More...
Intraday bias in GBP/USD remains on the downside as fall from 1.4376 is in progress. Next target will be 50% retracement of 1.1946 to 1.4376 at 1.3161. On the upside, break of 1.3568 resistance is needed to indicate short term bottoming. Otherwise, outlook will remain bearish in case of recovery..
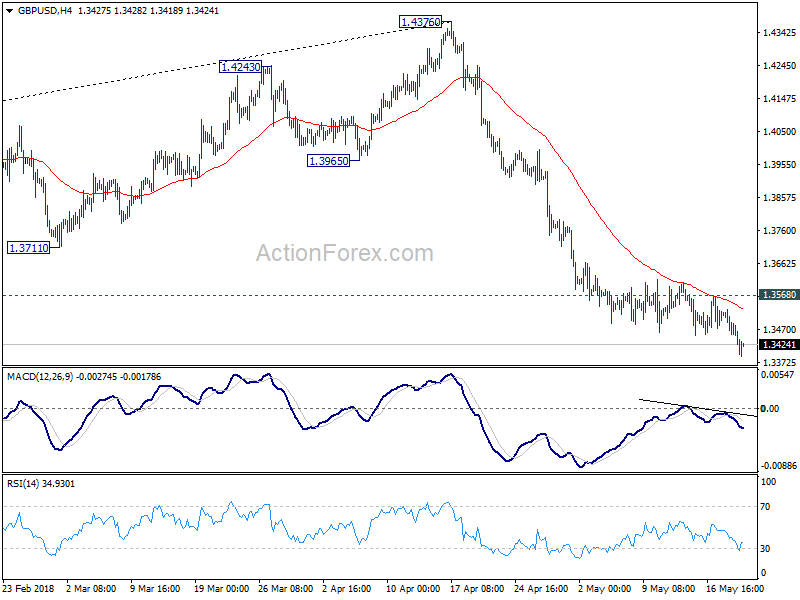
In the bigger picture, current development suggests that whole medium term rebound from 1.1936 (2016 low) has completed at 1.4376 already, with trend line broken, on bearish divergence condition in daily MACD, after rejection from 55 month EMA (now at 1.4223). 38.2% retracement of 1.1936 (2016 low) to 1.4376 at 1.3448 should now be firmly taken out. Next target will be 61.8% retracement at 1.2874 and below. Outlook will stay bearish as long as 55 day EMA (now at 1.3801) holds, even in case of strong rebound.