Sample Category Title
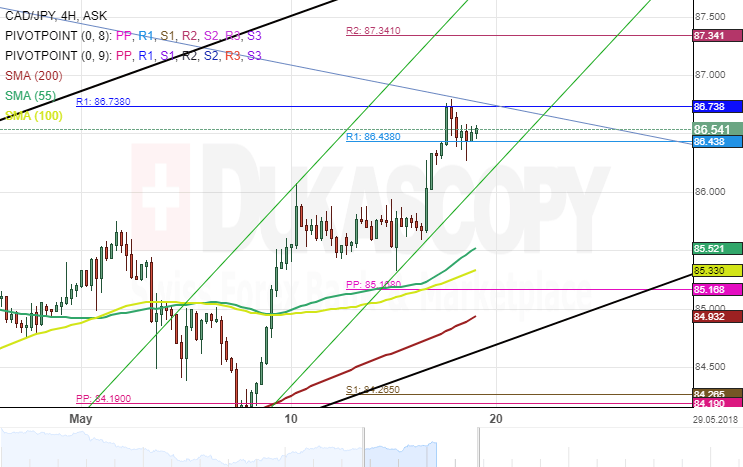
CAD/JPY 4H Chart: Bulls Likely To Grow Stronger
The Canadian Dollar has been appreciating against the Japanese Yen after the pair reverse from the lower boundary of a dominant ascending channel May 8. The pair has since reached a three-month high.
The currency pair has tested a strong resistance set by the combination of the weekly and the monthly PPs near 86.78. Meanwhile, the rate was stranded between pivot points at the time of this analysis.
As for near future, the CAD/JPY currency exchange rate is likely to move past the aforementioned PPs. In addition, technical indicators favour bulls to grow stronger during the following trading sessions.
CHF/JPY 4H Chart: Meets Resistance Cluster
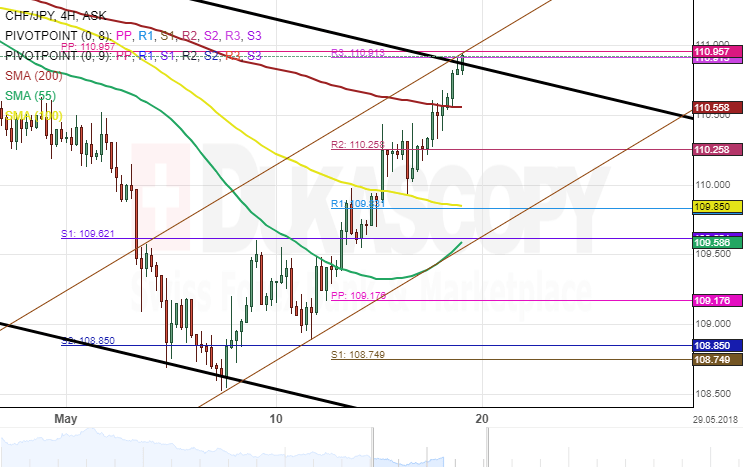
Following a reversal from a dominant descending channel on May 8, the Swiss Franc triggered a new movement in an ascending pattern against the Japanese Yen.
The currency pair has breached both the 55-, 100-, and the 200– hour SMAs during this period. Also, a breakout had occurred through the upper boundary of the dominant descending channel. However, a combined resistance set by the weekly and the monthly PPs near the 110.95 mark was restricting the exchange rate from making further gains at the time of this analysis.
In regards to the following trading sessions, the CHF/JPY currency exchange rate could still move past the aforementioned strong resistance cluster, as it is supported by the 200– hour simple moving average at 110.55.
Bitcoin Trading Below 8000
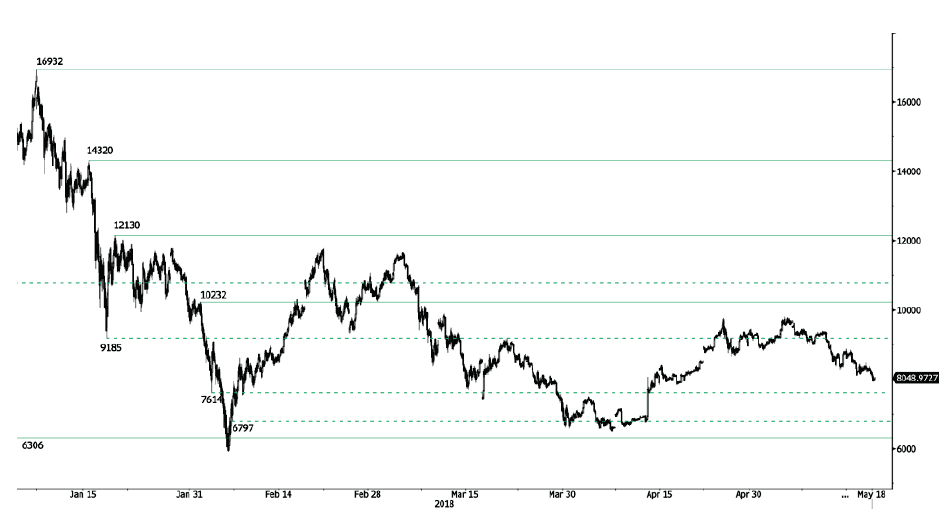
Bitcoin rise started in mid-April stops, the pair is trading at mid-April range, heading along 7930. Bitcoin bearish pattern started in March 2018 is maintained. The pair is contained between hourly support and resistance given at 6306 (13/11/2017 low) and 10232 (01/02/2018 high). The technical structure suggests shortterm decrease.
In the long-term, the digital currency has had an exponential growth but also presented important downturns. There is decent likelihood that the currency could stabilize between 7'000 - 12'000 in 2018. Bitcoin is trading below its 200 DMA (8500 range).
CRUDE OIL Continued Strength
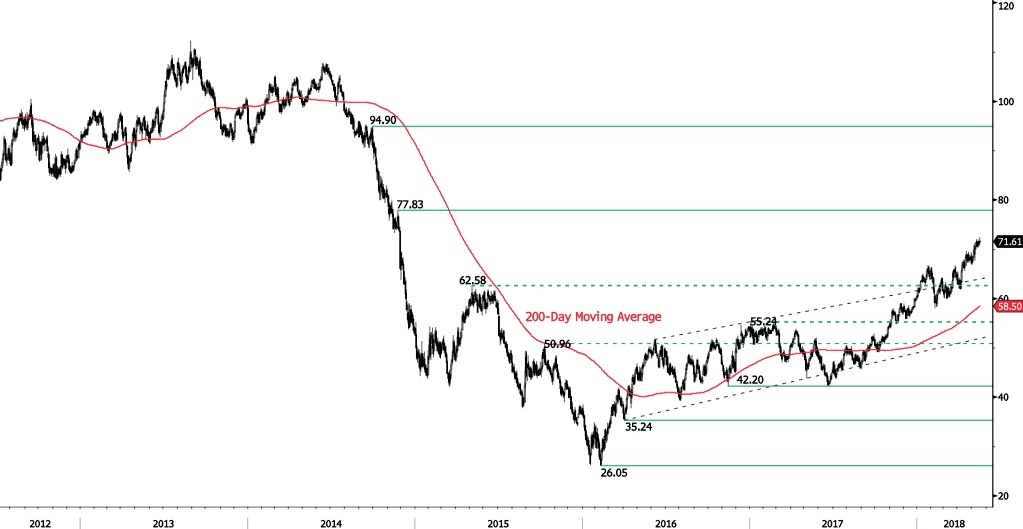
Crude oil is increasing further, approaching 72. The road is wide opened for further rise. The bullish pattern started in mid-February 2018 is strengthens. Hourly support and resistance are given at 65.56 (17/04/2018 low) and 73.56 (28/11/2014 high). The technical structure suggests further short-term upward moves.
In the long-term, crude oil has recovered after its sharp decline last year. However, we consider that further weakness is very likely. For the time being, the pair lies in an upside trend since June 2017. Support lies at 42.20 (16/11/2016) while resistance is located at 77.83 (20/11/2014). Crude oil is trading largely above its 200 DMA.
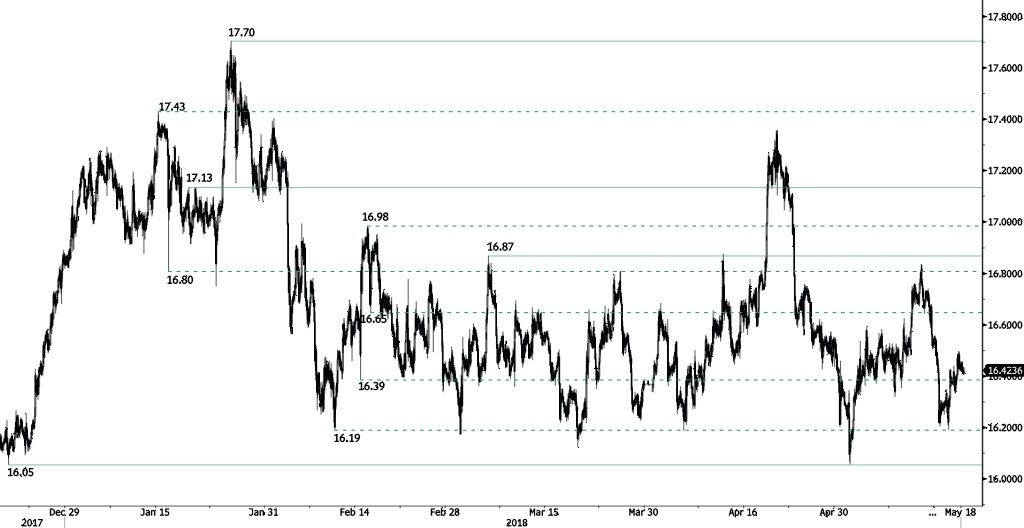
SILVER Bearish Consolidation
Silver bearish consolidation continues after reaching 16.50 high, heading along 16.33. Hourly support and resistance are given at 16.05 (19/12/2017 low) and 16.87 (06/03/2018 high). The technical structure suggests short-term decrease.
In the long-term, the trend remains negative/ sideways. Further downside is very likely. Resistance is located at 21.58 (10/07/2014 high). Strong support can be found at 11.75 (20/04/2009). The pair is trading below its 200 DMA
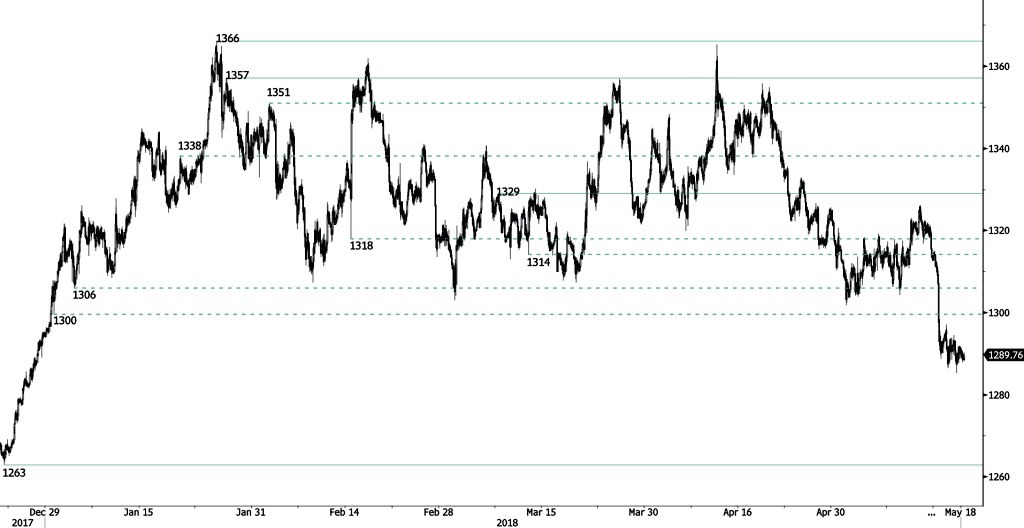
GOLD Continued Bearish Pressures
Gold is decreasing further, trading below 1290 and heading along 1285. Hourly support and resistance are given at 1263 (21/12/2017 low) and 1329 (08/03/2018 high). The technical structure suggests short-term downward moves.
In the long-term, the technical structure suggests that there is a growing upside momentum. A break of 1'392 (17/03/2014) is required to confirm it. A major support can be found at 1'045 (05/02/2010 low). The pair is trading below its 200 DMA.
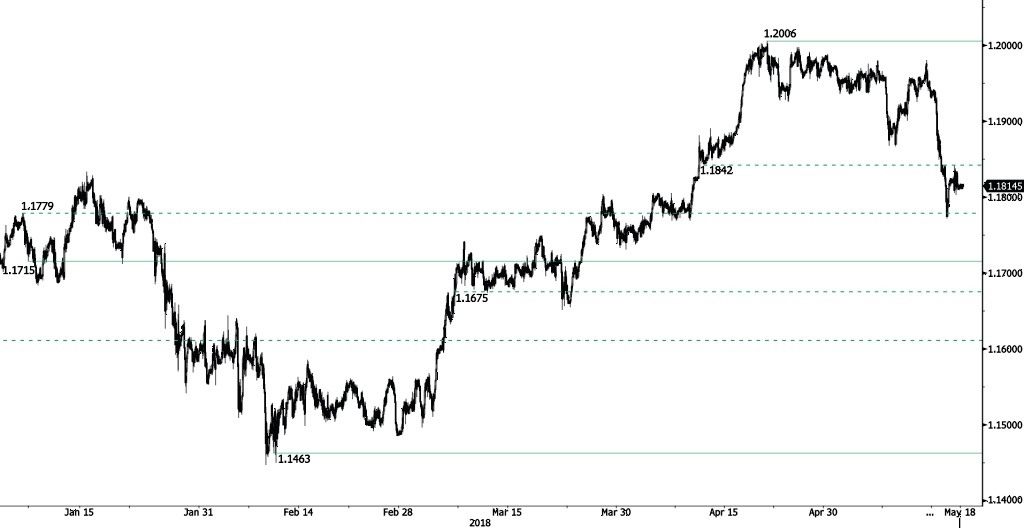
EUR/CHF Neutral
EUR/CHF is starting a bullish consolidation at the 1.1815 range. Expected to head along 1.1830. Hourly support and resistance are given at 1.1715 (07/01/2018 low) and 1.2006 (20/04/2018 high). The short-term technical structure suggests short-term sideways trading moves.
In the longer term, the technical structure has reversed. Strong resistance at 1.20 (level before the unpeg) is now at reach. The ECB's slowing QE program is likely to cause buying pressures on the euro, which should weigh in favour of the EUR/CHF. Support and resistance can be found at 1.0624 (24/06/2016 low) and 1.2097 (18/12/2014 high).
EUR/GBP Heading Higher
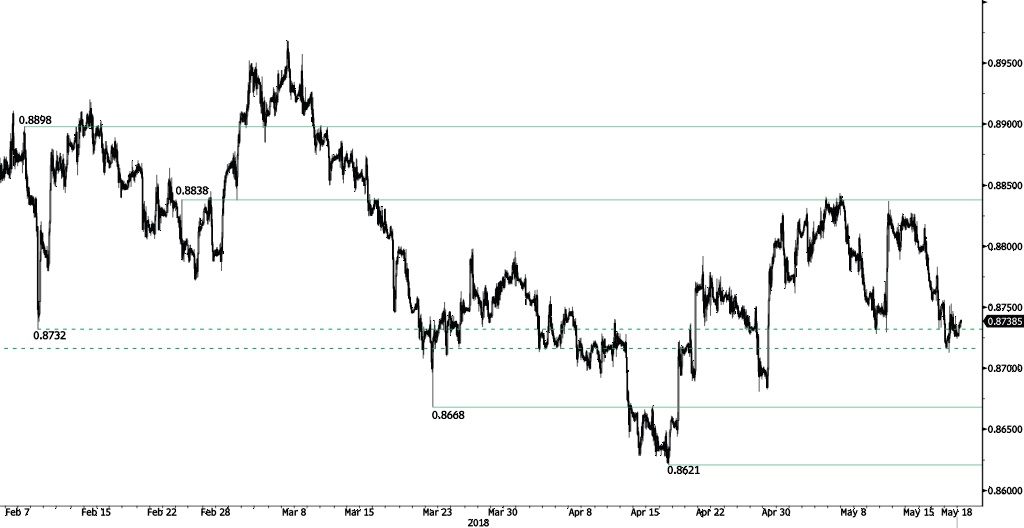
EUR/GBP bearish pattern stops, the pair is bouncing off from 0.8724, heading along 0.8740. EUR/GBP bearish pattern started in March is maintained. Hourly support and resistance are given at 0.8668 (22/03/2018 low) and 0.8838 (23/02/2018 high). The technical structure suggests short-term upward moves.
In the long-term, the pair has largely recovered from 2015 lows. The technical structure suggests further upside pressure. Strong resistance can be found at 0.9500 (psychological level) while support remains at 0.8304 (05/12/2016 low). The pair is trading below its 200 DMA.
AUD/USD Bouncing Off
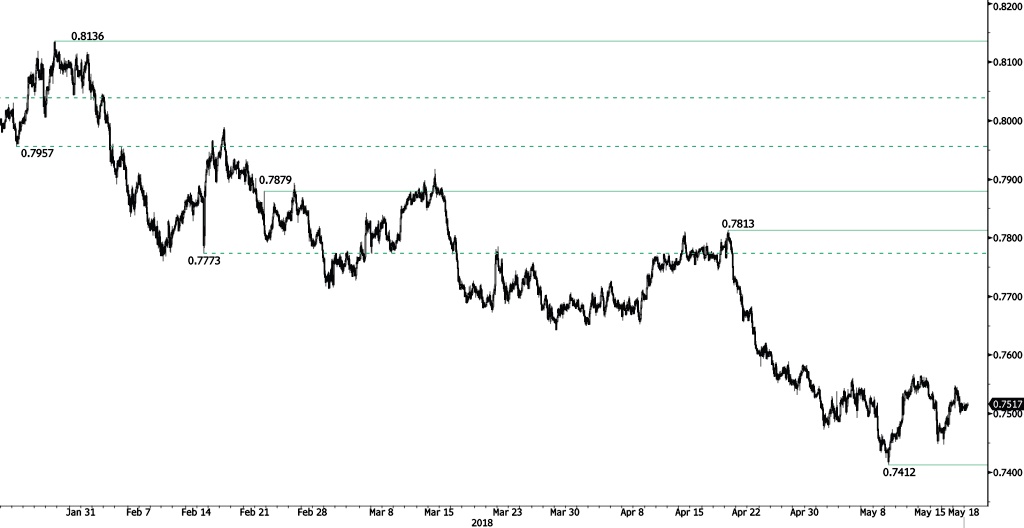
AUD/USD bounce continues, trading above 0.75 and heading along the 0.7530 range. Hourly support and resistance remain at 0.7412 (09/05/2018 low) and 0.7813 (19/04/2018 high). The technical structure suggests short-term increase.
In the long-term, the upward trend slows down after failing to reach key resistance at 0.8164 (14/05/2015 low). Key support stands at 0.6009 (31/10/2008 low). A break of the key resistance at 0.8164 (14/05/2015 high) is needed to invalidate our long-term bearish view.
USD/CAD Increasing
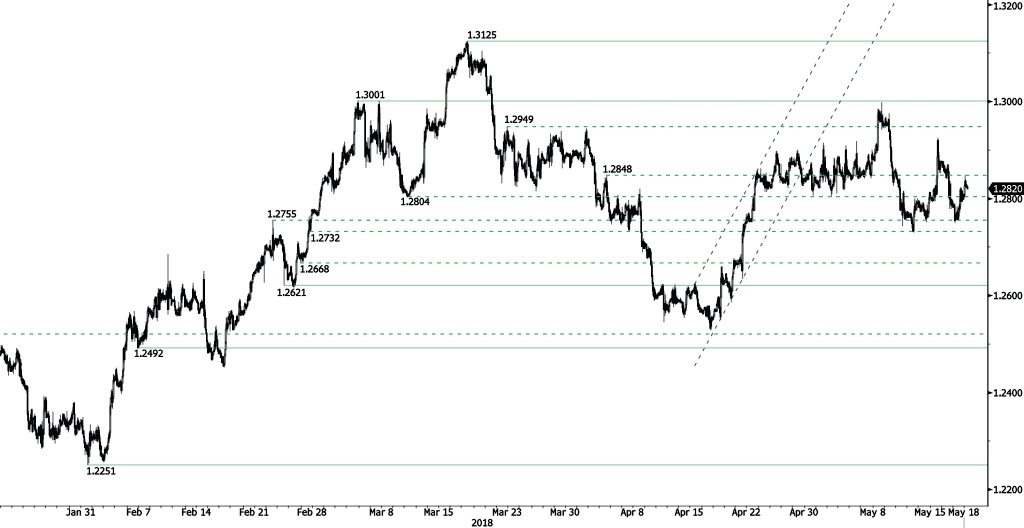
USD/CAD is slightly increasing, trading above 1.28 and heading along 1.2850. Hourly support and resistance are given at 1.2621 (23/02/2018 low) and 1.3001 (05/03/2018 high). The technical structure suggests short-term upward moves.
In the longer term, the pair is trading between resistance point at 1.3805 (05/05/2017 high) and support at 1.2128 (18/06/2015 low). Strong resistance is given at 1.4690 (22/01/2016 high). The pair is likely to head lower. The pair is trading above its 200 DMA.