Sample Category Title
EUR/USD – Sluggish Euro Drops Below 1.18
EUR/USD continues to trade quietly. In the Friday session, the pair is trading at 1.1784, down 0.10% on the day. The euro has lost 1.4% this week. On the release front, German inflation indicators were stronger than expected. PPI and WPI both improved to 0.5%, beating their estimates. In the eurozone, the numbers were mixed. The current account surplus narrowed to 32.0 billion, short of the estimate of EUR 35.1 billion. The trade balance surplus edged up to EUR 21.1 billion, above the forecast of EUR 20.7 billion. In the U.S, there are no economic indicators to wrap up the week.
There was welcome news on the inflation front, as German indicators showed strong improvement in April. PPI improved from 0.1% in March to 0.5% in April, and WPI followed the same trend, climbing from 0.0% to 0.5%. These figures come on the heels of German CPI, which fell from 0.4% to 0.0%. The eurozone economy continues t0 perform well in 2018, but inflation has lagged behind and remains well below the ECB inflation target of around 2 percent. Weak inflation levels could have a significant impact on ECB fiscal policy, as policymakers may have to consider extending its stimulus scheme, which is scheduled to run until September. At the same time, higher oil prices could boost weak inflation levels. Brent crude hit $80 earlier this week, and the upward trend could continue as renewed U.S sanctions against Iran could hamper its oil exports.
The US economy continues to fire on all cylinders in 2018. The Trump tax cuts and increase in government spending have boosted growth, and inflation is moving closer to the Federal Reserve target of 2 percent. These developments, although positive, have given rise to a policy debate in the Fed with regard to the pace of rate hikes. Earlier in the week, San Franciso Fed President John Williams said that only a few more hikes are needed before the economy can manage on its own without the Fed tightening or easing policy. This “neutral rate’ policy is being disputed by other Fed policymakers, who believe that the U.S. economy has shifted into a higher phase, warranting rate cuts once economic indicators point to a hot economy. This split over monetary policy could intensify in the second half of 2018k if the economy continues to improve
Dollar Beats Yen
Yield sensitive usdjpy rallies
USD continued to improve against the JPY as US yields rose across the curve. With the macro backdrop of us-china trade optomism and improved outlook for the US economy yield o 10 year treasuries hit 3.128%, marking a 7 year high. However, meaningful adjustment in the Feds policy path has yet to be made. Fed Fund Futures continue to price only two 25bp hike in 2018. On widening spreads (specifically in shortern duration) USDJPY rose to a sesson high of 110.992. Interestingly CHF has yet to be further influenced as political uncertianty in Italy has kept the european safe haven chf well bid. Japan CPI fell to a disappointing 0.6% y/y in April while core dipped to 0.4 from 0.5%. These reads overall distance from the BoJs 2% inflation target and general trajectory indicates no softening in BoJ reflation stance. With anchored pro inflation policy vs. US economic exceleration and pair sensitivity to spread widening suggests further upside for USDJPY.
CAD finally strengthens
Unlike what we might think, the energy-related Canadian dollar boost from continued crude oil prices rise is lively. Indeed, though the performance in USD/CAD remains rather subdued started in April 2018 due to a strong USD rally since mid-March 2018, things look a bit different when looking at CAD performance against other major currencies. The strength in loonie is particularly interesting when looking at the development in CHF/CAD, CAD/JPY and EUR/CAD for which the CAD gained ground by +5.12%, +5.08% and +4.78% respectively. Accordingly, the impression of a non-commodity impact is misleading. On the contrary, the CAD robust performance against the greenback should be praised.
Key data releases in Canada will concern April consumer price index and retail sales. Inflation readings are expected to remain stable at +0.30% m/m and +2.30% y/y along with a slight increase of +0.50% in core retail sales (prior: 0%).
Looking forward, we would favor a USD/CAD pullback in the short-term, strongly influenced by positive Canadian data releases and weakening USD momentum. Currently given at 1.2809, USD/CAD is trading sideways, expected to head along 1.2850 in the short-term.
Italian League and 5 Star Movement softened proposal on EU fiscal rules
The populist parties of the League and the 5-Star Movement signed an accord to form a ruling coalition. Euro's reaction so far has been relatively muted, even though it weakened as touch.
That's probably because the final accord dropped the proposal to create fiscal headroom for Italy by changing the formula for calculating debt burden. Instead, it just called for a review of EU governance and fiscal rules.
The coalition government could take office as early as next week. But there is no announcement on who would be the Prime Minister.
China denied offer to cut USD 200B in surplus with US
China denied the news that it's offering to cut trade surplus with US by USD 200B. Chinese foreign ministry spokesman Lu Kang said in a regular news briefing "this rumor is not true. This I can confirm to you".
He added, "as I understand, the relevant consultations are ongoing and they are constructive," regarding the trade talks between the US and Chinese delegates led by Vice Premier Liu He.
Separately, the Chinese Ministry of Commerce announced to end the "anti-dumping and anti-subsidy investigations of imported sorghum originating in the United States".
The MOFCOM noted in the statement that "the imposition of anti-dumping and anti-subsidy measures on imports of sorghum originating from the United States would have a widespread impact on consumer living costs, and does not accord with the public interest."
Forex Analysis: US 30 Index And Gold
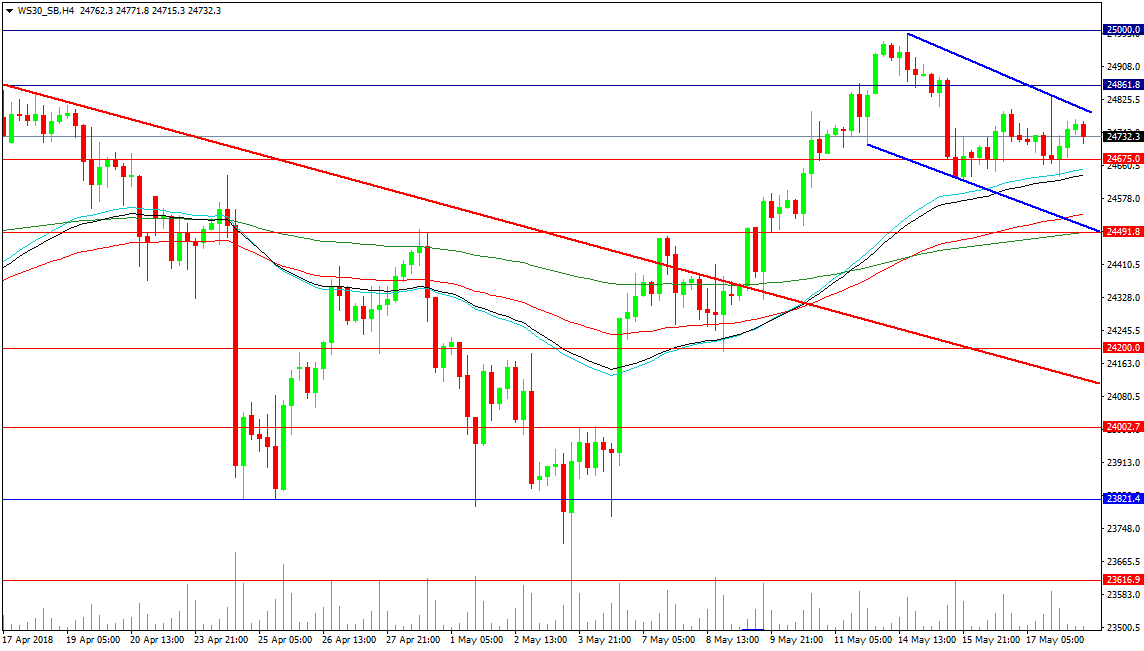
The US 30 Index approached 25000.00 this week but has stepped back from that level to support at the 50-period MA. The index looks to be forming a continuation pattern but more data is needed to confirm this. The breakout from the red line was contested by bears a week earlier around 24400.00 and this week has been a struggle. A break above the blue top trend line at 24800.00 is now needed for a retest of 25000.00. A move higher targets 25200.00 and 25500.00. The 2018 high remains a major target for bulls at 267000.00.
The support around 24500.00 is where the lower blue trend line comes into play but it is also the vicinity for the 100 and 200-period MAs. This level is also a high from the start of the month. A drop below this level could force a drop to the 24200.00 and a potential retest of the red trend line at 24116.00. Further support can be seen at the 24000.00 area and also the lows from late April around 23820.00.
Gold
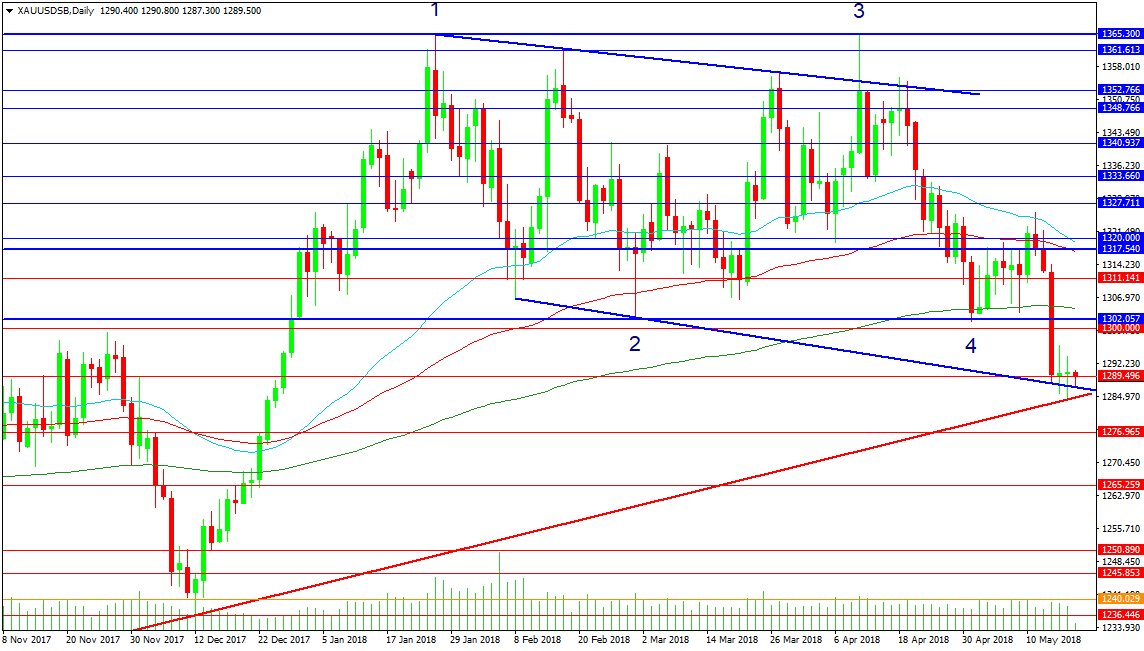
The precious metal has fallen under 1300.00, triggering a couple of bearish patterns. The box pattern shown here was formed in 2018, with touches 1 and 3 at 1365.30 and touches 2 and 4 at 1302.00. This gives an approximate target around 1240.00. This pattern marries with a double top at the 1365.00 level and the same target area. The bearish move has run into support, with the falling blue trend line being used on Tuesday and again today as lows, and the rising red trend line for yesterday’s low. A loss of the support area at 1284.00 would target 1265.25, followed by 1250.00 and the 1240.00 level, with the December low at 1236.44.
Resistance can be found at 1292.00 up to 1300.00 and extending to 1302.00. This chunk represents a zone that we can see used through 2018 as support, and during November 2017 as resistance. Any advance higher would find resistance at 1320.00, followed by 1340.00. Another zone of resistance comes in above 1352.77 up to 1365.30, where all rallies for 2018 have failed.
EURUSD Holds In Narrowing Consolidation Around 1.18 Handle
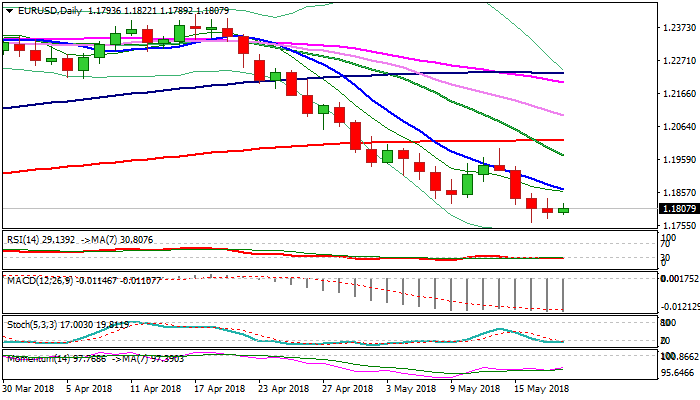
The Euro trades within narrowing consolidation above new five-month low at 1.1763 and moving around 1.18 handle in early Friday’s trading.
Mixed signals from momentum and MA’s and oversold slow stochastic signal further consolidation.
Focus turns on EU trade data as German PPI and EU C/A, released earlier did not provide firmer signal.
Overall structure is bearish and keeps the downside at risk. Break below 1.1763 would expose strong supports at 1.1709 (Fibo 38.2% of 1.0340/1.2555) and 1.1675 (top of thick weekly Ichimoku cloud).
Extended upticks should stay capped by falling 10SMA (1.1866) to keep bearish bias intact.
Res: 1.1837, 1.1854, 1.1866, 1.1879
Sup: 1.1789, 1.1776, 1.1763, 1.1709
EUR/USD Analysis: Tries Pushing Higher
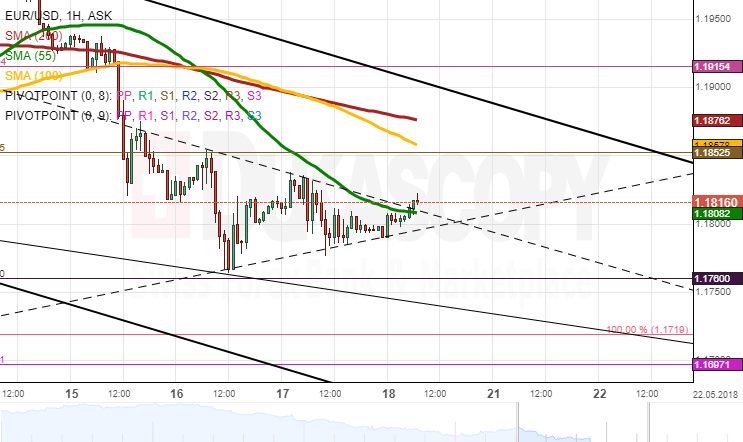
Thursday's trading session did not introduce massive changes to the direction of EUR/USD. The pair tried to move past the 1.1840 mark but was nevertheless pressured lower by the 55-hour SMA.
As apparent on the chart, the Euro diminished its trading range against the US Dollar yesterday, thus being stranded between the aforementioned SMA and a short-term trend-line.
It is expected that the former is surpassed today, thus paving the way for further surge up to the 100– and 200-hour moving averages at 1.1770. Technical indicators on the 4H and 1D time-frames suggest that this appreciation should continue during the following week, as well.
In case the 55-hour SMA remains intact, the Euro is to target the 1.1740 area.
GBP/USD Analysis: Falls Back Below 1.3540
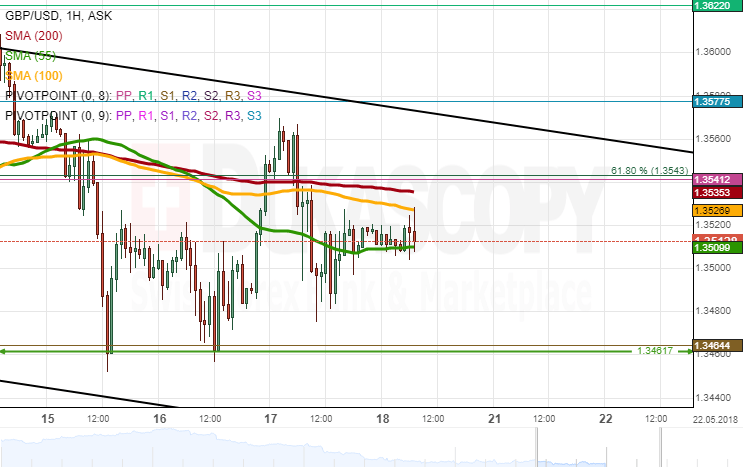
Despite breaching the massive resistance of the 100– and 200-hour SMAs, the weekly PP and the 61.80% Fibonacci retracement at 1.3550 early on Thursday, the pair had returned below this cluster by mid-session.
Given that this level is likewise reinforced by the 55-period (on 4H chart) and the 200-day SMAs near 1.3570, the Pound might be reluctant to make significant advances, especially if no important data releases are scheduled for this session. Technical indicators also flash bearish signals for the remaining part of this week.
It is not expected that the pair breaches its nearest resistance formed by the weekly S1 and the 2018 low of 1.3460, thus remaining near the 1.3480/50 range by Monday morning.
USD/JPY Analysis: Returns To 111.00
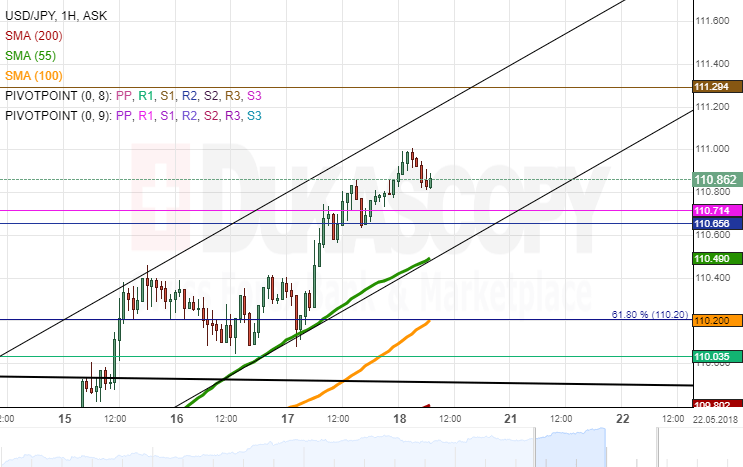
Upside momentum continues to drive the USD/JPY exchange rate for the fourth consecutive session. Being supported by the 55-hour SMA, the Greenback appreciated 88 pips until the psychological 111.00 mark where it was located this morning.
It seems that the bearish sentiment could prevail in the market today, thus sending the pair for another test of the 55-hour SMA near 110.50. In case this level is surpassed, the ultimate daily low should be the 110.00 area where the 100-hour SMA, the weekly R1 and the 61.80% Fibonacci retracement are located.
Conversely, further surge is restricted by the weekly R3 at 111.30. The Greenback could weaken against the Yen during the following trading sessions prior to picking up upside momentum once again.
Gold Analysis: Tests Long-Term Pattern
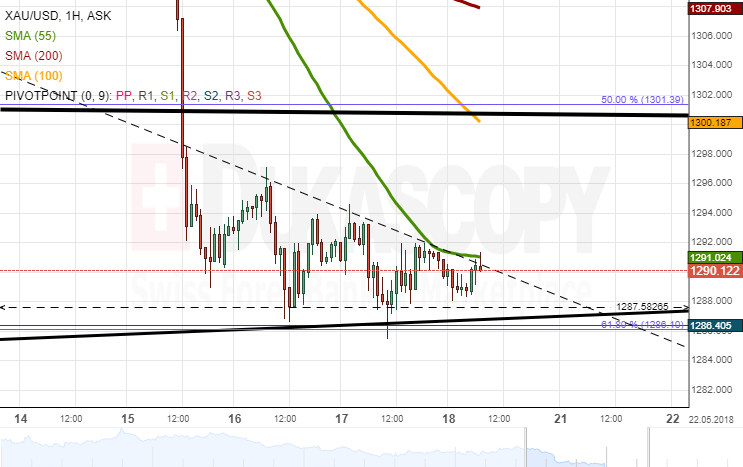
The slight period of consolidation during the past few trading sessions has formed a triangle-like formation, thus stranding the rate in a diminishing trading range.
It is more likely that this pattern is breached to the upside together with the 55-hour SMA. The yellow metal should subsequently target the 100-hour SMA, the 50.00% Fibonacci retracement and the breached channel circa 1,300.00. This bullish scenario is likewise supported by the fact that the pair has been unsuccessfully testing the bottom boundary of the most senior channel (formed in November 2016) during the past two days.
In case a fall occurs, Gold should not exceed the 1,280.00 level.