

Sample Category Title
Canada Inflation And Retail Sales In Focus
The U.S. dollar was seen maintaining steady ground on Thursday. Economic data for the day saw the release of the weekly unemployment claims which rose higher than expected to 222k. The Philly Fed manufacturing index post strong gains, rising to 34.4 beating estimates of 21.1.
The euro currency continued to remain weak on growing concerns of a possible anti-EU establishment government being set up in Italy. This, alongside the debt concerns continues to drag the common currency lower.
The economic data for the day will see the release of the German producer prices index data. Forecasts point to a 0.3% increase on the factory gate inflation. This is followed by the Eurozone current account and trade balance figures. The median estimates point to a narrowing in the trade balance figures while current account is expected to remain unchanged.
The FOMC member, Loretta Mester will be speaking today followed by another member, Brainard. Both members are considered to have hawkish inclinations on rate hikes.
Canada will be releasing its monthly retail sales numbers. Forecasts point to a 0.5% increase in core retail sales. Inflation data will also be coming out today. Median estimates point to a 0.3% increase on the headline CPI.
GBP/USD Bullish Bounce Or Bearish Break At 1.35 Support Zone
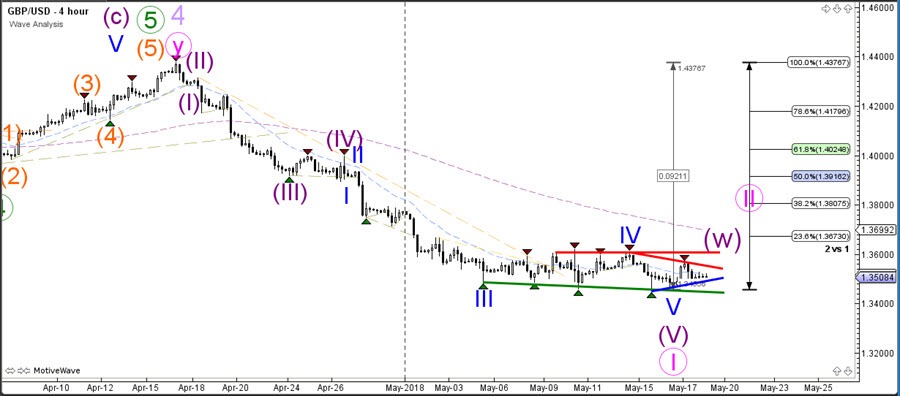
The GBP/USD is hesitating with making a breakout in either direction. Price could continue with the downtrend but a break below the key support zone remains key.
A break above the resistance zone could indicate a larger bullish corrective reversal. The breakout direction will decide whether price is still in the wave 5 (purple) of wave 1 (pink) or whether the wave 2 (pink) correction has finally started.
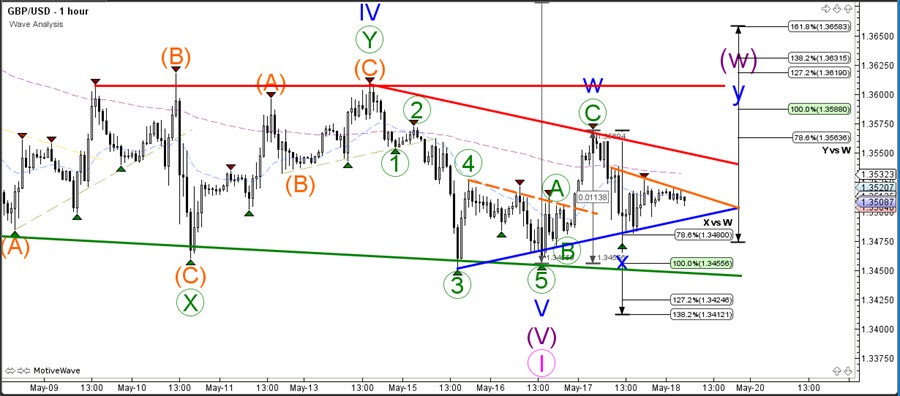
The GBP/USD seems to be building an expanded correction at the moment as price failed to break below the 78.6% Fibonacci level of wave X (blue). Price will need to break below the support trend line (blue) before a larger bearish breakout could occur whereas a break above the resistance trend lines could indicate the continuation of the wave Y (blue).
Elliott Wave View: USDJPY Ending 5 Waves Impulse Soon
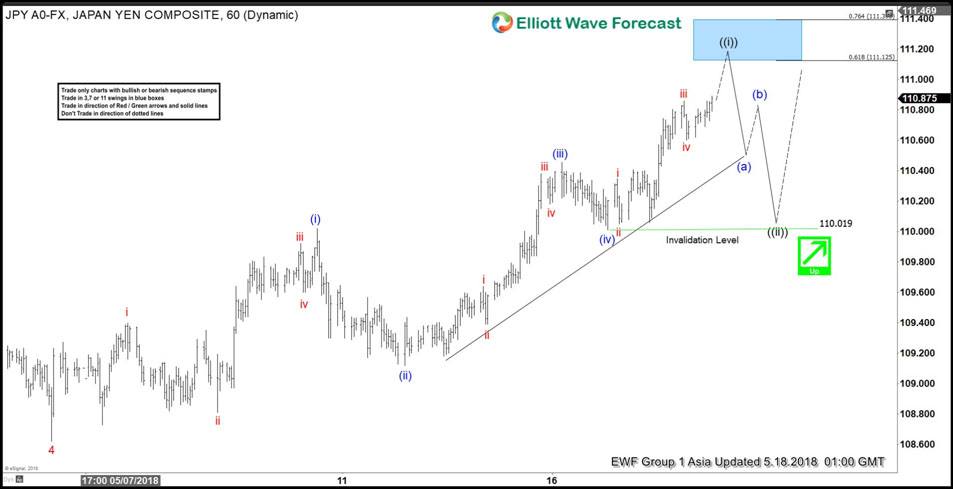
USDJPY Short-term Elliott wave view suggests that the pullback to 108.62 on 5/04 low ended Minor degree wave 4. Above from there, the rally is unfolding as a 5 waves Elliott Wave structure, also known as Impulse. It’s important to note that the sub-division of Minor wave 1, 3 & 5 are also impulsive in the lesser degree. The subdivision in this case is wave ((i)), ((ii)), ((iii)), ((iv)), and ((v)) in Minute degree.
The internal of Minute degree wave ((i)) is unfolding as 5 waves impulse where the rally to 110.02 high ended Minutte wave (i). Then the pullback to 109.12 low ended Minutte wave (ii) and rally to 110.45 high ended Minutte wave (iii) in 5 waves. Down from there, Minutte wave (iv) pullback ended at 110.02 low. Above from there, Minutte wave (v) of ((i)) remains in progress. Near-term focus is towards 111.12-111.39 to end Minute degree with wave ((i)). Afterwards, the pair should do a pullback in Minute wave ((ii)) against 5/04 low (108.62) cycle in in 3, 7 or 11 swings before further upside extension is seen.
USDJPY 1 Hour Elliott Wave Chart
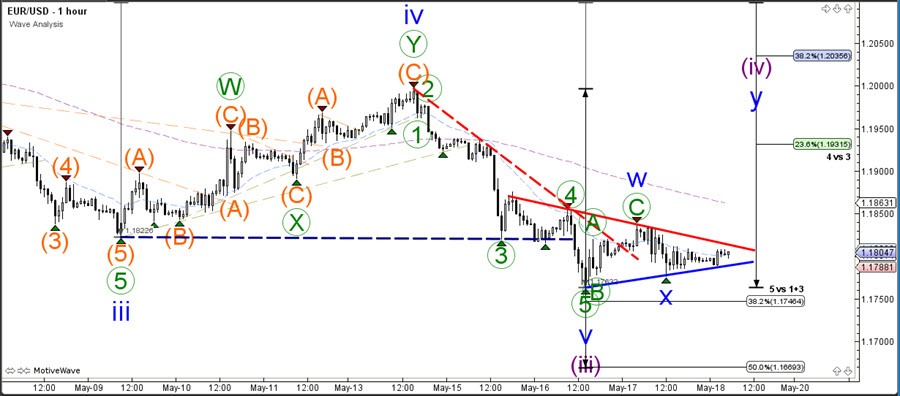
EUR/USD Builds Triangle Chart Pattern At 1.1750 Support
The EUR/USDfailed to break the bottom yesterday. Price action is now building a larger triangle chart pattern and the next move will depend on the breakout direction.
A bullish bounce could indicate the start of a wave 4 (purple) correction whereas a bearish breakout could see an expansion of the wave 3 (purple) momentum towards the Fibonacci targets of wave 5. For the moment a wave 4 seems to be more likely.
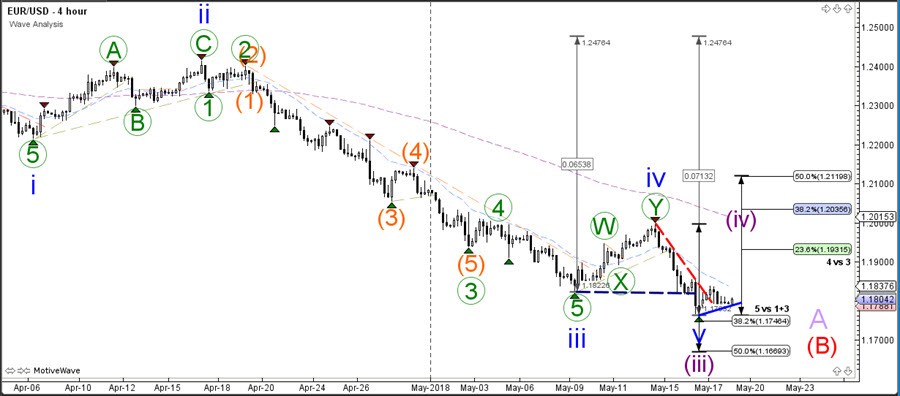
The EUR/USD is building a triangle chart pattern. A break above the resistance (red) could see a bullish breakout take price up to the Fibs of wave 4 whereas a break below the support (blue) could see price test the Fib target of wave 3.
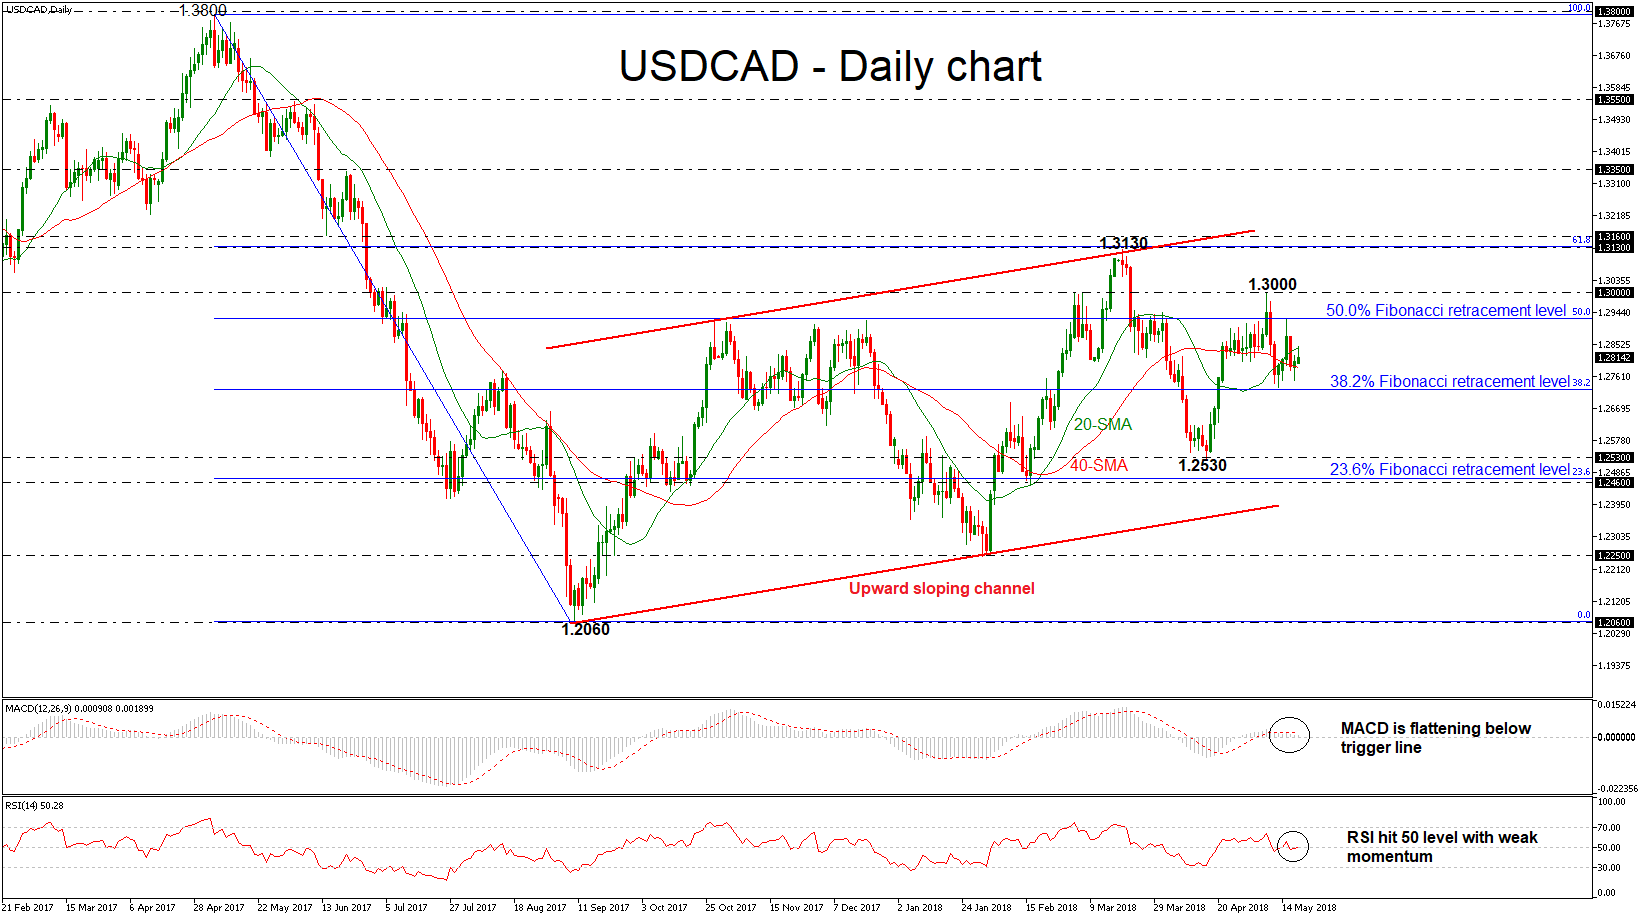
USDJPY – Bulls May Extend To 112 Zone After Break Of 110.87 Fibo Barrier
The pair maintains firm tone and hit new four month high in early Friday’s trading as extension of week-long bull-leg from 109.20, probed above strong Fibo barrier at 110.87 and cracked psychological 111 resistance.
Positive momentum and bullish daily MA’s configuration favor further upside as bullish signal was generated on break above 110.87 (Fibo 61.8% of 114.73/104.63 fall) and requires daily close above for confirmation.
Further bullish acceleration would extend towards weekly cloud base (111.94) and Fibo 76.4% (112.34).
The notion is supported by rise in US Treasury yields which hit the highest in nearly seven years in Asia on Friday and keep the dollar supported. Rising yields are positive signal for the strength of the US economy, which also fuels expectations for further inflation rise and could result in more aggressive Fed in 2018.
Overbought daily RSI/slow stochastic signal bulls may take a breather before continuing higher.
Broken 200SMA is reinforced by rising bull-trendline off 104.63 and expected to contain extended dips.
Res: 111.00, 111.48, 111.94, 112.34
Sup: 110.72, 110.15, 110.00, 109.86
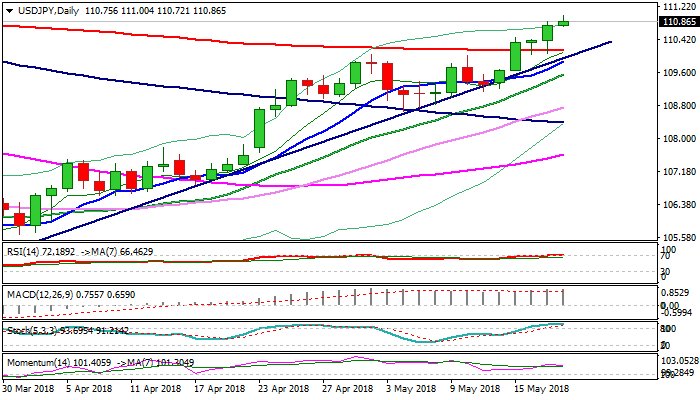
USDCAD Stuck Within Narrow Range Of 38.2% And 50% Fibonacci Levels, Maintains Weak Bias In Near Term
USDCAD has been trading within the 20- and 40-day simple moving averages since Thursday’s session with weak momentum. The pair plunged below the 50.0% Fibonacci retracement level of 1.2925 of the downleg from 1.3800 to 1.2060 and is still holding above the 38.2% Fibonacci mark of 1.2725 during the current week.
Looking at the daily timeframe, based on technical indicators, momentum is too weak to provide a sustained move higher. The MACD oscillator slipped below its trigger line in the positive area, while the RSI indicator is standing near the 50 threshold and is sloping upwards.
Should prices move lower, immediate support could come at 38.2% Fibonacci level. A drop below this area would take the price to the next low of 1.2530 and significantly weaken the bullish medium-term structure.
In the event of an upside reversal, the 50.0% Fibonacci mark at 1.2925 could act as a barrier before being able to re-challenge the 1.3000 handle. A climb above this significant region would open the way towards the 1.3130 resistance level, taken from the peak on March 19, which overlaps with the 61.8% Fibonacci.
In the bigger picture, the pair has been developing within a rising sloping channel since September 2017, failing several times to exit from this range.
USD/JPY Builds Wave 3 Momentum Above 110 Resistance Zone
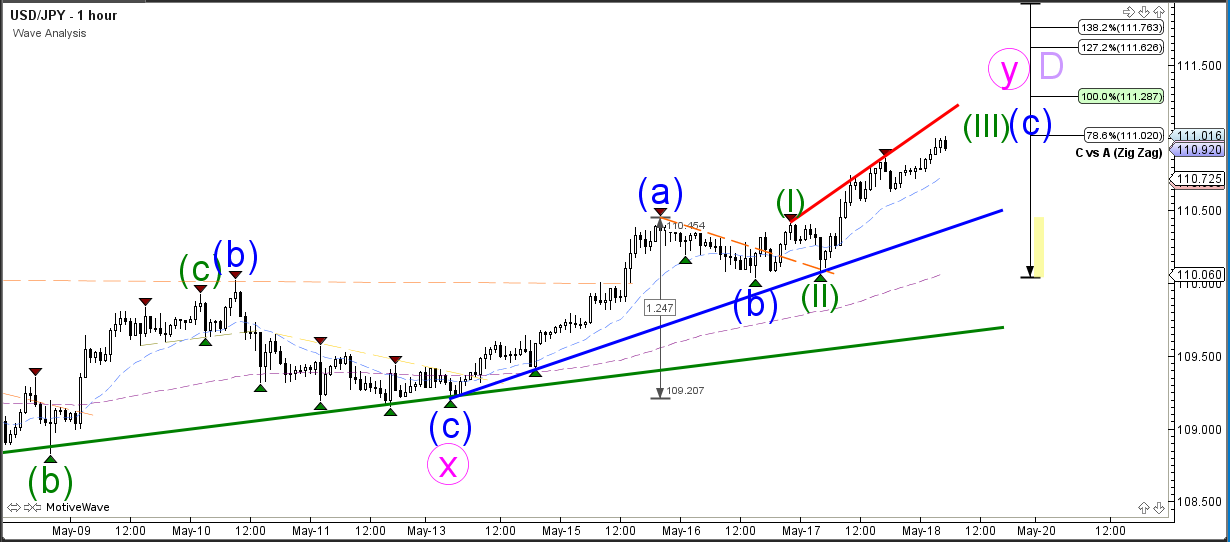
The USD/JPY uptrend continues strongly and has reached the 111 round level in the meantime. There seems to be more space available for an uptrend continuation with the uptrend channel before price reaches the top of the channel and 50% Fibonacci resistance spot at 111.80. This could complete a larger WXY (pink) correction within wave D (purple).
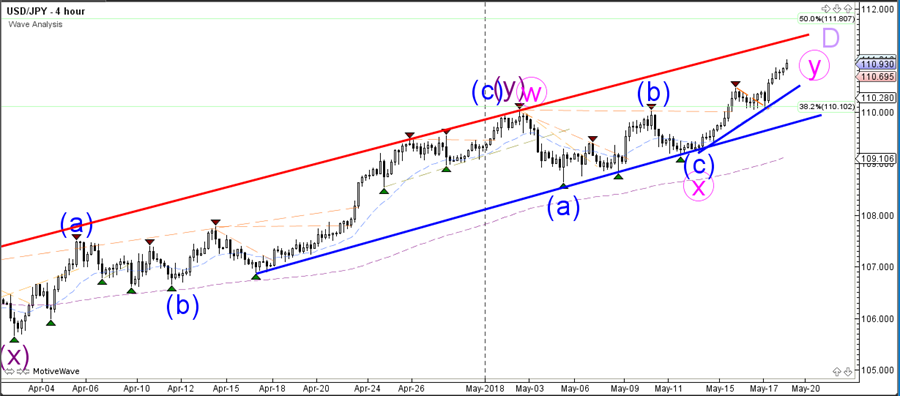
The USD/JPY seems to be in a wave 3 (green) momentum, which could extend further to the upside. Any bearish retracement might be a wave 4 and could see a bullish bounce at the previous bottoms at 110.75 or previous broken tops at 110.50.
Rates And Oil Prices Also Remain In Focus
General Trend:
- Energy companies outperform, Financials trade generally lower
- Airlines generally weighed down by rise in oil prices
- Canadian Dollar and Mexican Peso decline as US Trade official continued to make cautious comments on possibility of near-term NAFTA agreement
- Reportedly China trade delegation offers package to reduce US trade deficit by $200B annually, said a press report; yet to be confirmed by US or China officials
- China to end dumping probe related to US Sorghum; US Corn, Wheat and Soybean Futures rise
- US/China talks to continue on Friday
- Japan CPI slows for 2nd straight month
- US Treasury yields extend gains during Asian session; Asian 10-yr yields move generally higher
- Australia 3-month bank bill rate rises for second straight session
- China sold 50-year bonds at a lower than expected yield
- China local government firm in Inner Mongolia said to fail to pay interest and principal on approx. CNY4.0B in loans – Chinese Press
- Indonesia Rupiah (IDR) declines after rate hike
- Indonesia Central Bank: “Is in the market” to smoothen Rupiah currency (IDR) volatility
Headlines/Economic Data
Australia/New Zealand
- ASX 200 opened +0.3%; closed -0.1%
- ASX 200 Resources index -0.8%, Telecom -0.6%, Financials -0.5%, Utilities -0.5%; Energy +0.8%, REIT +0.8%
China/Hong Kong
- Shanghai Composite opened -0.1%, Hang Seng +0.3%
- Hang Seng Energy index +3.6%, Property/Construction +0.7%, Materials +0.7%, Info Tech +0.4%; Industrial Goods -0.5%, Telecom -0.4%, Financials -0.2%
- (CN) Reportedly China trade delegation offers package to reduce US trade deficit by $200B annually - press
- (CN) China Commerce Ministry (MOFCOM): to end dumping probe related to US Sorghum; cites 'public interest'
- (US) US President Trump: Important to keep trade cooperation with China; Both countries should expand agricultural cooperation
- (CN) China Vice Premier Liu He comments after meeting with Trump: China willing to work with US on trade issue
- (CN) Taiyuan City in China said to tighten controls related to home purchases - US financial press
- (CN) Shanghai Stock Exchange said to scrutinize share-backed loans by controlling shareholders – financial press
- (CN) China PBoC Open Market Operation (OMO): Skips OMO v CNY50B injected in 7-day and 14-day reverse repos prior
- (CN) China PBoC sets yuan reference rate at 6.3763 v 6.3679 prior
- (CN) China Finance Ministry (MOF) sells 50-year bonds: avg yield 4.13% v 4.22%e; bid to cover 2.24x
Japan
- Nikkei 225 opened +0.3%; closed +0.4%
- TOPIX Marine Transportation index +1.4%; Real Estate -0.4%, Securities +0.3%, Iron & Steel -0.3%
- (JP) JAPAN APR NATIONAL CPI Y/Y: 0.6% V 0.7%E; CPI EX FRESH FOOD (CORE): 0.7% V 0.8%E (lowest core reading since Sept 2017)
Korea
- Kospi opened +0.5%
- (KR) North Korea state media: N Korea to makes more efforts to defuse military tensions
North America
- US equity markets ended mixed: Dow Jones -0.2%, S&P500 -0.1%, Nasdaq -0.2%, Russell 2000 +0.5%
- S&P500 Energy +1.5%; Real Estate -0.5%, Technology -0.5%
- (US) Pres Trump: doubts China trade talks will be successful
- (US) US Trade Rep Lightizer: NAFTA countries are no where near close to a deal; will continue to engage in negotiations
Europe
- (EU) EU reportedly brushes off Prime Min May's idea for customs plan guarantees – press
- (UK) UK reportedly establishes government team to deal with post-Brexit borders – press
- (EU) ECB's Nowotny (Austria): some other governing council members agree that ECB should not wait too long to normalize monetary policy
- (ECB) ECB Nominee Rehn said jury is still out on extent of slowdown – US financial press
- Saudi and UAE Oil Min joint statement: see ample supply of oil; have concerns about recent oil market volatility; Plan meeting with Russia Oil Min Novak next week
- Vivendi [VIV.FR]: Reports Q1 Rev €3.11B v €2.68B y/y
Levels as of 02:00ET
- Hang Seng +0.3%; Shanghai Composite +0.1%; Kospi +0.4%
- Equity Futures: S&P500 +0.2%; Nasdaq100 +0.3%, Dax +0.2%; FTSE100 flat
- EUR 1.1788-1.1809 ; JPY 110.71-111.02 ; AUD 0.7503-0.7520 ;NZD 0.6873-0.6897
- Jun Gold -0.1% at $1,288/oz; Jun Crude Oil +0.2% at $71.62/brl; Jul Copper +0.1% at $3.086/lb
Canadian CPI And Retail Sales Data In Focus Today
At 07:00 GMT, US FOMC Member Mester is due to speak about monetary policy at the ECB macroprudential policy and research conference, in Frankfurt. Audience questions are expected to follow. USD pairs may be influenced by this event if monetary policy is discussed.
At 12:30 GMT, Canadian Consumer Price Index (MoM) (Apr) is expected to be 0.4% against 0.3% previously. BOC Consumer Price Index Core (YoY) (Apr) is expected to be unchanged at 1.4%. BOC Consumer Price Index Core (MoM) (Apr) is also expected unchanged at 0.2%. Consumer Price Index (YoY) (Apr) is expected to be unchanged at 2.3%. Consumer Price Index – Core (MoM) (Apr) came in at 0.0% previously. Retail Sales Ex-Autos (MoM) (Mar) is expected to be 0.5% against 0.0% previously. Retail Sales (MoM) (Mar) is expected to be 0.3% against 0.4% previously. These data points are expected to be largely in line with the consensus this month but the data once again paints an uncertain picture. Any clear assumption that can be extracted from the data will give traders something to run with. Retail sales are stabilizing, after missing expectations for the December and January readings. CAD crosses could be affected by this release, especially if the data deviates from expectations.
At 13:15 GMT, FOMC Member Kaplan is due to speak at a scheduled event. USD crosses could see spikes in volatility during this time.
At 13:15 GMT, FOMC Member Brainard is due to deliver a speech titled “Community Reinvestment Act Modernization” at the Association for Neighbourhood and Housing Development’s Community Development Conference, in New York. Audience questions are expected afterwards. USD volatility may increase during this event.
At 17:00 GMT, Baker Hughes US Rig Count numbers will be released. The prior number last Friday showed that there were 844 Oil rigs in operation up from 834 the previous week. With Oil at the highest levels in recent times, on the back of a bigger than expected draw in inventories on Wednesday, this data could set the tone for traders as they look to the week ahead.
NAFTA Deadline For US Congress Passes Without A Deal
Overnight US Trade Representative Lighthizer issued a statement saying that the U.S., Mexico and Canada are “nowhere close to a deal”. This was counter to the statement by Canadian PM Trudeau yesterday who said “We’re very close” when asked about progress. The US had set a deadline for NAFTA to be agreed on by yesterday, in order to enable Congress to vote on the deal. USDCAD moved higher from 1.27520 up to 1.28213 and extended to 1.28459 early this morning. It has since dropped back a little to 1.28211. After the release of Japanese CPI earlier, USDJPY touched 111.000 on the assumption that the BOJ will have to maintain policy easing for longer.
US Continuing Jobless Claims (May 4) was 1.707M versus an expected 1.780M, against 1.790M previously, which was revised up to 1.794M. Initial Jobless Claims (May 11) was 222K versus an expected 215K, against 211K previously. This data is showing a continuing increase in the number of new claims but continuing claims have stabilized somewhat. Philadelphia FED Manufacturing Survey (May) was 34.4 versus an expected 21.0, against 23.2 previously. This data is now at its highest level since May 2017, after yesterday’s reading outperformed estimates. USDJPY moved higher from 110.684 to 110.853 after this data release.
Japanese National Consumer Price Index (YoY) (Apr) came in at 0.6% against an expected 0.7% from 1.1% previously. National CPI Ex-Food, Energy (YoY) (Apr) came in as expected at 0.4%, from 0.5% previously. National CPI Ex-Fresh Food (YoY) (Apr) came in at 0.7% against an expected 0.8%, from 0.9% previously. This data has fallen from the highs set over the previous couple of readings and is showing a mild drop in inflation. USDJPY rose from 110.793 to 110.986 after the data came out.
EURUSD is up 0.15% overnight, trading around 1.18106.
USDJPY is up 0.12% in early session trading at around 110.884.
GBPUSD is up 0.02% this morning, trading around 1.35173.
Gold is down -0.09% in early morning trading at around $1,289.60.
WTI is down -0.04% this morning, trading around $71.72.