Sample Category Title
Weekly Economic and Financial Commentary: Price Pressures Rising at Manageable Pace
U.S. Review
Inflation Readings Support Increasing Interest Rates
- Data released this week shed light on price pressures building in the U.S. economy. On the whole, it is clear that inflation is moving upward but is not yet unwieldy, which clears the way for the Fed to gradually raise rates this year. We expect three more rate hikes will be necessary by the end of 2018, with the next one in June.
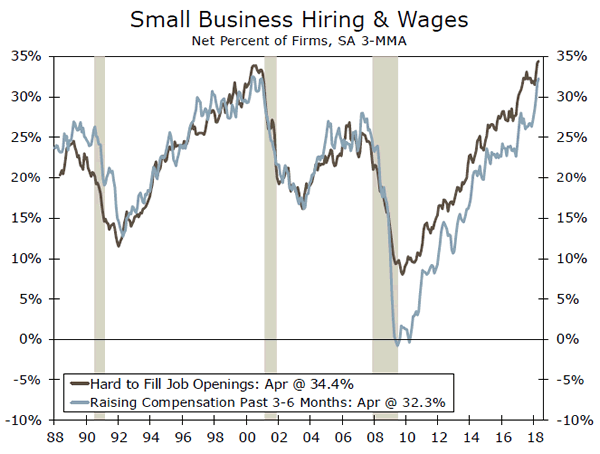
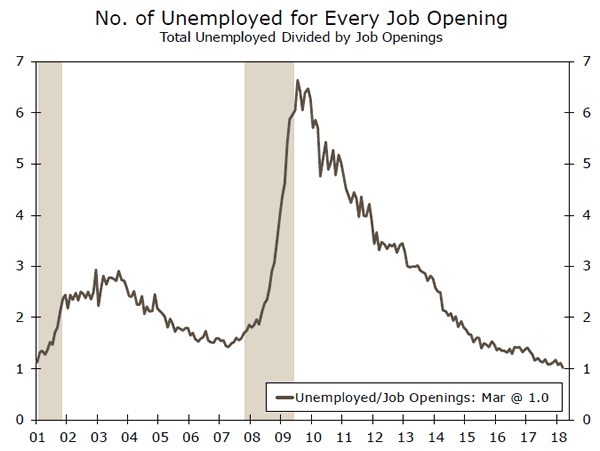
- The tight labor market is increasingly pushing up wages, according to the NFIB. There was only one unemployed person per job opening in March. Firms are paying more for labor, and prices for other inputs are also increasing.
Price Pressures Rising at Manageable Pace
The economic calendar largely focused on inflation this week, with the release of the PPI, the CPI and import prices. Reports from the NFIB reiterated that small business is booming and main street is seeing more pricing power while raising compensation in an ever tightening labor market. Indeed, the Bureau of Labor Statistics (BLS) reported showed there was just one unemployed person for each open position in March.
Small business optimism rose slightly in April after losing some ground in March. That followed a cycle high hit in February after the tax cuts boosted the mood on main street. The mood is still very upbeat. Strong demand is translating into rising earnings on net for firms. Small businesses are also seeing greater ability to increase prices, with the measure of price increases rising to a cycle high in March and easing to its second-highest point of the cycle in April. It's good that small businesses are finding it easier to increase prices, because tough competition for workers is pushing up wages. Hiring quality workers has become a top concern for small businesses, and the share of small businesses unable to fill open positions is at its cycle high. One-third of small businesses reported raising compensation, the highest since 2000. Optimism about earnings trends and tax policy changes are also likely contributing to the larger share of small businesses giving raises.
With one unemployed person per job opening in March, higher wages and the resulting inflation pressure is likely to continue. The job openings rate rose to a record high in March, reinforcing other indications of strong labor demand in the economy. Employees are taking notice. March marked the highest number of quits since 2000. Quits typically signal confidence in the labor market and usually result in a pay increase, which bodes well for wage growth.
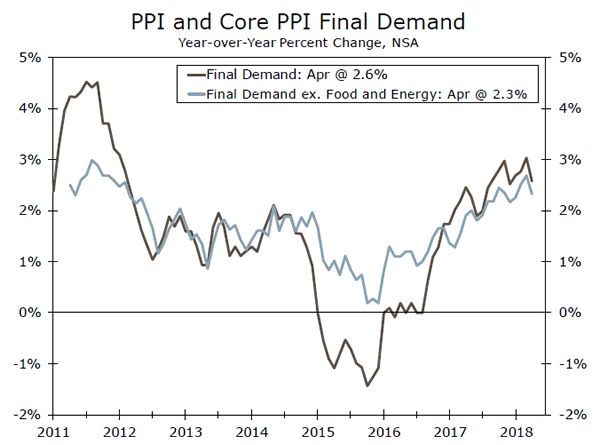
The producer price index (PPI) rose 0.1 percent in April and moderated on a year-over-year basis to 2.6 percent. There were temperate gains across input categories, which show that while inflation is strengthening, it remains orderly. Core PPI also moderated on a year-ago basis but remains on an upward trend relative to this time last year. As an indicator for "upstream" inflation pressures, the PPI points to price increases down the line.
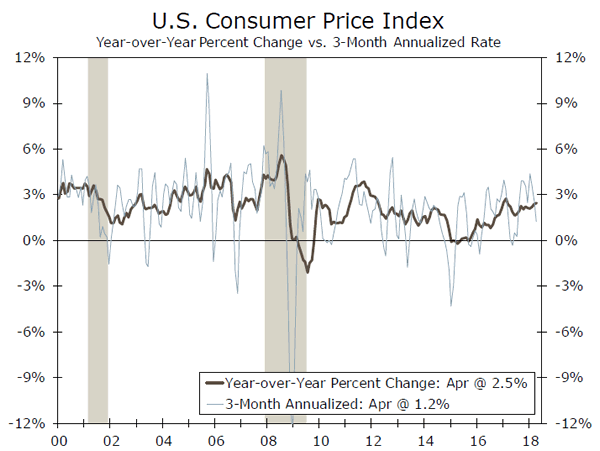
The consumer price index (CPI) came in softer than expected in April. Headline CPI rose 0.2 percent during the month while core CPI rose by a more tepid 0.1 percent. The trend remains upward on a year-ago basis, with the CPI rising 2.5 percent over the year while the core CPI rose 2.1 percent. The recent increase in energy prices was apparent with a 1.4 percent increase in the energy index in April. An increase in food prices also helped push the headline higher. The softer read on core CPI follows a ramp up in Q1, which had some worried that the Fed would need to tighten policy faster than was priced into the market. That April showed a more muted but still clearly increasing trend suggests Q1 strength may have been overstated. We expect the softer reading in April will not deter the Fed from raising rates another three times this year. FOMC meeting minutes and speeches by Fed presidents suggest that FOMC members are inclined to keep to a gradual approach to policy normalization. Measured reaction by the committee to last year's inflation soft patch is further evidence of a gradual approach.
U.S. Outlook
Retail Sales • Tuesday
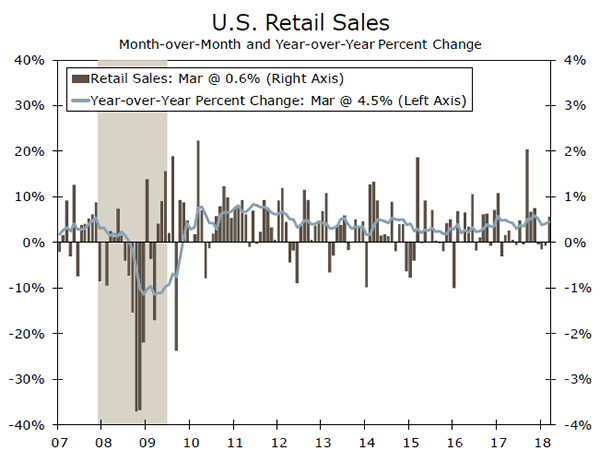
Retail sales reversed a three-month string of declines in March and increased 0.6 percent. Much of the improvement was driven by strong motor vehicles & parts dealers' sales, which increased 2.0 percent for the month. Retail sales excluding autos grew 0.2 percent, with modest strength in health & personal care, nonstore retailer, and furniture & home furnishings sales. Meanwhile, the weakest sectors of the report were sporting goods, hobby, book & music and building material & garden equipment sales, both of which declined for the month.
Control group sales, which are used to calculate GDP, were strong at 0.4 percent in March and helped bolster first quarter consumer spending, which grew at just a 1.1 percent annualized rate. Despite rising inflation and a somewhat weak start to the year, we remain optimistic on the consumer and expect a bounce-back in Q2.
Previous: 0.6% Wells Fargo: 0.3% Consensus: 0.4% (Month-over-Month)
Housing Starts • Wednesday
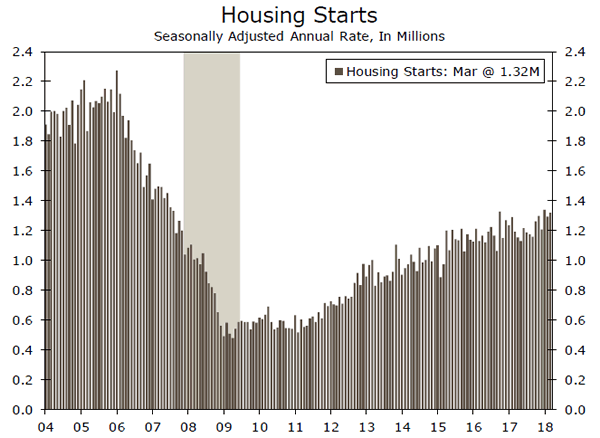
Housing starts increased 1.9 percent to a 1.32 million pace in March. Multifamily starts accounted for most of the gain surging 14.4 percent during the month, while single family starts dropped 3.7 percent. Overall, starts through the first three months of 2018 are running 8.0 percent ahead of the same period one year ago.
Residential construction has been booming in the West, growing 34.2 percent in Q1 compared to last year. Meanwhile, a decline in single family units pulled down starts in the South for the month, bringing overall activity in the first quarter below the year-ago pace. The unseasonable weather was again apparent in the Northeast and Midwest, where single family starts declined through March.
Significant upward revisions to prior month's data showed that residential construction had a much stronger start to the year than had been previously indicated. We expect activity to continue to build momentum and trend higher as the weather warms.
Previous: 1,319K Wells Fargo: 1,330K Consensus: 1,325K
Industrial Production • Wednesday
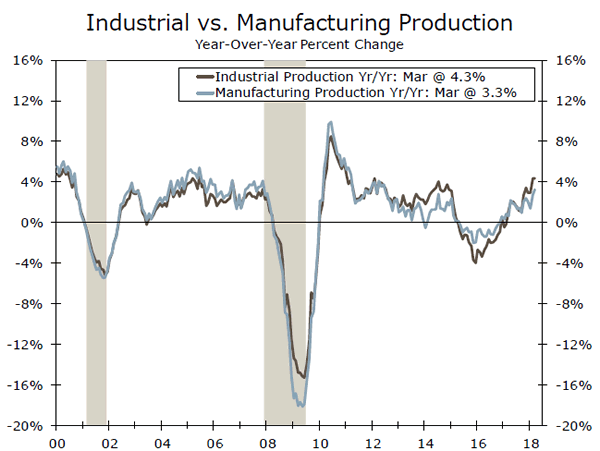
Industrial production beat expectations and expanded 0.5 percent in March, bringing a 4.5 percent annualized increase for the first quarter. Over half of March's gain occurred from a rebound in utilities output, driven by increased heating needs due to unseasonably cold temperatures in the Northeast and South. Mining output continued to recover alongside rising oil prices and grew 1.0 percent. Meanwhile, manufacturing output stalled after February's substantial gain, increasing a modest 0.1 percent for the month.
Overall, the factory sector appears in good shape. Manufacturing output only registered a modest improvement in March, however the slight gain followed the largest monthly gain since the end of the recession. We anticipate growth in the sector to continue, as core capital goods orders have been solid and the ISM manufacturing survey also remains near cycle highs.
Previous: 0.5% Wells Fargo: 0.7% Consensus: 0.5% (Month-over-Month)
Global Review
BoE Holds & Reasons Not to Fear Soft Canadian Jobs
- The Bank of England kept its benchmark rate unchanged at 0.50 percent at its meeting this week. The vote was split 7-2 with the dissenting votes both favoring a hike. A soft print for GDP growth in Q1 took some urgency out of the BoE's rate hike plans, though stronger growth in the coming quarters should eventually support further rate hikes from the BoE (see Interest Rate Watch).
- Canada had another disappointing print for the April jobs report. In this week's Global Review we get into the details of the Canadian labor market and actually find signs of strength.
A Soft Patch for Canadian Job Market? Not Really.
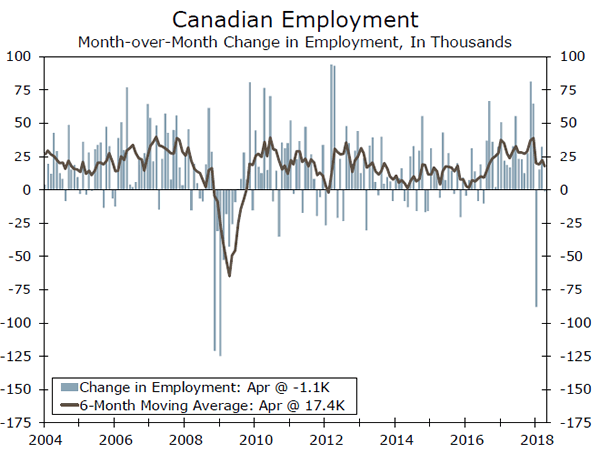
2017 was a stand-out year for the Canadian economy and that was particularly evident in the labor market. Canadian employers added to payrolls by the most in 15 years. Over 400,000 net new jobs were added at an average pace of about 35,000 jobs per month. In the fourth quarter, hiring picked up to an average monthly gain of 57,900.
Since the start of 2018, the job market has been more hit-and-miss. There were net layoffs in January of 88,000, though the drop then was entirely a function of a decline in part-time work. February and March were better, but only marginally so, with a net pick-up of fewer than 50,000 jobs. This week, despite expectations for a modest increase, the jobs report for April showed a small 1,100 decline.
"We'd Like to Make You Full-Time"
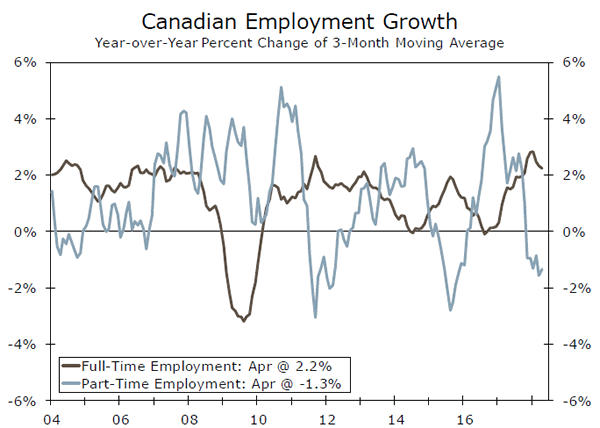
Despite the apparent slowdown, we are not convinced that the downshift in job growth necessarily signals tougher times for the Canadian economy. While it is true that job growth has slowed and the unemployment rate has stalled at 5.8 percent, the recent weakness has been more evident in part-time work than it has for full-time.
Full-time jobs actually increased 28,800 in April. In fact, the average increase in full-time jobs in the first four months of 2018 is 26,700, roughly in-line with the 32,600 pace of 2017. The yearto- date decline of 41,400 jobs in Canada is entirely attributable to a 148,200 decline in part-time jobs at a time when employers have simultaneously added over 100,000 full-time jobs. It is increasingly the case that businesses in Canada are hiring full-time workers and cutting part-time staff.
Another reason why the stalling of overall job growth is not particularly worrisome is the fact that Canadians are getting paid more. Average hourly earnings hit $27.02 CAD in May. That is a 3.6 percent increase on a year-over-year basis, making it the fastest pace of earnings growth in almost six years. That is hardly the sort of wage dynamic you would expect to see in a stalling job market.
How Will the Bank of Canada Look at This?
There is no shortage of hand-wringing in financial markets about the jobs news; the Canadian dollar was off about four cents versus the U.S. dollar in the immediate wake of the employment report. On that basis, it appears that not everyone shares our admittedly sanguine assessment of the job market. The real question is what the Bank of Canada thinks about the labor market and the extent to which the recent acceleration in earnings growth will translate into higher inflation.
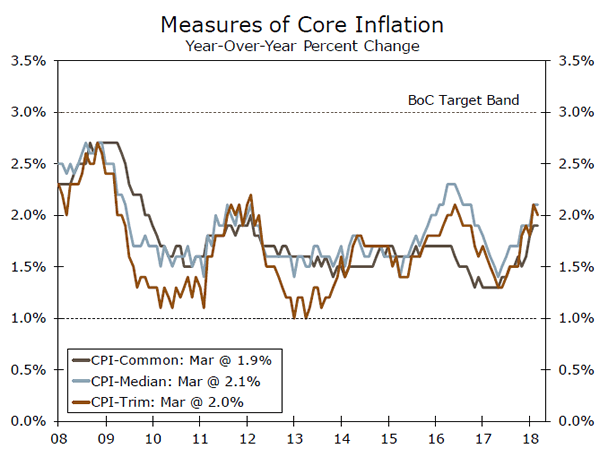
While we have concerns about elevated consumer debt levels and overheated home prices, Canada's full year GDP growth was 3.0 percent in 2017 and economic conditions remain supportive for modestly higher inflation. Core measures of the CPI have edged higher but remain in the middle of the BoC's target range. That ought to be supportive of another rate hike in the second half of the year in our view.
Global Outlook
Chinese Retail Sales • Monday
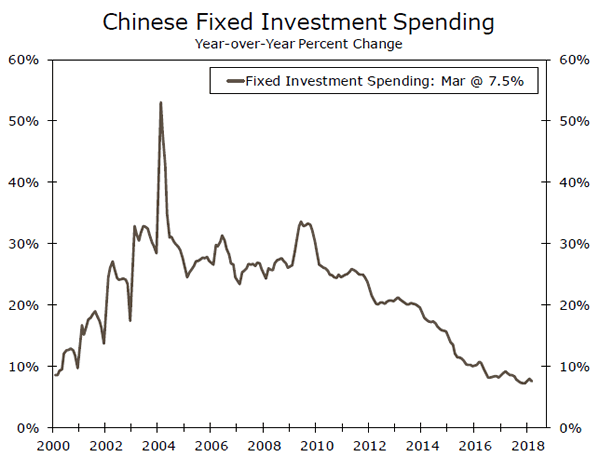
Chinese economic growth once again held steady at 6.8 percent year over year in Q1-2018, and next Monday will offer the first look at key data on how the second quarter started. April data on Chinese retail sales, industrial production and fixed investment are due to be reported. Retail sales rebounded strongly in Q1 after hitting a rough patch in Q4-2017, but investment spending and industrial production both decelerated in March.
If next week's data show industrial production and/or investment spending decelerating further, this would be supportive of our call that Chinese economic growth will gradually slow this year as policymakers grapple with large debt burdens in some sectors of the economy. A pick-up in both consumption and investment, however, would be a preliminary sign that Chinese economic growth in Q2 will hold steady yet again around 6.8 percent.
Previous: 10.1% Consensus: 10.0% (Year-over-Year)
Japanese GDP • Tuesday
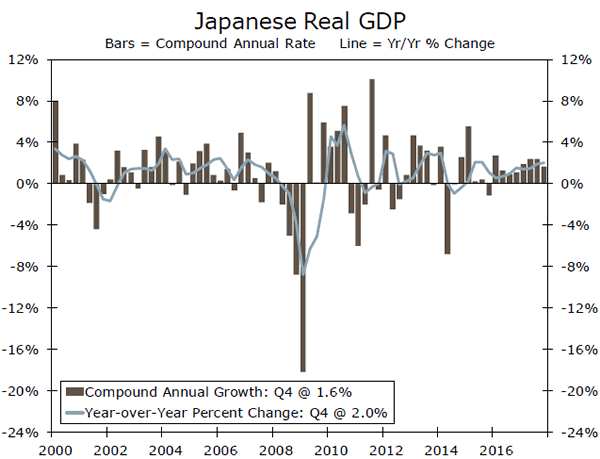
Japan's economy has managed to successfully register the longest period of uninterrupted growth since the 1986 expansion. While a welcome development, the sequential growth rate slowed in Q4-2017, and the consensus forecast is for another deceleration in Q1-2018. A broad-based slowdown in growth in advanced economies and a generally stronger yen in Q1 may have weighed on Japanese export growth.
The Japanese consumer price index also prints next week (Thursday). Both headline and core inflation remain well short of 2 percent. This fact, coupled with economic growth that appears to have slowed in back-to-back quarters, puts little pressure on the Bank of Japan to begin tightening monetary policy anytime soon. At its core, an aging population and years of low inflation/deflation have weighed on potential growth and inflation expectations in Japan, and reversing these trends is a herculean task.
Previous: 1.6% Wells Fargo: 0.0% Consensus: -0.1% (Quarter-over-Quarter, SAAR)
Canadian CPI • Friday
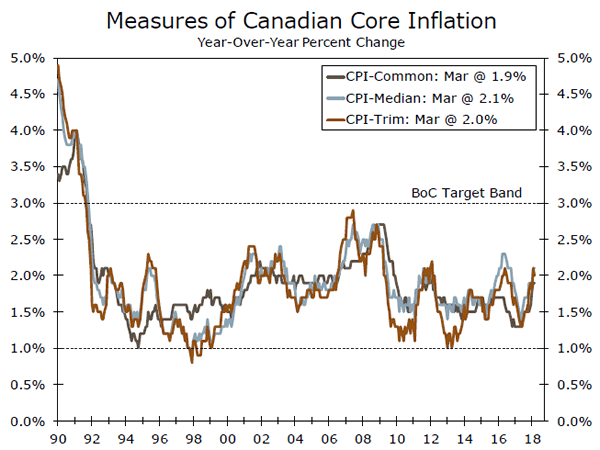
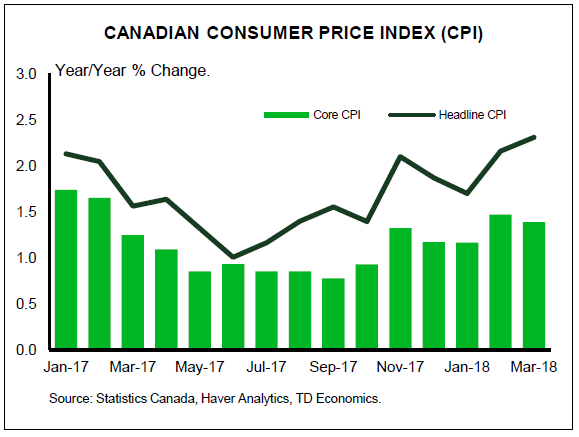
Bank of Canada (BoC) policymakers have faced a bit of a dilemma of late. Torrid economic growth in H1-2017 gave way to monetary policy tightening, but real GDP growth promptly slowed in the second half of the year. Early signs are that this slowdown in growth continued into Q1-2018. On the inflation front, all three of the central bank's preferred core price growth measures are hovering smack in the middle of the Bank of Canada's 1-3 percent target band.
High household debt levels are an ominous threat to the Canadian economy, and NAFTA-related uncertainty continues to lurk in the background. With inflation under control and economic growth having come back down to Earth, we continue to hold the view that the Bank of Canada will hike its main policy rate just once more in 2018. A pick-up in inflation is one catalyst that could force the BoC's hand and alter our view.
Previous: 2.3% (Year-Over-Year) Wells Fargo: 2.2%
Point of View
Interest Rate Watch
BoE and ECB on Hold Indefinitely?
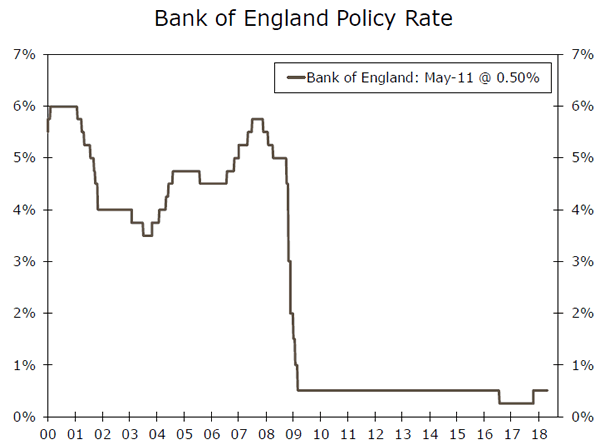
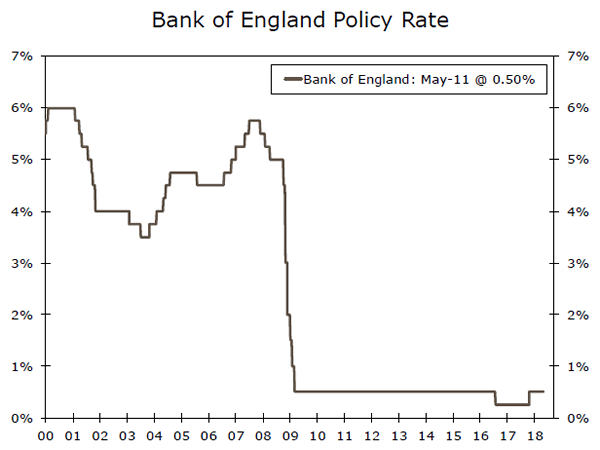
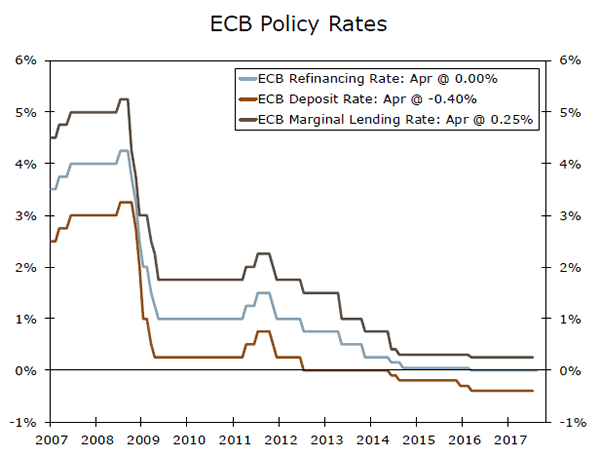
The Monetary Policy Committee (MPC) of the Bank of England decided this week to keep its main policy rate unchanged at 0.50 percent (top chart). Up until a few weeks ago, it appeared that the MPC would hike rates 25 bps at this policy meeting. However, the weak GDP growth rate that was released on April 27—real GDP grew only 0.1 percent (not annualized) on a sequential basis in Q1—evidently made some MPC policymakers hesitant to hike rates at the present time.
The market now assigns a greater-thaneven chance that the MPC will be on hold for the rest of the year. We are not so sure, because we look for GDP growth to rebound in coming quarters. We acknowledge the downside risks that Brexit uncertainty imparts to the economic outlook, but we still forecast that the MPC will raise rates 25 bps at the August 2 policy meeting. After that rate hike, we then look for the MPC to remain on hold through the end of the year.
Across the English Channel, the Eurozone has also shown some signs of economic deceleration recently, but not to the same extent as in the United Kingdom. Although we do not look for growth to rise again to the rates that were registered at the end of last year—real GDP grew 2.8 percent in Q4 2017, the strongest year-over-year rate in more than six years—we forecast that growth will generally remain solid.
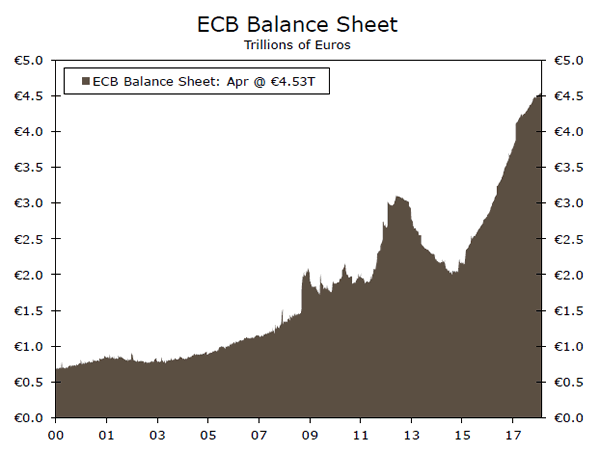
The Governing Council of the ECB left its policy unchanged at its last meeting, which was widely expected. The ECB has said that it intends to continue to purchase €30 billion worth of bonds through September. We then look for it to "taper" its purchases to €10 billion or €15 billion per month through the end of the year, before ceasing to buy bonds altogether.
The next question is the timing of potential rate hikes. We look for the ECB to raise its deposit rate from -0.40 percent to -0.20 percent about a year from now. We forecast that sometime next summer it will then take its deposit rate to 0.00 percent while also lifting its main refinancing rate to 0.10 percent. We look for that rate to end 2019 at 0.25 percent.
Credit Market Insights
Demand of C&I Loans Weakened
This week, the Federal Reserve released its senior loan officer survey for Q1. The survey examines lending practices and behaviors among domestic and foreign banks and reports customer demand for different types of loans. On net, domestic and foreign banks reported an easing of standards for commercial & industrial (C&I) loans. The respondents cited increased competition among other lenders as the primary reason why standards were lowered. Banks also pointed to a more favorable economic outlook and less uncertainly surrounding the recent legislative changes as reasons for loosening loan terms.
Despite the encouraging economic environment from lenders' perspective, customers' views appear to differ. A net percentage of banks reported that demand for C&I loans weakened in Q1. In fact, demand for all types of loans (credit cards, autos, CRE) have weakened on a four-quarter moving average. Moreover, banks overwhelmingly reported weaker demand for all types of residential mortgages even as lending standards are being relaxed. Rising short-term rates, which directly translate to higher mortgage rates, seem to be affecting customer demand. The clearly telegraphed timeline of the Fed regarding the shrinking of its balance sheet and plans to continue along its tightening path likely influenced potential home buyers and businesses to lock in low fixed rates ahead of all-but-certain higher rates in the near future.
Topic of the Week
Trouble Brewing in Developing Economies?
Argentina was in the news this week due to the recent free fall in its currency. (The peso, which is down about 10 percent against the U.S. dollar since late April, currently sits at an all-time low versus the greenback.) The country went to the IMF this week requesting financial assistance. The Turkish lira has also been pounded in recent weeks, and the currencies of many other developing economies have also softened vis-à-vis the dollar. Could another "taper tantrum" à la 2014-15, when prices of financial assets in most developing economies came under downward pressure due to expectations of eventual Fed tightening, be in the offing?
An environment of rising U.S. rates erodes the attractiveness, everything else equal, of riskier assets such as emerging market stocks and bonds. As long as the Fed is "in play," prices of financial assets in developing economies could experience some downward pressure. But we would expect that any significant weakness would be largely confined to individual economies rather than to the entire asset class.
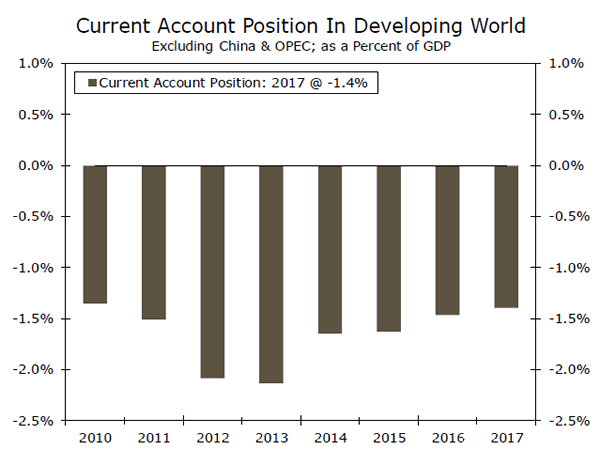
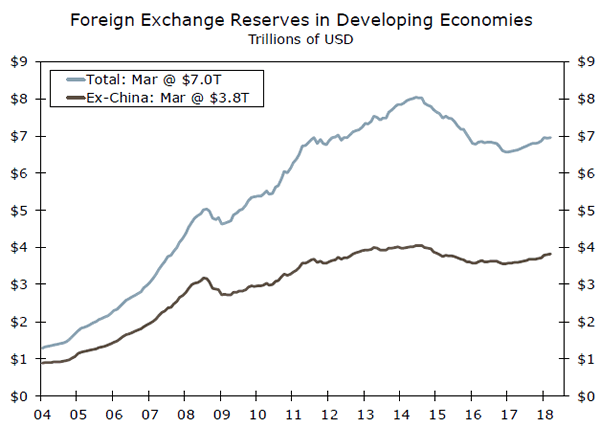
Argentina and Turkey have large current account deficits on the order of 5 percent or so of each country's respective GDP. These deficits need to be financed via capital inflows from abroad, and these inflows can quickly dry up in an environment of rising U.S. rates and/or risk aversion. But the aggregate current account deficit in the developing world (excluding China and OPEC countries) has narrowed over the past few years (top chart). Therefore, developing economies in general are not quite as dependent on foreign capital inflows as they were just a few years ago. Furthermore, many developing economies have built up ample war chests of foreign exchange (FX) reserves over the past decade or so (bottom chart), and these FX reserves can be used to offset some of the downward pressure on those currencies. Although some developing economies could experience continued financial market volatility, we do not look for another generalized "taper tantrum."
The Weekly Bottom Line: Upping the Stakes
U.S. Highlights
- Domestic equity markets shrugged off news that the U.S. administration is pulling out of the current Iran deal while leaving the door open to renegotiation.
- WTI oil rose for a fifth consecutive week. Rising U.S. gasoline prices helped drive headline inflation to 2.5% y/y, the fastest pace of price growth since February 2017.
- A loss of momentum in underlying inflation in April should help reduce concerns that the Federal Reserve isn't moving fast enough to cool a hot U.S. economy.
Canadian Highlights
- Crude oil prices hit a 3½ year high this week, with the WTI benchmark hitting US$71 per barrel. While expectations of a U.S. withdrawal from the Iran nuclear agreement have helped to bid up prices recently, the actual impact on the oil market is likely to be limited.
- Housing starts slowed to 214k in April, while employment was flat. The unemployment rate held at 5.8%, while wage growth came in above 3% for a fourth consecutive month.
U.S. - Upping the Stakes
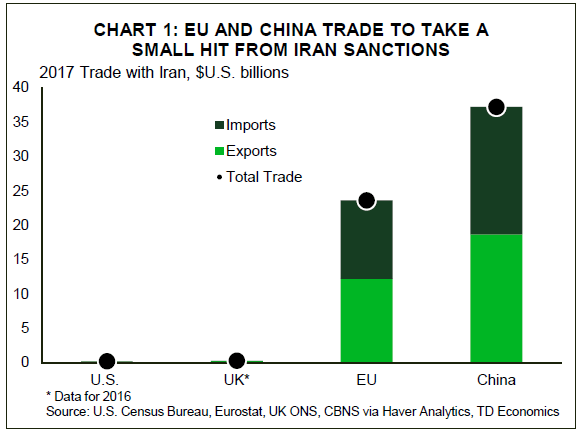
Events this week remind us of how uncertain the world can be at times, and how unpredictable financial markets can be. On Tuesday President Trump announced that his administration will no longer be part of the current Joint Comprehensive Plan of Action (JCPOA). That was a 2015 deal agreed to by the U.S., UK, EU, Germany, France, Russia, and China that lifted sanctions against Iran in return for a promise to pause its nuclear program. Although pulling out of the agreement will have limited direct economic implications for the U.S., the imposition of sanctions on Iran and the threat to do so on those nations that continue to do business with it, is likely to deal a blow to its trade partners (Chart 1).
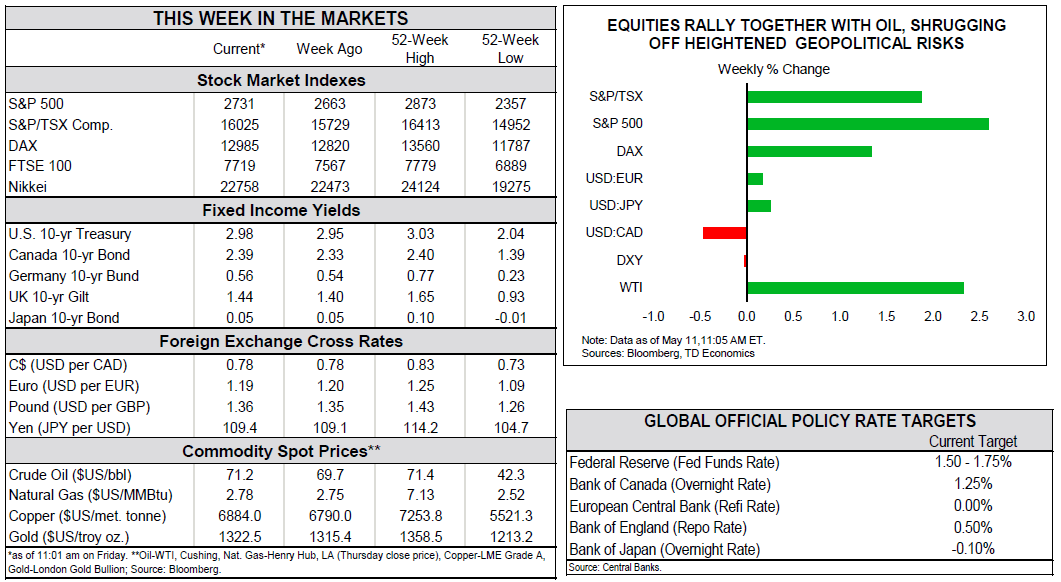
Financial markets were caught somewhat off-guard by the decision, with conflicting news headlines generating gyrations throughout the day. Since a renegotiation of the deal is a possibility, markets shrugged off the news, with domestic equity markets likely to end the week up 2%. WTI oil prices also moved higher this week, holding above US$70 on this and other news of escalating Middle East tensions.
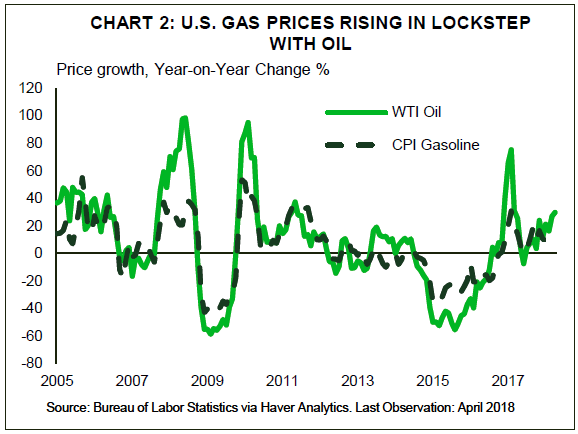
Oil prices have been rising steadily over the past five weeks, with implications for the domestic and global economy. Higher energy prices should help support domestic investment and overall economic activity in oil exporting countries such as Saudi Arabia, Canada, and increasingly the United States. However, consumers will likely feel the pinch from higher energy prices, as the rising price of gas reduces their overall purchasing power.The pass-through to consumers from rising energy prices is usually quite brisk, and this time is no exception (Chart 2). The U.S. CPI report for April saw prices rise 2.5% over the past twelve months, largely owing to a strong upward move in the price of gasoline (+13.4% y/y). Aside from energy, shelter costs continue to tick up, a reflection of tight housing inventories in many U.S. cities that is sending home prices higher.
Abstracting from energy and other volatile prices, underlying price pressures remain fairly subdued despite strong economic activity and tightening labor markets. Core inflation lost some momentum in April, as price growth in core services slowed a touch. Still, core inflation registered a 2.1% gain year-on-year, but that includes a fading base-year effect from the dip in telecommunications prices last year that is acting to prop up inflation.
The loss of inflation momentum may help reduce concerns that the Fed isn't moving fast enough to cool off a hot economy. Inflation is likely to hold near the Fed's 2% target for the remainder of the year, with the economy running just hot enough to warrant two more rate hikes this year. That said, downside risks to the domestic and global outlook continue to materialize. Although they have had limited impact thus far, things can quickly escalate. While the Iran sanctions act to elevate the risk of a trade war between the U.S. and its trade partners, all parties appear open to dialogue. Still, this decision adds further pressure on Europe and China to settle trade imbalances with the United States.
Canada - Oil Prices Up, But Well Above Fundamentals
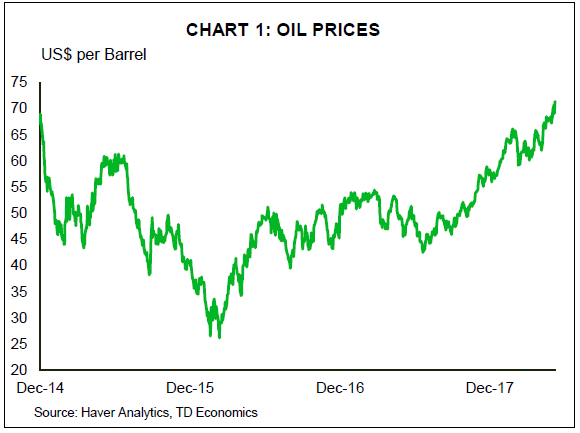
Crude oil prices hit a 3½ year high this week, with the WTI benchmark hitting US$71 per barrel. This helped drive the S&P/TSX up modestly during the week while the loonie edged up to just over 78 US cents. Oil prices have been trending up in recent months, with the push above US$70 per barrel this week triggered by a bullish U.S. storage report, unrest in the Middle East and President Trump's announcement that the U.S. is pulling out of the Iran nuclear deal that Obama signed in 2015, reinstating sanctions.
While expectations of a U.S. withdrawal from the agreement have helped to bid up prices recently, the actual impact on the oil market is likely to be limited. It doesn't appear as though the other countries that signed the agreement will follow in the footsteps of the U.S., and the sanctions will take up to 6 months to fully implement. As such, current estimates put the supply disruption in Iran at up to 500,000 barrels per day (about half the likely impact if all other countries were to support the U.S. action). While significant, the OPEC/non-OPEC agreement in effect until the end of this year has left the market with plenty of spare capacity that could be used to meet any shortfall. Indeed, Saudi Arabia - who has cut output by more than its agreed upon amount - has already indicated that it would respond to any shortage if necessary.
That said, Saudi Arabia has also indicated in recent weeks that the global oil market is not as tight as some may believe and that the 5-year average target for inventories - which is in sight - is not the best metric to use. This is because it has been driven higher over the last few years as a result of the glut in the market. As such, there may not be a need to make up any shortfall from Iran caused by Trump's withdrawal.
All told, oil prices have been lifted in no small part by geopolitical risks, and are sitting well above the price that supply and demand fundamentals would suggest. With speculative activity (as measured by non-commercial net long positions on the NYMEX) elevated, non-OPEC production set to continue rising - particularly in the U.S. - and the market still amply supplied, the risks for oil prices are tilted to the downside.
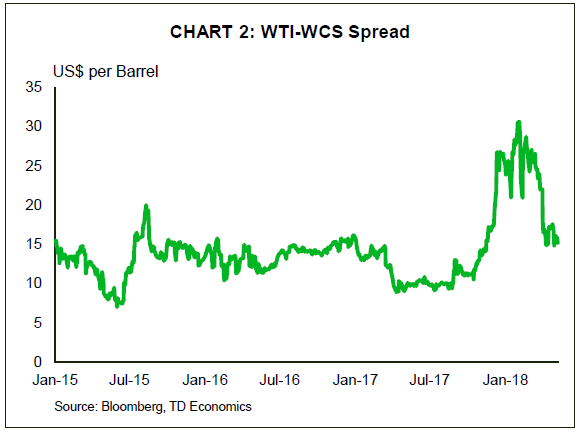
In Canada, producers are starting to reap more benefit from higher oil prices, with the WTI-WCS spread narrowing to just over US$15 per barrel this week. This is down from the peak of $30 per barrel reached earlier this year and moving close to the $13 per barrel average seen over the last two years. The improvement in oil prices should help the economy on the income side, while other economic indicators remain solid.
Data out this week showed housing starts slowed to 214k (annualized) in April, but are sitting at a healthy pace nonetheless. Meanwhile, employment was flat on the month, although full-time positions rose and wage growth held above 3% for a fourth straight month. The Bank of Canada will look favourably upon the steady wage gains, but will still have to take into account a number of uncertainties, both domestic and external. At this point, we expect the next rate hike to come in July.
U.S.: Upcoming Key Economic Releases
U.S. Retail Sales - April
Release Date: May 15, 2018
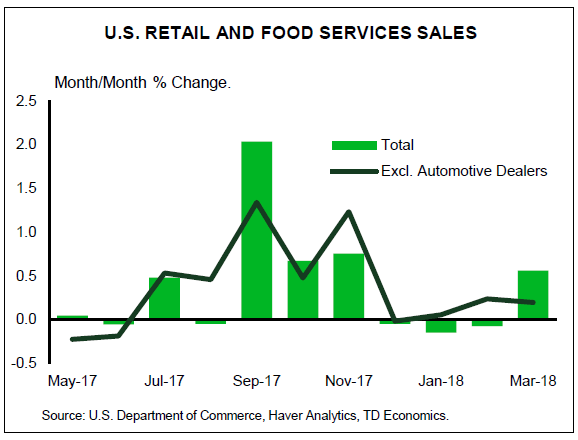
Previous Result: 0.6%, ex-auto 0.2%
TD Forecast: 0.0%, ex-auto 0.3%
Consensus: 0.4%, ex-auto 0.5%
We look for a flat read on retail sales in April, held down by weaker auto sales. We also expect colder temperatures to temper sales, concentrated in the building materials and food services categories, which points to a modest showing in the control group (0.2%). However, given the strong handoff from March, the report would still be consistent with Q2 real consumer spending near 2.5%.
Canada: Upcoming Key Economic Releases
Canadian Manufacturing Sales - March
Release Date: May 16, 2018
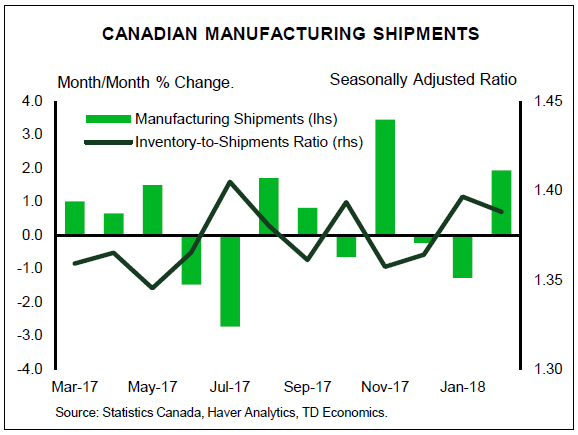
Previous Result: 1.9% m/m
TD Forecast: 1.1% m/m
Consensus: N/A
TD looks for manufacturing sales to rise by 1.1% m/m in March, led by a nominal increase in energy products. Gasoline prices have surged in recent months on speculation over the future of the Iran nuclear deal but with refining capacity utilization near multi-year highs further upside on volumes for energy products will be limited. Outside of energy we expect a fairly muted advance in contrast to the sharp increase in export activity. Auto production has normalized after months of disruptions and early production estimates are little changed on the month. However, manufacturing surveys continue to point to robust conditions and provide little evidence that threatening rhetoric is impacting activity. Our forecast is consistent with real manufacturing sales growth of 0.5%, which would support industry-level growth for the month.
Canadian Retail Sales - March
Release Date: May 18, 2018
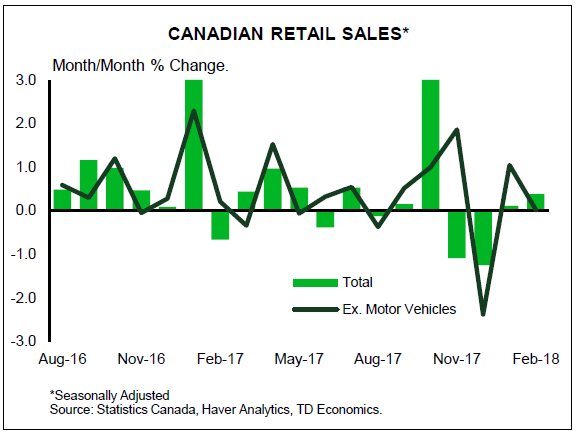
Previous Result: 0.4%, ex-auto: 0.0%
TD Forecast: 0.2%, ex-auto: 0.5%
Consensus: N/A
Retail sales are forecast to rise by a muted 0.2% as a pullback in motor vehicle sales offsets a rebound in ex-autos after a disappointing flat print in March. Cold weather will weigh on auto sales in March along with the shaky housing market, which introduces uncertainty around the durability of wealth effects. Meanwhile, gasoline station sales will make a positive contribution on the sharp rise in the price at the pump, a dynamic that will weigh on real incomes in the months ahead. We expect real retail sales to remain largely unchanged on the month, which would leave volumes down for Q1 after sales cratered into year-end. Thus, the decline is due largely to a poor hand-off from Q4 and we would note that retail sales only account for roughly 45% of household spending, allowing some divergence against national accounts data.
Canadian Consumer Price Index - April
Release Date: May 18, 2018
Previous Result: 0.3% m/m nsa, 2.3% y/y, Index: 132.9
TD Forecast: 0.4% m/m nsa, 2.4% y/y, Index: 133.5
Consensus: N/A
We expect headline CPI to rise to 2.4% y/y, reflecting a 0.4% m/m gain, matching the seasonally adjusted increase. Driving the pickup is gasoline prices, which rose over 7% in April, leaving overall energy prices a net positive. After running weak in the prior to two months food prices are expected to rebound, helped by a weaker CAD.
Outside of food and energy, we expect price pressures to post a more moderate m/m increase after recording relatively strong gains over the prior three months. A few categories tempering price gains in April are the following: healthcare is due for a correction while recreation/education should pullback on sporting equipment and travel services. Downward pressures should continue within the housing component of shelter, overpowering the lift from higher mortgage rates (link CPI piece).
Elsewhere, other oneoffs (internet services hikes, tobacco taxes) along with currency pass-through offer positive offsets, leaving prices up on balance in the exclusion-based core indexes (CPIX and CPIXFE). We expect these indexes, which have been underperforming the BoC core measures, to rise modestly on a y/y basis. Meanwhile, the average of the BoC measures, which stabilized at 2.0% in March, have more limited scope for further gains in our view. Looking ahead, with gasoline prices likely to rise into the summer, we expect headline inflation to continue to firm and peak at 2.7% y/y in June. This trajectory reflects relatively stable core inflation near 2%, reinforcing the view that inflation remains in check.
Dollar Ends Rally Awaiting US Retail Sales Data
The US dollar rally lost momentum during the week and recorded its third day of depreciation versus other major pairs. The USD continues to gain versus emerging market currencies as more signs of a global growth slowdown appear. The US consumer price index (CPI) came in under expectations and raised concerns on how many rate hikes could the Fed get way with in 2018. Retail sales data will be published on Wednesday, May 15 at 8:30 am EDT. The changes to the tax code are touted as a victory for the White House but consumers will have the final say on its impact on spending.
- US Retail sales expected to keep rising at steady pace
- Oil prices to keep rising as uncertainty remains in the Middle East
- NAFTA negotiations to continue as US President Trump still critical of deal
USD Loses Momentum with Retail Sales Hurdle Ahead
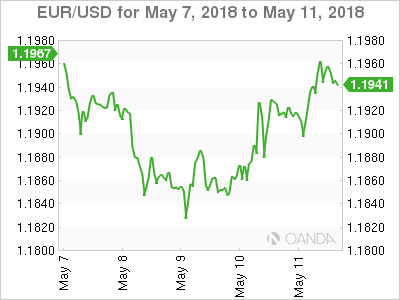
The EUR/USD lost 0.08 percent in the last five days. The single currency is trading at 1.1950 as the USD depreciated as investors closed their long dollar positions. European Central Bank (ECB) President has stated that there are concerns about European growth, which could translate into lower rates for longer even as the U.S. Federal Reserve keeps tightening monetary policy with an expected 2 to 3 more rate lifts this year.
European indicators to keep a look out this week include the preliminary figures of German Gross Domestic Product (GDP) due on Tuesday, May 15 at 2:00 am. The EU will also publish the flash GDP figures at 5:00 am EDT. Both numbers are expected to show a gain of 0.4 percent. German Economic Sentiment published by the ZEW had a shock drop last month and that trend is expected to continue with a –8 reading as institutional investors and analysts remain pessimistic about the German outlook.
The final estimate of the European consumer price index (CPI) will be released on Wednesday, May 16 at 5:00 am EDT with a forecast of 1.2 percent.
Canadian Dollar Higher Due to Oil Price Lift
The USD/CAD lost 0.52 percent during the week. The currency pair is trading at 1.2781 as the loonie had a volatile week after the US announced it would be pulling out of the Iran nuclear deal. The price of oil pushed higher and took the CAD along for the ride. The USD lost momentum with the release of weaker than expected inflation data on Wednesday. Less inflationary pressure could end up with the Fed shelving a third rate hike from the already priced in 2 upcoming ones this year.
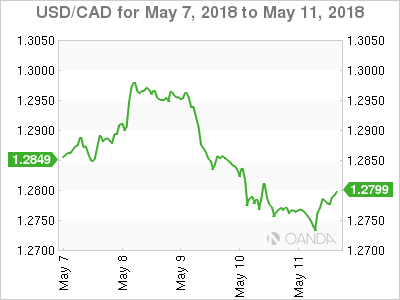
The Canadian dollar closed the week on the wrong foot with employment data missing the forecast with a lost of 1,100 positions instead of the gain of 18,000 jobs. Wages rose at a 3.3 percent clip and buried in the report was the fact that Canada had added 28,800 full time jobs. The data continues to be mixed but could put the Bank of Canada (BoC) off from hiking rates just yet. The market expects at least a rate hike in 2018 so the central bank can close the gap with the U.S. Federal Reserve.
Inflation will be key at the end of the week with the release of the Canadian CPI data on Friday, May 18 at 8:30 am EDT. Inflationary pressures have been positive as the Canadian economy seems to have gotten out of the growth slump, but outside factors remain on the BoC radar. The NAFTA renegotiation has accelerated in the last month, but now it has reached a difficult point as the US deadline approaches. The deadline is an arbitrary date on May 17, but if all three nations can’t agree on a way moving forward the hard deadline of the Mexican Presidential elections on July 1st could push any probabilities of a new round of negotiations until next year.
US President Donald Trump continues to criticize the deal as he met with representatives of the auto sector on Friday. The US team has softened its hardball tactics, but to reach an agreement it might have to do more to guarantee the other partners agree to its demands.
Negotiators from Canada, Mexico and the United States were working throughout the week and although they all mentioned great progress a deal remains out of reach. Negotiations will resume next week .
Oil Continues Upward Trend on Uncertainty of Iran’s Supply
The price of West Texas Intermediate remains above $71 in the aftermath of the US pulling out of the Iran nuclear deal. The greenback rose as investors looked to the currency as a safe haven. US President Donald Trump announced that the US would be pulling out of the 2015 nuclear agreement and would reimpose economic sanctions on Iranian exports. The move was not unexpected as the Trump administration had criticized the deal but allies were hoping the US would remain, as it stands there are still 5 nations who are backing the deal. The United Kingdom, France, China , Russia and Germany remained committed to the deal where Iran will receive no sanctions as long as it complies with stopping its uranium enrichment program.
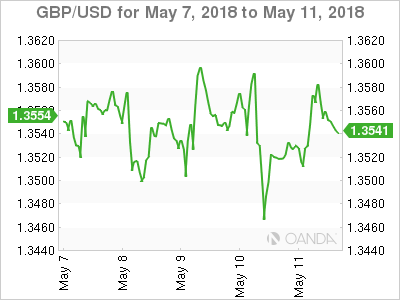
It is still unclear what the true effects of the US ending its participation in the deal. Although sanctions will come into effect, the fact that support remains from other nations as long as Iran continues to uphold its end of the deal take some of the pain from lost oil export revenue.
Global supply is not an issue. Demand has not increased significantly which is why the biggest factor before this geopolitical event was the Organization of the Petroleum Exporting Countries (OPEC) and other major producers limiting output. The US shale industry is ready to step in and cover any shortfall from Iranian supply.
Market events to watch this week:
Monday, May 14
- 9:30pm AUD Monetary Policy Meeting Minutes
Tuesday, May 15
- 4:30am GBP Average Earnings Index 3m/y
- 5:00am GBP Inflation Report Hearings
- 8:30am USD Core Retail Sales m/m
- 8:30am USD Retail Sales m/m
- 9:30pm AUD Wage Price Index q/q
Wednesday, May 16
- 8:30am USD Building Permits
- 10:30am USD Crude Oil Inventories
- 12:00pm CHF SNB Chairman Jordan Speaks
- 9:30pm AUD Employment Change
- 10:00pm NZD Annual Budget Release
Friday, May 18
- 8:30am CAD CPI m/m
- 8:30am CAD Core Retail Sales m/m
*All times EDT
Week Ahead – Japanese GDP and US Retail Sales to be Main Highlights; Aussie and UK Jobs also Eyed
With the Bank of England completing the round of central bank meetings for the Spring, economic data will move to the forefront next week. The highlights will come from Japan’s GDP readings for the first quarter and retail sales figures out of the United States. Inflation will also be in focus as Japan, Canada and the Eurozone publish CPI numbers, while employment reports out of Australia and the United Kingdom will also attract attention.
First glimpse at Japanese Q1 growth
Japan will publish its initial reading on first quarter growth on Wednesday in a busy week for Japanese economic indicators. Investors will be eager to see whether the Japanese economy managed to post a ninth-consecutive quarter of expansion or if growth fell victim to the global soft patch and dipped into negative territory. GDP data out on Wednesday is expected to show a small contraction in GDP of 0.2% on an annualized basis.
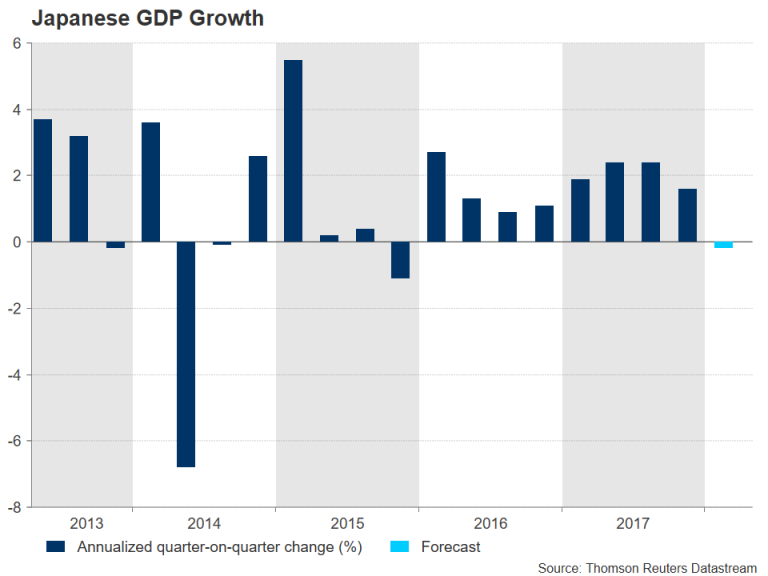
Inflation numbers due on Friday will also be closely watched. The 12-month rate in CPI had fallen back to 0.9% in April from 1% in March. It is expected to fall further to 0.8% in April. Other key data out of Japan will include April corporate goods prices on Monday and March machinery orders on Thursday.
The yen is likely to see the biggest reaction to the GDP data as a weaker-than-expected reading would be seen as reducing the odds of an early exit from QE by the Bank of Japan, and thereby weakening the yen.
Aussie looks to data as it seeks respite from sell-off
The Australian dollar has plummeted by over 7% since late January, but as it attempts to regain some footing above the $0.75 level, it will be looking to broaden its recovery with the aid of economic indicators next week. Wage growth figures out of Australia on Wednesday will be watched by traders to get a view about the strength of pay pressures during the first three months of 2018. Employment data will follow on Thursday. The Australian economy is forecast to have added 20k jobs in April, with the unemployment rate expected to remain unchanged at 5.5%.
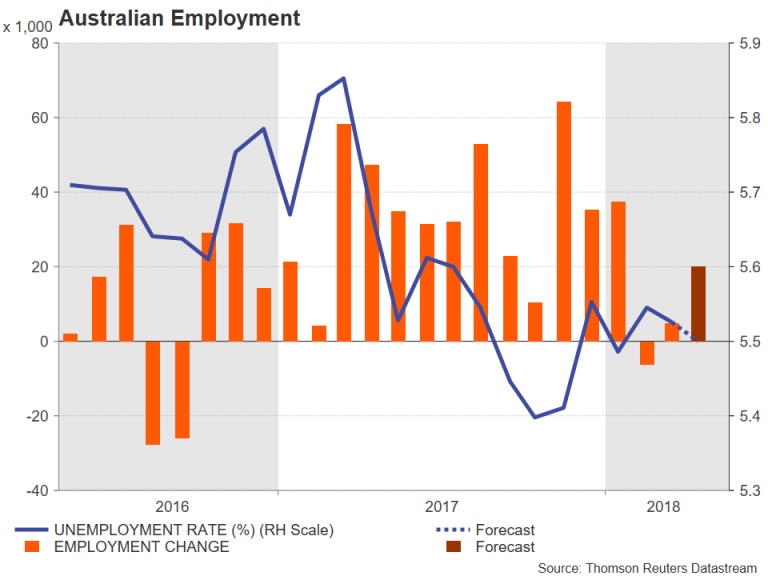
Positive news about the health of Australia’s labour market would help the aussie move further away from this week’s 11-month lows. However, investors shouldn’t expect much support from the minutes of the Reserve Bank of Australia’s May meeting. The minutes are scheduled for release on Tuesday and are unlikely to sway from the Bank’s consistently neutral tone. Also due on Tuesday are Chinese data, which may impact the aussie too, given that China is Australia’s biggest export destination. Both retail sales and investment in urban areas are forecast to have moderated marginally in the year to April, but industrial output is expected to quicken from 6.0% to 6.3% year-on-year.
Canadian inflation and retail sales eyed
Expectations that the Bank of Canada’s next rate hike could come as early as the summer have been given a boost following remarks by a more hawkish Governor Stephen Poloz recently. Inflation and retail sales figures due on Friday could further fuel such expectations if they point to a strong economy. Inflation in Canada has been heading higher in recent months and rose to 2.3% y/y in March, while retail sales have been recovering from a plunge in late 2017. The Canadian dollar could extend this week’s rebound from the C$1.30 level when it hit 7-week lows, should the data surprise to the upside.
UK jobs under the spotlight after downbeat BoE outlook
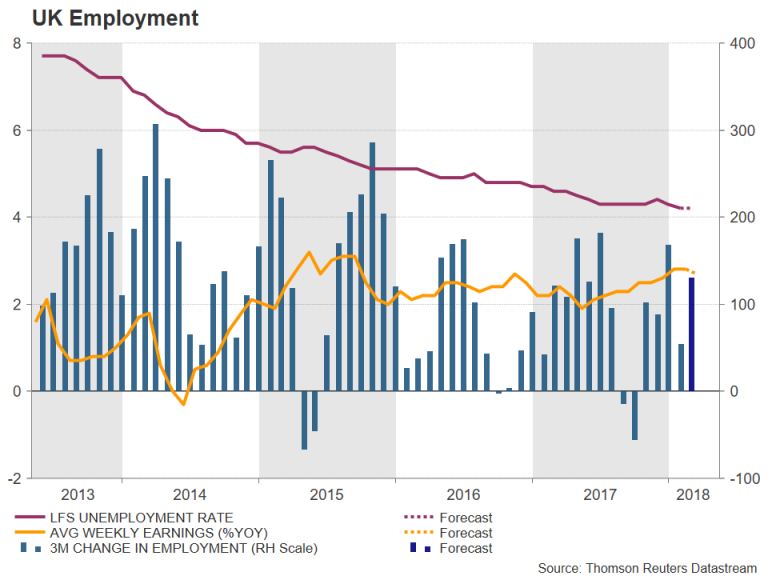
The Bank of England made it clear this week that an interest rate hike is dependent on growth bouncing back over the coming quarters after near stagnant performance during the first quarter. Employment figures on Tuesday will therefore be closely watched for evidence that the UK labour market continues to tighten, and that wage growth is accelerating. The jobless rate is forecast to hold steady at 4.2% in the three months to March, while 130k jobs are expected to have been created during the same period. Average weekly earnings are forecast to rise by 2.7% y/y in the March quarter, slower than the prior 2.8%. Should the data miss estimates, the pound could face renewed selling pressure.
Across the channel, it will be a more muted week for the Eurozone calendar. Euro area GDP growth will likely be confirmed at 0.4% quarter-on-quarter in the second reading for the January-March period on Tuesday. Industrial output for March will be published alongside the GDP data, as well as the German ZEW business survey. The ZEW economic sentiment gauge is expected to show investor confidence failed to bounce back in May, with the index staying unchanged at -8.2. On Wednesday, the final CPI print for April is not expected to show any revision to the preliminary numbers.
US retail sales to ease slightly
After somewhat disappointing CPI figures out of the US this week, dollar bulls will be hoping Tuesday’s retail sales numbers will do a better job of raising expectations for a fourth rate hike this year. Retail sales are forecast to rise by 0.4% month-on-month in April, slightly slower than the prior 0.6%. Housing data will dominate on Wednesday with the release of building permits and housing starts for April. Also due on Wednesday are April industrial production figures.
In the absence of major US data releases next week, the greenback may nevertheless maintain its uptrend, especially if US Treasury yields remain elevated. The yield on 10-year Treasury notes briefly rose back above 3% this week after crude oil prices jumped higher when President Trump withdrew the US from the Iran nuclear deal. (Higher oil prices are positive for sovereign bond yields as they boost inflation expectations). Oil prices could extend their gains in the coming days if the monthly reports by OPEC and the International Energy Agency (IEA), due on Monday and Wednesday respectively, point to further tightening in the oil market.
Australia & New Zealand Weekly: Federal Budget 2018 – An Improved Budget Position, but Downside Risks Remain
Week beginning 14 May 2018
- Federal Budget 2018: an improved budget position, but downside risks remain.
- RBA: RBA minutes, Deputy Governor Debelle speaks.
- Australia: Wage price index, employment, Westpac-MI consumer sentiment.
- NZ: Federal Budget.
- China: retail sales, industrial production, fixed asset investment.
- Euro Area: GDP 2nd estimate.
- US: retail sales, Fed nominees testify before senate.
- Key economic & financial forecasts.
Information contained in this report current as at 11 May 2018.
Federal Budget 2018: An Improved Budget Position, but Downside Risks Remain
The Federal Treasurer delivered Budget 2018 on May 8. This was the second and likely last annual budget of this parliament prior to the next Federal election, which is due no later than 18 May 2019.
The backdrop to this years' budget is an improvement in the fiscal position relative to that expected by the Government in the December Mid-Year Economic and Fiscal Outlook (MYEFO). This is a welcome change from recent years, when the revenue profile was typically revised lower. A key development contributing to this change in fortune relates to commodity prices, which having fallen to historic lows at the end of calendar 2015 have rebounded and proven to be more resilient than anticipated.
Key themes for Budget 2018 are described by the Government as tax relief, which is to be phased in over a number of years, as well as progressively rolling out infrastructure spending in the context of the $75bn in initiatives over the next decade.
The Government is now forecasting the budget to improve from a deficit of 1.9% of GDP in 2016/17, to a deficit of 1.0% of GDP this financial year, narrowing a little to a deficit of 0.8% of GDP in 2018/19 (at $14.5bn), then moving to a small surplus in 2019/20, with the surplus widening to a forecast 0.8% of GDP in 2021/22.
Over the five years to 2021/22, the budget position improves by 2.7ppts of GDP. As with before, the improvement is centred on an expected lift in revenues. Total revenue increases from 23.3% of GDP in 2016/17 to a likely 24.3% this year and then lifts to 25.5% by 2021/22, an increase of 2.2ppts over the period. Total payments are little changed, edging down from 25.0% in 2016/17 to 24.7% in 2021/22.
Relative to MYEFO, the budget position has improved: by $5.4bn in 2017/18 to -$18.2bn; by $6.0bn in 2018/19 to -$14.5bn; by $4.8bn in 2019/20 to +$2.2bn; and improved by only $0.8bn in 2020/21 to $11.0bn; while the surplus is forecast to widen to $16.6bn in 2021/22, the additional year that rolls into the budget period. The timing of the return to surplus has been brought forward by a year, to 2019/20, to a forecast +$2.2bn from a forecast -$2.6bn.
In 2017/18, the Australian economy has been more resilient than anticipated, underpinning the improved budget position. Income growth, or nominal GDP, is now expected to be 4.25% this year, upgraded by 0.75ppts on MYEFO, reflecting upside on commodity prices, output and jobs growth. Note that nominal GDP growth of 4.25% is still well below the long run average of 5.6% and represents a slowing from a 5.9% outcome in 2016/17.
Nominal GDP growth over the 3 years from 2018/19 is expected to be: 3.75% (with the terms of trade -5.25%); 4.75% (tot -2.25%); and 4.50% (tot forecast is not provided); broadly in line with that in MYEFO. The Budget continues to anticipate that output growth lifts to a little above trend pace of 3.0% in 2018/19, with growth sustained at this rate across the forecast horizon.
The boost to the bottom line from the stronger economy is an estimated $7.0bn in 2017/18, with only a partial offset of $1.6bn from the net cost of new policy measures. Across the four years to 2020/21, the stronger economy boosts the budget by $27.8bn and the net cost of policy measures is $10.7bn. Hence, the expected cumulative budget deficit over the four years to 2020/21 is now some $17bn lower than expected in MYEFO, at a forecast $19.5bn.
Forecast tax receipts due to the stronger economy are $7.0bn higher in 2017/18 and increase by $25.8bn over the four years to 2020/21. This upside surprise on tax receipts includes: gross income tax up by $13bn, boosted by stronger jobs growth; and company taxes $3.7bn higher than anticipated, reflecting the impact of more resilient commodity prices.
The Commonwealth Government's net debt position remains manageable and the profile is now lower than previously expected reflecting the improved budget position.
Net debt lifts from an estimated 18.3% of GDP ($322bn) in 2016/17 to a peak, as a share of the economy, of 18.6% of GDP ($341bn) in 2017/18. In MYEFO, net debt peaked at 19.2% of GDP in 2018/19. In coming years, debt levels are expected to decline in dollar terms, to $334bn at June 2021, some $21bn lower than in MYEFO, and then falling to $319bn, 14.7% of GDP, at June 2022.
Net interest payments moderate over the forecast horizon, consistent with the profile of declining debt. Net interest payments moderate from an estimated $14.5bn, 0.8% of GDP, in 2018/19 to 0.6% of GDP in 2021/22. As to gross debt, this rises from $501bn (28.5% of GDP), in 2016/17, to $561bn, 29.5% of GDP, in 2018/19, before moderating as a share of the economy to 26.6% in 2021/22, at $578bn.
The Budget also focuses on medium-term projections. Consistent with past years, the approach to forecasting beyond the initial two year period is to assume that real GDP growth is 3.0%, which is a little above trend, with trend judged to be 2.75%, such that spare capacity in the economy is gradually absorbed. By the end of 2024/25 spare capacity is absorbed and real GDP is projected to grow at its potential rate thereafter. The unemployment rate is projected to converge to 5% over the medium-term, inflation is 2.5%, the mid-point of the RBA's target band, and the terms of trade remain flat at around their 2005 level from 2020/21.
The surplus is projected to reach 1.8% of GDP in 2028/29 in the absence of a cap on the tax share of GDP, with the cap set at 23.9%. By contrast, if tax is capped at 23.9%, the surplus reaches only a little above 1% of GDP from 2026/27.
In terms of policy decisions, the focus is on personal income tax relief. This begins in 2018/19, at a cost of only $0.4bn in that year, lifting to a $4.1bn cost in 2019/20, with a four year impact of $13.4bn. However, the net impact of policy decisions on tax receipts is $7.2bn over the four year with partial offsets from increased compliance measures and a crack-down on the 'black economy'. Beyond this period, the personal income tax plan is progressively implemented over the medium-term, with measures impacting in 2022/23 and in 2024/25. In the absence of the tax plan, it is projected that tax receipts would exceed 23.9% of GDP from 2021/22.
Over the near-term, the direct impact on the economy of Budget 2018 is negligible. The key point is that the net impact of new policy decisions is only $0.6bn in 2018/19, increasing a little to $1.5bn in 2019/20, before climbing to a more sizeable $6.9bn in 2020/21 and $5.7bn in 2021/22.
As to risks around the budget position, the experience of the past couple of years is that risks have receded somewhat as commodity prices proved to be more resilient than anticipated and jobs growth surprised to the high side, contributing to the improved budget position in this update.
Going forward, the risk remains that the economic forecasts are too optimistic. Notably, real output growth is expected to lift to above trend in 2018/19 and to hold at this pace until the output gap is closed out in 2024/25, after which growth settles back to a trend pace. Westpac Economics is less upbeat on growth prospects for 2018/19 and 2019/20, forecasting real GDP growth of 2.5% and 2.6%, with a view that consumer spending will be constrained by sluggish wages growth and as the housing sector cools. As to the medium-term view, over such an extended time horizon the risk of a period of sub-trend growth due to either a domestic or external shock is very real.
The week that was
This week, all eyes were on Budget 2018 and the subsequent reply from opposition leader Bill Shorten. The latter receiving greater attention than usual given this is the last Budget before the next Federal election - due by May 2019.
For the Government, the focus was tax reform; infrastructure; health and aged care made possible by a much-improved starting position, thanks to strong employment growth in 2017 and elevated commodity prices. All of the detail of the Budget can be found in the essay above, our video and a written summary.
The point to make with respect to Labor's reply is that the political debate for the coming year is shaping up around tax, particularly for low-to-middle income workers, as well as health and education - as you would expect. Whether the initial part of the Government's proposed tax reform will be passed by the next election will depend on if they break up their package into components or not. At present, they are unwilling to do so. More broadly on the Budget, our concern over the return to surplus is that it is built upon a sharp acceleration in wages growth, from 2.0%yr to 3.25%yr in two years, then to 3.50%yr the year after. To us, that seems unlikely, limiting the Government's capacity to deliver reform as planned.
Away from the Budget, there were two key data releases for Australia this week. First came another very strong result for the NAB business survey. In April, business conditions were reported to be at a historic high, with business confidence also well above average. For conditions, trading conditions; profitability and employment all moved higher from already elevated levels. Sentiment towards investment also remains constructive, albeit concentrated in construction. Importantly, the strength reported in conditions and confidence is broad based across the nation.
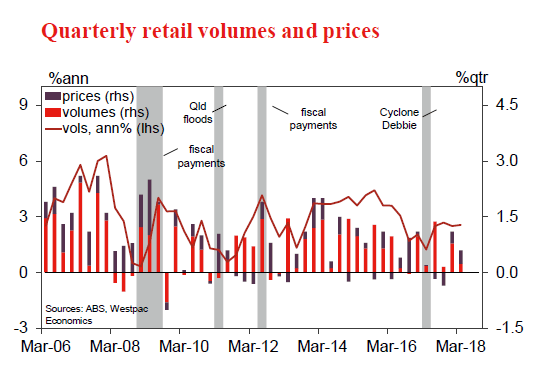
Of greater significance for the growth outlook however, retail sales in March were a material disappointment, signalling clear downside risks to consumption growth in the March quarter. See chart of the week below.
Overseas, the RBNZ met this week. Their May Monetary Policy Statement showed that the Bank is on hold for the foreseeable future, as long expected by our NZ economics team. The 'shake up' in form and language however came as a surprise to many in the market, with the NZD/USD falling around 1%. Inflation continues to stubbornly hold well below the 2.0% target, principally due to very low tradeables inflation. However, employment is viewed as near its maximum sustainable level. This then is justification not to cut rates further, but rather hold them at the current accommodative level for a protracted period. Our NZ economics team continue to see the first hike as likely to come in November 2019.
Over in the UK, the Bank of England held to a positive albeit cautious stance in May, with a 7-2 vote in favour of leaving the Bank Rate unchanged. Interestingly, the Bank believe that the poor March quarter GDP outcome of 0.1% is likely to be revised up, in opposition to the statistics agency. That said, their 2018 growth forecast has been revised down to 1.4%yr, from 1.75%yr in February, and 1.5%yr before that. Concern over inflation has also been alleviated somewhat by it retracing towards target quicker than anticipated, with the 2018 forecast revised down from 2.7%yr to 2.4%yr.
We recently revised our interest rate view for the UK from two hikes to end 2019 to none. We have been concerned over the state of the economy for some time, and downside risks look to be crystallising. Consistent with this view, the strong resolve of the Governor and Committee to actively rein in inflation to the 2.0%yr target looks to be dissipating.
Finally on the US, it has been an interesting week. The US 10yr yield has increasingly looked comfortable near 3.00%, as belief in continued rate hikes by the FOMC through 2018 and 2019 became more entrenched. Interestingly this has occurred despite further evidence of a distinct lack of wage and inflation pressures.
In the employment report, monthly growth in hourly earnings remained benign at 0.2% for a fourth month, showing no sign of an acceleration. In annualised terms, given headline CPI inflation is at a similar level, that implies real wages are flat. This is despite continued employment growth well in excess of population growth, and an unemployment rate at 3.9% - below its fullemployment level. Participation by prime-aged workers can rise further, so it is our view that wage pressures are still a way off.
On the CPI, overnight both the headline and core measures disappointed market expectations in April. Notably, the threemonth annualised pace of core CPI inflation has now decelerated to 1.8%, below the FOMC's target. Clearly for the FOMC, there is no need for any urgency with policy.
Chart of the week: Q1 retail sales volumes
The March retail report was a disappointing update that came in materially below expectations. Nominal sales posted a 0.6%qtr rise, but adjusting for prices, retail volumes rose just 0.2%qtr, well below the consensus expectation of a 0.5% gain.
The detail on retail volumes shows basic food retail rebounded 0.7%qtr from a 1.2% fall in Q4, but weaker quarter to quarter reads across almost all other store-type categories with department store sales volumes stalling flat and cafes & restaurants contracting 0.4%qtr. Online sales continue to outpace total retail with the online share rising to a new high of 5.3% in March.
Overall, the downside surprise for Q1 real retail sales clearly points to downside risks to the wider measures of consumer spending in the Q1 national accounts due out on June 6. That said, much of the weakness appears to reflect specific challenges facing the retail sector with business surveys suggesting consumer spending on services has been firmer.
New Zealand: week ahead & data wrap
The Reserve Bank served up a refreshing Monetary Policy Statement (MPS) under new Governor Adrian Orr, with straightforward language and an infographic. Beneath those cosmetic changes the outlook for the OCR was very similar to the outlook given in February - the OCR is on hold for a considerable period.
There was perhaps the slightest hint of a shift in a dovish direction. The reminder that the next move in the OCR could be either "up or down" was brought right up front in the document. And the actual OCR forecast was the barest shade lower (a tenth of a percent lower in a single quarter). Markets reacted strongly to that, and the New Zealand dollar fell nearly a cent over the day.
The RBNZ and financial markets are continuing to move incrementally closer to our view that a slowing economy might make it very difficult to boost inflation, and consequently the OCR will not need to rise until the end of 2019.
The most interesting aspect of the MPS was the RBNZ's treatment of its new employment mandate. The RBNZ came right out and stated that employment is currently roughly at its maximum sustainable level. That took guts - the Government will be displeased at the implication that its goal of 4% unemployment is currently viewed as unsustainable.
The RBNZ went through a range of ways to measure where employment is relative to the sustainable maximum, but sounded most enthusiastic about the most obvious one - the unemployment rate. The RBNZ also placed a lot of weight on wage growth as an indicator of where the labour market is in the cycle. Wage growth has undershot forecasts for years, and if it continues to do so the RBNZ might conclude that employment has not reached its maximum sustainable level after all. Low wage growth would also portend low inflation, so the outlook for wage growth now has double significance for the RBNZ.
The other interesting feature of the MPS was the lack of discussion around the exchange rate and the housing market. We view that as an improvement, particularly with regards to the exchange rate. The RBNZ has a long history of obsessing over the exchange rate and engaging in fruitless attempts to jawbone it lower. At best this has diverted attention from issues monetary policy can actually influence, and at worst it has led to serious monetary policy errors.
The other key development over the past week has been a rash of weak household-related data for April. Electronic card transactions and car registrations fell very sharply, and housing market data was weak.
The New Zealand housing market cooled over the first half of 2017, but enjoyed something of a comeback from September last year. The latest data have confirmed that the brief resurgence is over, and the New Zealand housing market is cooling once more. Market turnover is down, house prices are now falling in Northern New Zealand, and the rate of house price inflation has slowed elsewhere, most notably in Wellington.
This is bang on what we were expecting. We have long been forecasting a modest decline in house prices due to a raft of expected law changes. The first of these was the extension of the Bright Line Test, introduced at the end of March. Property investors must now hold a property for five years before selling if they want to avoid being taxed on capital gains. Later this year we will see a foreign buyer ban come into force, and next year property investors' ability to claim tax deductions on rental property losses will be phased out. Finally, later this year the Tax Working Group will report back, and will probably recommend further taxes on property. We would be stunned if these changes failed to dent house prices.
If the housing market does weaken in the way we anticipate, there will be two main consequences. First, the Reserve Bank will become more willing to loosen its mortgage lending restrictions, which were already loosened slightly in January. We are looking for a second loosening in November this year, but an earlier move cannot be ruled out. We may get more guidance when the next Financial Stability Review is released on 31 May. And second, a weaker housing market will shift the balance of monetary policy in a dovish direction.
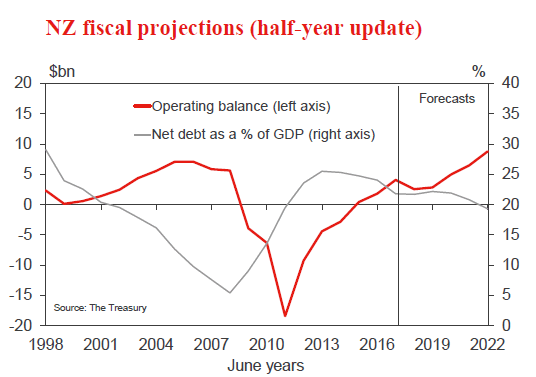
Next week, the new coalition Government will release its first Budget. The Budget will probably be fairly mundane in terms of new policy announcements, at least compared to the half-year update last December. We expect the Government will stick to its forecast for a gradual decline in the net debt to GDP ratio, and therefore the forecasts for the bond programme will also stay the same. We will provide a full preview of the Budget next week.
The Government may well forecast a reduction in debt relative to GDP below 20%, but there has been much discussion about whether this goal will actually be achieved in reality. This week we published a bulletin1 explaining why we think the answer is a resounding yes. First of all, with the tax take exceeding forecasts recently, 20% net debt to GDP is not going to be all that difficult to achieve. But more importantly, even if the Government overspends on operational spending, it is highly likely to underspend its capital budget. The Government is forecasting a near-doubling of capital spending within two years. We seriously doubt they will be able to get that much investment done, given how capacity constrained the construction sector is. Less investment would also mean less debt. We have concluded that the Government will easily meet its debt target, but it might be for the wrong reasons.
Data Previews
Aus May Westpac-MI Consumer Sentiment
- May 16, Last: 102.4
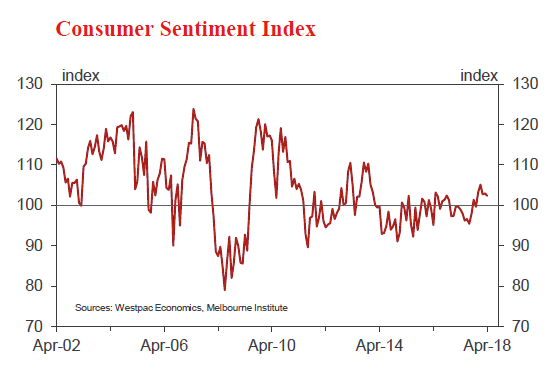
After a promising start to the year, sentiment has drifted lower over the last three months, the index slipping to 102.4 in April. While still over the 'gain line' - reads above 100 indicate optimists still outnumber pessimists - and more encouraging than through most of 2017, the index remains well below the 105-115 levels typically associated with a robust consumer.
The May survey is delayed a week in order to capture reactions to the Federal budget. Aside from this, sentiment may also be affected by financial market moves, the ASX200 rebounding strongly to be up 5.5% since the April survey but the AUD sliding nearly 2½¢ USD. Petrol prices have also shown a notable lift, average pump prices up over 7¢ a litre nationally since the last survey and over 13¢ since early March. Continued slippage in Sydney and Melbourne house prices is also likely to be weighing on sentiment.
Aus Q1 Wage Price Index
- May 16, Last 0.6%, WBC f/c: 0.6%
- Mkt f/c: 0.6%, Range: 0.5% to 0.7%
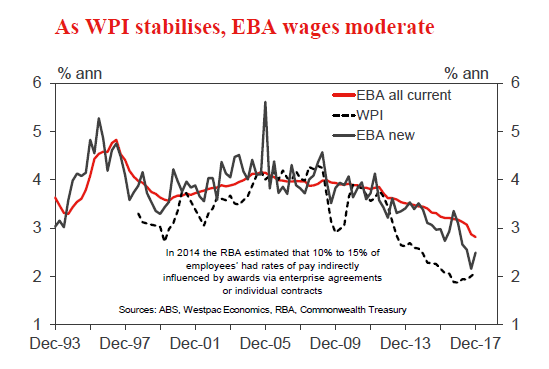
There has been some tightening in the Australian labour market, as measured by the broader measures of labour utilisation, but we still observe ongoing weakness in wage outcomes. Total hourly wages ex bonuses increased 0.6% in the December quarter, just slightly above market and Westpac expectations for 0.5% lifting the annual pace modestly from 2.0%yr to 2.1%yr.
Private sector wages grew 0.5% holding the annual rate at 1.9%yr. Public sector wages grew 0.6% with the boost coming from professional & technical (1.0%), education (0.8%) and health care (0.9%). Public sector wage inflation is holding an annual pace of 2.4%yr which is just up on the 2016 record low of 2.3%yr.
The December quarter reported a modest uptick in new Enterprise Bargaining Agreements wage outcomes, but they are still less than the average of existing agreements.
Aus April Labour Force - total employment '000
- May 17, Last 4.9k, WBC f/c: 17
- Mkt f/c: 20, Range: 10 to 30
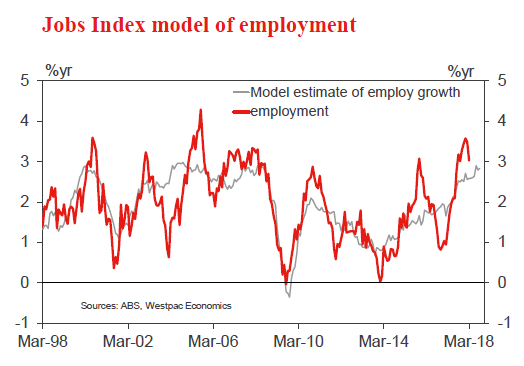
Australian employment grew just 4.9k in March but just as significant, the 17.5k gain in February was revised to -6.3k. The ABS now tells us that February was the first negative print in a record breaking run of 16 consecutive monthly gains. This was a bit of an anti-climax for what should have been a quite momentous occasion.
A run of weak numbers were to be expected. After all the upswing in employment through the second half of 2017 was well above what our broader leading indicators were suggesting. The three month average gain has fallen from 45.7k in January to 12.0k in March while the annual pace of growth has eased back to 3.0% from 3.6% in January.
Our analysis of the various business surveys suggests employment growth of something closer to 2¾%yr. Our 17k forecast for April will see the annual rate ease back to 2.8%.
Aus April Labour Force - unemployment rate %
- May 17, Last 5.5%, WBC f/c: 5.5%
- Mkt f/c: 5.5%, Range: 5.3% to 5.6%
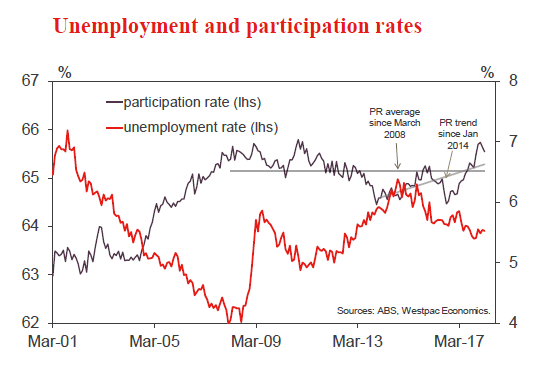
Despite weak employment the unemployment rate was flat at 5.5%, which had been revised down from 5.6%. The participation rate was 65.5% down from February's figure of 65.6%.
It appears that the unemployment rate has at least flattened so far in 2018, or can even be described as rising a little with a March quarter average of 5.52% vs. 5.45% in the December quarter. We also noted that the participation rate has drifted down a little but it is not far off the recent record high.
We estimate the participation rate will round up from 65.5% in March to 65.6% in April resulting in a 17k lift in the labour force. As this matches our 17k forecast gain in total employment, the unemployment rate holds flat at 5.5.
We should note given just how high the participation rate is, it is possible we will see a lower unemployment rate due to a further fall in participation.
NZ Budget 2018
- May 17
When the Government delivers its first Budget next week it will walk the tightrope between increased spending and keeping within its Budget Responsibility Rules. While operational spending is likely to increase, thanks to a higher than expected tax take in recent months, the Budget projections will be constrained by reducing net core crown debt below 20% of GDP by 2021, and continuing to project operating surpluses.
It will have been helped by a strong starting point, with the tax take currently running around $1.1 billion ahead of forecast.
The Government has signalled net capital spending plans over the next five years are broadly unchanged from those presented in December's Half Year Fiscal Update.
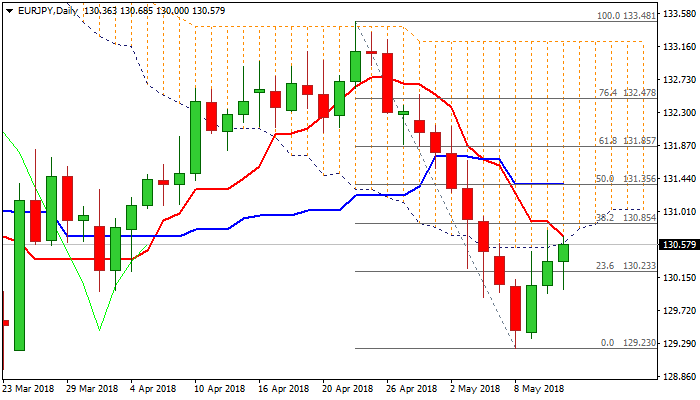
EURJPY – Recovery Faces Strong Barriers from Daily Cloud Base / 10SMA
The cross extends recovery leg from 129.23 (08 May low) into third consecutive day, but fresh bulls face strong headwinds from tough barriers at 130.68 (base of thick daily / 4-hr clouds, reinforced by falling 10SMA / daily Tenkan-sen).
Risk of recovery stall exists as thick daily cloud weighs heavily; MA’s remain in firm bearish configuration and momentum is weakening.
On the other side, penetration into daily cloud would generate initial bullish signal for extended recovery, which requires break and close above 130.85 (Fibo 38.2% of 133.48/129.23 bear-leg) for confirmation.
The pair may hold extended consolidation under daily cloud and keep bullish near-term bias while the downside stays protected by top of thick rising hourly cloud (spanned between 130.38 and 130.00).
Bearish scenario needs confirmation on break and close below psychological 130 support.
Res: 130.68; 130.85; 131.28; 131.64
Sup: 130.38; 130.00; 129.82; 129.60
Further Signs of Firming in Canadian Wage Growth in April
Highlights:
- April employment ticked slightly lower but the unemployment rate held at a very low 5.8% rate.
- Full-time jobs jumped 29k after a 68k March gain. Part-time jobs fell 30k in April.
- The unemployment rate was 5.8% in April for a third straight month. The 5.8% average in Q1 was the lowest since the mid-1970s.
- Wage growth accelerated to 3.6% year-over-year — 3.1% excluding Ontario where minimum wages
Our Take:
Canadian employment was little changed in April, slipping 1k lower after rising 32k in March. Details were generally solid. Full-time employment jumped another 29k higher after a 68k surge in March with offset from a second straight drop in part-time jobs. The unemployment rate held at 5.8% for a third straight month — and fourth of the last five. Prior to November, the unemployment rate had only been that low in one month in more than 4 decades. The participation rate ticked lower in April but seemingly largely due to the aging population. The participation rate for 25-54 year-olds rose to 86.9% in April.
Employment/unemployment data has been strong for a while. A missing ingredient to stronger labour markets last year — and arguably the last remaining argument that labour markets aren’t already operating close to long-run capacity limits — was stronger wage growth. On that front, the data has been notably better to-date in 2018 and showed further improvement in April. Year-over-year wage growth ticked up to 3.6% in April, its fastest pace since October 2012 and a sharp reversal from a year ago when wages were rising just 0.7%. Not all of that increase is tied to a big minimum wage hike in Ontario in January, either. By our calculation, wage growth ex-Ontario rose to 3.1% in April from an average 2.9% in Q1. Yes, economic growth has slowed, but that’s not such a bad thing with evidence mounting that the economy is already pretty close to long-run capacity limits. The data still argues that the Bank of Canada will ultimately need to hike rates further from what are still highly stimulative levels although competitive headwinds, trade uncertainty, and concerns about highly leveraged households also still argue that the pace is likely to be very gradual.
ECB Draghi suggested a new, common “fiscal instrument” for extra layer of stabilization
ECB President Mario Draghi delivered a speech titled "Risk-reducing and risk-sharing in our Monetary Union" at the European University Institute today.
He suggested that Eurozone needs a new, common "fiscal instrument" to ensure that member states wouldn't be pulled apart during economic shocks. He said "we need an additional fiscal instrument to maintain convergence during large shocks, without having to over-burden monetary policy." And, "its aim would be to provide an extra layer of stabilization, thereby reinforcing confidence in national policies."
St. Louis Fed Bullard: Interest rate may have reached neutral level already
St. Louis Fed President James Bullard said today that interest rates may have already reached the so called "neutral" level. Beyond this point, monetary policy will become restrictive. And Bullard said that there are "reasons for caution in raising the policy rate further given current macroeconomic conditions."
At the same time, Bullard pointed to market-based inflation expectations and said investors "believe there is currently little inflationary pressure in the U.S." Thus, leave interest rates unchanged would "re-center inflation expectations at the target."
USDCAD: Strong Bears Take a Breather Before Continuing
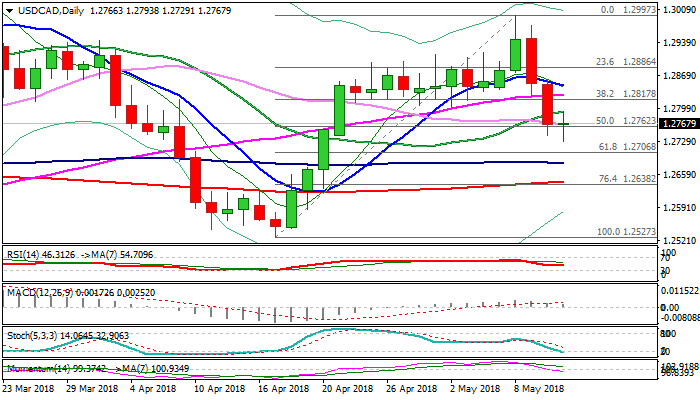
The Canadian dollar reversed from fresh three-week high at 1.2729 against the US dollar despite downbeat Canada's April labor data, as US import price index, released at the same time, fell below expectations. Canada's employment change fell by 1.1K in Apr, strongly undershooting forecast for 17.4K new jobs, while unemployment rate remained unchanged at 5.8% for the third straight month. On the other side, weaker than expected US Import prices which rose by 0.3% in Apr, missing forecast for 0.5% rise, balanced negative impact on loonie from weak jobs data. The pair fell sharply in past two days and retraced over 50% of 1.2527/1.2997 upleg, on strong bearish acceleration after bulls stalled on approach to psychological 1.30 barrier. Negative daily techs maintain downside risk as 20/30/55SMA's remain in bearish setup, while momentum is trending lower and broke into negative territory, suggesting limited recovery before bears resume. Post-data upticks were capped by broken 20SMA (1.2794), which should ideally keep the upside protected and guard key barriers at 1.2820 zone (former higher base/broken Fibo 38.2% of 1.2527/1.2997 upleg). Bears eye next pivot at 1.2706 (Fibo 61.8% of 1.2527/1.2997 upleg), close below which would generate bearish signal for extension towards daily cloud base (1.2686) and 200SMA (1.2643).
Res: 1.2794; 1.2817; 1.2848; 1.2913
Sup: 1.2762; 1.2729; 1.2706; 1.2686