

Sample Category Title
Canada: Decent Details Beneath a Soft April Jobs Headline
Employment in Canada was effectively unchanged in April, dropping 1.1k net positions. With only a modest climb in the number of people looking for work, the unemployment rate remained unchanged at 5.8%.
Beneath the soft headline numbers was a more encouraging split. Full-time employment gained 28.8k net positions as part-time employment dropped 30k.
In terms of broad types, it was private sector employment that led the way. Private employment was up 28.0k net positions, while the public sector shed 13.6k net positions. With a 14.5k net gain in employees, it was self-employment that brought the overall number into negative territory, down 15.6k in April.
Examining the industry split, it was trade (-22.1k) and construction (-18.9k) that led the way lower, while professional services (+21.3k) and accommodation and food services (+16.9k) eked out gains on the month. The remaining categories were generally close to, but below zero net change on the month.
Among the Provinces, it was Quebec that took the lead again in April, but this time in reverse (-13.8k; March: +16k). Modest gains in Ontario (+9.3k) were not enough to offset the decline as the other provinces turned in mixed performances.
Despite the shifting towards full-time employment, aggregate hours worked were little changed again in April, leaving the year-on-year pace at 1.9%, well below Q1's 2.7% average pace. It was a more positive story on wages, as the hourly rate for permanent employees rose 3.3% in its best performance since 2012.
Key Implications
Don't let the headline number fool you, this really wasn't that bad of a report. Full-time employment rose again, and the employee vs self-employment mix was encouraging. Wage growth was solid. The fly in the ointment was again hours worked, although this is less of a surprise this month given the soft headline jobs number.
With volatility the name of the game for this report, the trend is your friend. On a six month moving average basis, jobs growth stands at 17.4k. This is basically 'about right' – with the unemployment rate hanging near a 40 year low and little in the way of labour market slack a more modest trend pace is to be expected. We expect employment gains to continue trending around the 15k to 25k pace as the year progresses.
Tightness may be slowing the net job gains, but it is also keeping wage growth up. Not only was April the fourth month of above 3% wage gains, the breadth seen is encouraging, as 11 of 16 major industries reported wage gains above the 3% mark, rising to 13 of 16 in the weekly wage data.
The wage data will likely be closely scrutinized by the Bank of Canada, which has identified 3% growth in its 'Wage-common' measure as a signal that labour market slack has been absorbed. Today's data may only carry a small weight in that measure, but its timeliness gives us a first glimpse at the potential evolution of the Bank's thinking. A modest acceleration in wages and the improved breadth should translate to less slack by their measure. On this basis, today's data could probably be put in the 'hawkish' column, but with many internal and external uncertainties unlikely to be resolved before their next rate decision, the balance remains tilted in favour of a July rate hike.
USD/JPY Mid-Day Outlook
Daily Pivots: (S1) 108.85; (P) 109.10; (R1) 109.38; More...
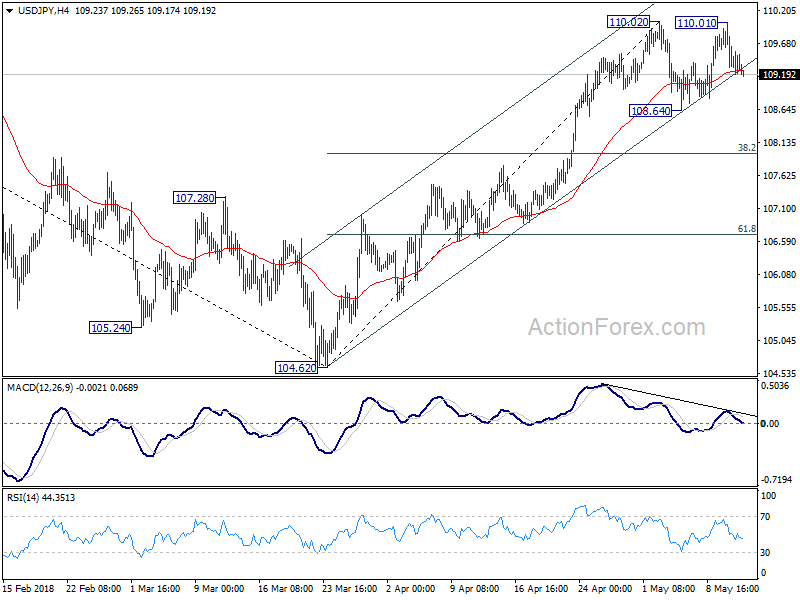
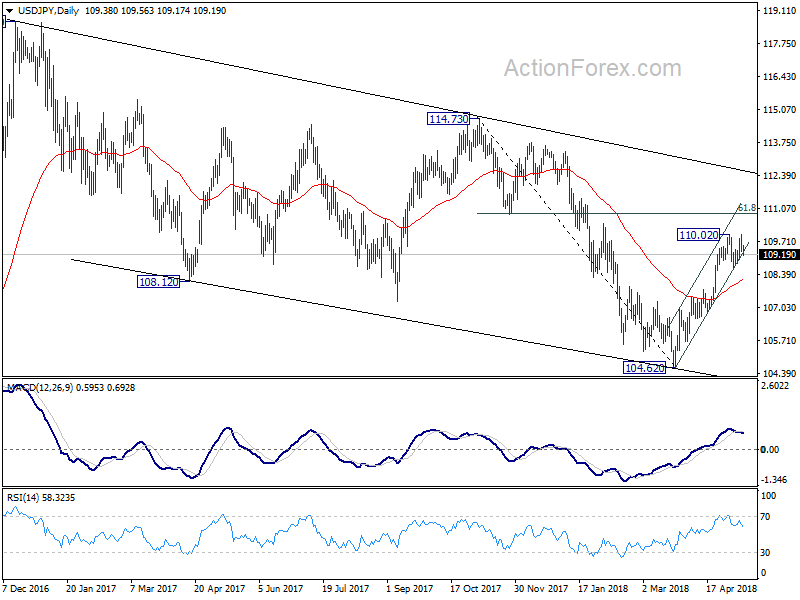
Intraday bias in USD/JPY remains neutral and outlook is unchanged. Consolidation from 110.02 is extending and deeper fall could be seen through 108.64. But downside should be contained by 38.2% retracement of 104.62 to 110.02 at 107.95 to bring rally resumption. On the upside, break of 110.02 will resume the rise from 104.62 to 61.8% retracement of 114.73 to 104.62 at 110.86 next.
In the bigger picture, corrective decline from 118.65 (2016 high) has completed with three waves down to 104.62. Rise from 104.62 is possibly resuming the up trend from 98.97 (2016 low). This will be the preferred case as long as 55 day EMA (now at 107.95) holds. Decisive break of 114.73 resistance will confirm our view and target 118.65 and above. However, sustained break of 55 day EMA will dampen this bullish view and turn focus back to 104.62 low instead.
USD/CHF Mid-Day Outlook
Daily Pivots: (S1) 0.9996; (P) 1.0026; (R1) 1.0058; More...
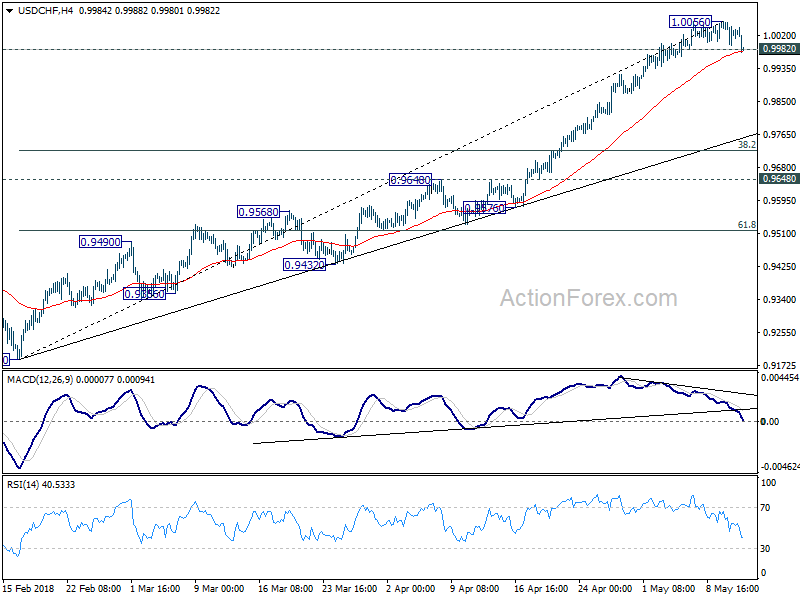
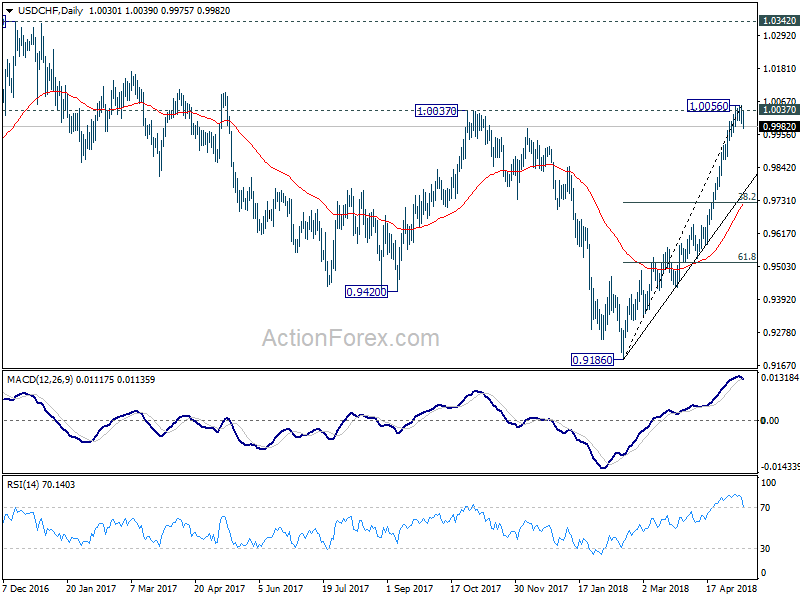
Breach of 0.9982 minor support suggests that USD/CHF has finally formed a short term top. It's at 1.0056 after failing to sustain above 1.0037 key resistance. Intraday bias is turned to the downside for pull back to trend line support (now at 0.9761). At this point, we'd expect strong support from there to bring rally resumption. On the upside, sustained break of 1.0037 will resume recent rise for 1.0342 key resistance next.
In the bigger picture, medium term decline from 1.0342 has completed with three waves down to 0.9186. Rise from there is currently viewed as a leg inside the long term range pattern. Hence, while further rally would be seen, we'd be cautious on strong resistance from 1.0342 to limit upside. For now, further rise is expected as long as 0.9648 resistance turned support holds, even in case of pull back.
GBP/USD Mid-Day Outlook
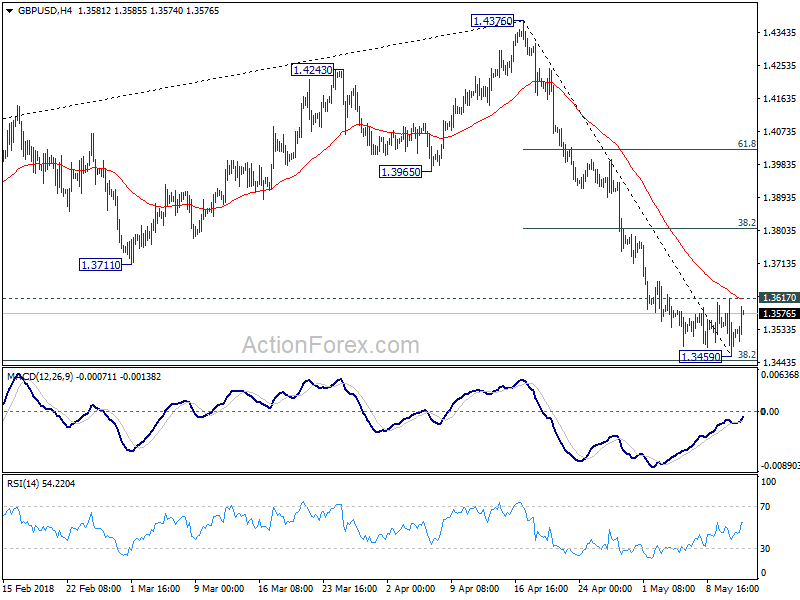
Daily Pivots: (S1) 1.3444; (P) 1.3530; (R1) 1.3602; More...
Intraday bias in GBP/USD is turned neutral with today's recovery. On the upside, break of 1.3617 minor resistance will indicate short term bottoming at 1.3459, just ahead of 1.3448 fibonacci level. In that case, stronger rebound would be seen back to 38.2% retracement of 1.4376 to 1.3459 at 1.3809. We'd expect strong resistance from there to limit upside. On the downside, sustained break of 1.3448 fibonacci level will confirm resumption of whole fall from 1.4376 and target next fibonacci level at 1.2874.
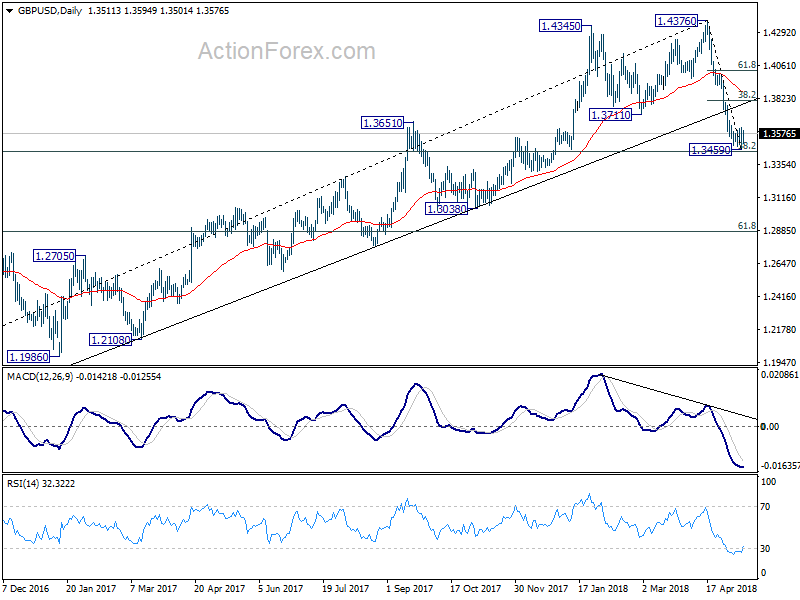
In the bigger picture, current development suggests that whole medium term rebound from 1.1936 (2016 low) has completed at 1.4376 already, with trend line broken, on bearish divergence condition in daily MACD, after rejection from 55 month EMA (now at 1.4223). Deeper decline should be seen to 38.2% retracement of 1.1936 (2016 low) to 1.4376 at 1.3448 first. Break will target 61.8% retracement at 1.2874 and below. Outlook will stay bearish as long as 55 day EMA (now at 1.3925) holds, even in case of strong rebound.
EURUSD: Remains On The Offensive On Correction
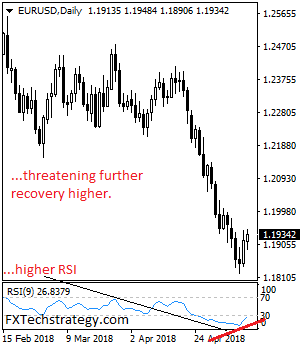
EURUSD: The pair backed off lower prices to close higher on Thursday and followed through higher on Friday. On the upside, resistance comes in at 1.1950 level with a cut through here opening the door for more upside towards the 1.2000 level. Further up, resistance lies at the 1.2050 level where a break will expose the 1.2100 level. Conversely, support lies at the 1.1900 level where a violation will aim at the 1.1850 level. A break of here will aim at the 1.1800 level. Below here will open the door for more weakness towards the 1.1750. All in all, EURUSD faces further upside threats on recovery.
EU 50 Index Touches 14-Week High but Returns Some Gains
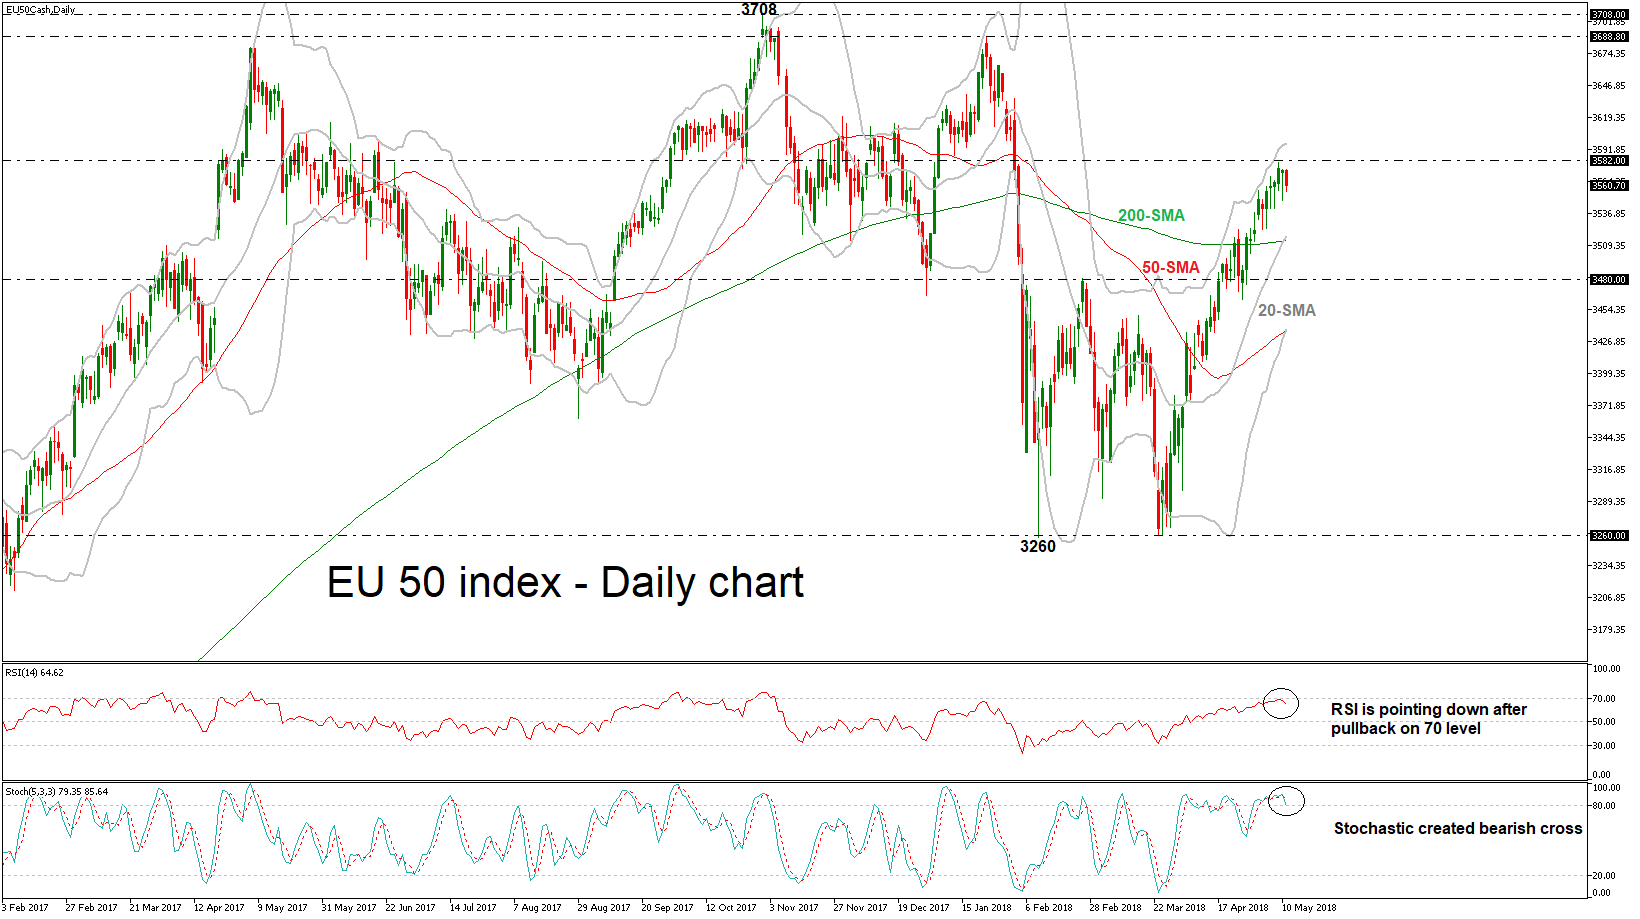
The EU 50 index has completed the seventh bullish week in a row following the bounce off the 3260 support barrier. However, in the short-term, the index has erased some of its gains over the last hours during Friday’s session after it reached a new 14-week high of 3580.70.
Looking at momentum oscillators on the daily chart, they suggest further declines may be on the cards in the short-term. The RSI is below its 70 line, with negative momentum and is pointing downwards. The stochastic oscillator posted a bearish cross within the %K and D lines, suggesting further losses.
In case of further declines, immediate support may be found near the 200-day simple moving average and the mid-level of the Bollinger Band around 3515. A downside break of that zone would open the way for the 3480 support level, taken from the peak on February 26. If sellers manage to push below that hurdle too, that would mark a lower low on the daily chart and challenge the 50-day SMA, which coincides with the lower Bollinger band of 3435.
On the flip side, if the bulls retake control, the price advance may stop near the 3688.80 resistance level, taken from the high of January 23. A potential upside violation of this level would take the index higher until the 3708 barrier.
Overall, the index is expected to create a bearish correction of the big upward movement, before it continues the bullish tendency.
EUR/USD Mid-Day Outlook
Daily Pivots: (S1) 1.1856; (P) 1.1901 (R1) 1.1960; More....
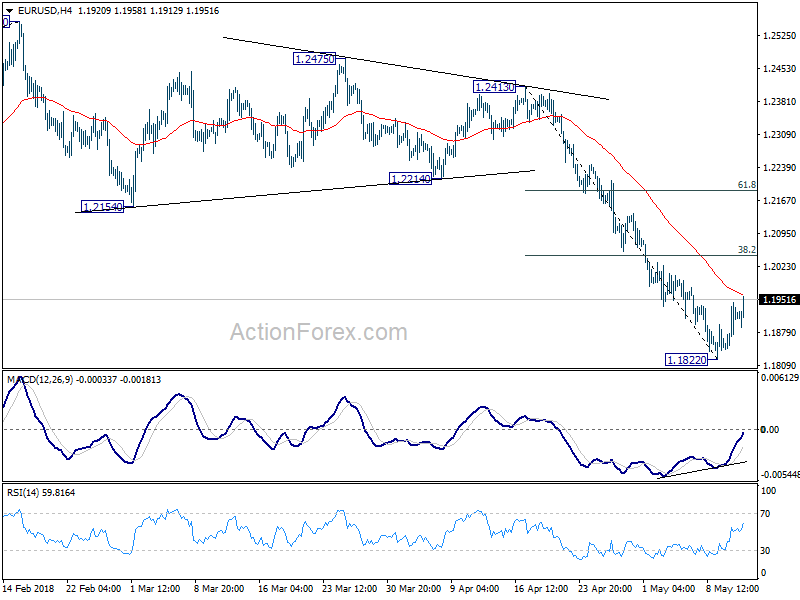
EUR/USD's rebound from 1.1822 extends to as high as 1.1958 so far. Intraday bias stays on the upside for 4 hour 55 EMA (now at 1.1963) and above. Nonetheless, such rebound is viewed as a corrective recovery. Therefore, upside should be limited by 38.2% retracement of 1.2413 to 1.1822 at 1.2048 to bring fall resumption. On the downside, below 1.1822 will resume the whole decline from 1.2555 and target 1.1708 medium term fibonacci level next.
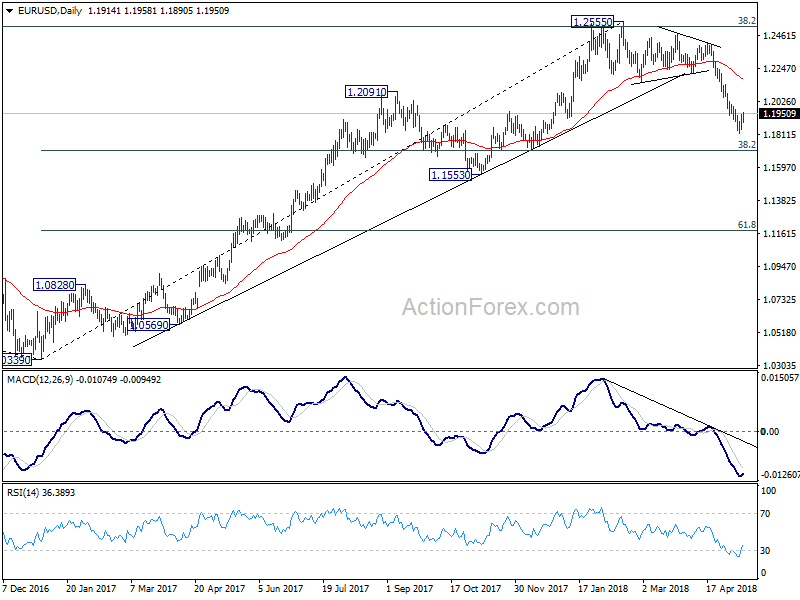
In the bigger picture, current decline and firm break of 1.2154 support confirms rejection by 38.2% retracement of 1.6039 (2008 high) to 1.0339 (2017 low) at 1.2516. A medium term top should be in place at 1.2555 and deeper decline would be seen back to 38.2% retracement of 1.0339 to 1.2555 at 1.1708 first. With current downside acceleration, there is prospect of hitting 61.8% retracement at 1.1186 before completing the decline. But still, we'll need to look at the structure before deciding if it's a corrective or impulsive move.
Canadian Dollar Lower after Employment Miss, But US Dollar Even Worse
Canadian dollar drops broadly as employment data missed market section. While it's trading as the weakest one for today, the movement in USD/CAD is rather muted. That's because focus is turning to the greenback again as selling gathers momentum. Weakening treasury yield could be a factor driving the greenback down. But it's also due to profit taking after long stretched bull run. Elsewhere in the markets, Sterling recovers against all other major currencies as markets realized BoE was not that dovish in yesterday's announcement at all. For the week, Canadian Dollar is still the strongest one for the time being, followed by the Pound. New Zealand dollar is the weakest for the week, followed by Yen.
Canadian employment market contracted -1.1k in April, much worse than expectation of 20.5k. Unemployment rate was unchanged at 5.8%, in line with consensus. From US, import price index rose 0.3% mom in April, below expectation of 0.50%.
Australian Dollar boosted by surge in Iron Ore futures in China's DCE
Australian Dollar surged in European session today. Strength in Iron ore price was likely a key factor. Iron Ore futures in China's Dalian Commodity Exchange soared after lunch and gain 2.76% for the day. In the background, there is some optimism on iron ore and steel price as inventory falls. ANZ noted in a research note that Chinese steel demand continued to beat expectations as "real estate investment and housing starts are picking up, while infrastructure spending remains elevated." Also, "after some restocking in late March ahead of a key maintenance period, the scene is set for steel mills to re-enter the market."
BoJ Kuroda: Some steps remaining for government on fiscal reforms
BoJ Governor Haruhiko Kuroda spoke to the parliament today and hailed that the government has made significant progress on fiscal reforms. And, there is "some lag before the steps already taken begin to affect the economy". But he also emphasized that there are "still some steps remaining that the government needs to take on structural reform and growth strategy."
New Zealand BusinessNZ PMI rose to 58.9, highest since Jan 2016
New Zealand BusinessNZ Performance of Manufacturing Index rose to 58.9 in April, up from 53.1. That's also the highest level since January 2016. BusinessNZ's executive director for manufacturing Catherine Beard noted that "although April represents a good result for the sector, the key will be to continue the expansion momentum over the coming months."
Also release in Asian session, Australia home loans dropped -2.2% mom in March, Japan M2 rose 3.3% yoy in April.
Looking ahead
Canadian job data will be the main focus for today. US will release import price index and U of Michigan consumer sentiment.
EUR/USD Mid-Day Outlook
Daily Pivots: (S1) 1.1856; (P) 1.1901 (R1) 1.1960; More....
EUR/USD's rebound from 1.1822 extends to as high as 1.1958 so far. Intraday bias stays on the upside for 4 hour 55 EMA (now at 1.1963) and above. Nonetheless, such rebound is viewed as a corrective recovery. Therefore, upside should be limited by 38.2% retracement of 1.2413 to 1.1822 at 1.2048 to bring fall resumption. On the downside, below 1.1822 will resume the whole decline from 1.2555 and target 1.1708 medium term fibonacci level next.
In the bigger picture, current decline and firm break of 1.2154 support confirms rejection by 38.2% retracement of 1.6039 (2008 high) to 1.0339 (2017 low) at 1.2516. A medium term top should be in place at 1.2555 and deeper decline would be seen back to 38.2% retracement of 1.0339 to 1.2555 at 1.1708 first. With current downside acceleration, there is prospect of hitting 61.8% retracement at 1.1186 before completing the decline. But still, we'll need to look at the structure before deciding if it's a corrective or impulsive move.
Economic Indicators Update
| GMT | Ccy | Events | Actual | Forecast | Previous | Revised |
|---|---|---|---|---|---|---|
| 22:30 | NZD | BusinessNZ Manufacturing PMI Apr | 58.9 | 52.2 | 53.1 | |
| 23:50 | JPY | Japan Money Stock M2+CD Y/Y Apr | 3.30% | 3.20% | 3.20% | 3.10% |
| 01:30 | AUD | Home Loans M/M Mar | -2.20% | -2.00% | -0.20% | |
| 12:30 | CAD | Net Change in Employment Apr | -1.1K | 20.5k | 32.3k | |
| 12:30 | CAD | Unemployment Rate Apr | 5.80% | 5.80% | 5.80% | |
| 12:30 | USD | Import Price Index M/M Apr | 0.30% | 0.50% | 0.00% | -0.20% |
| 14:00 | USD | U. of Mich. Sentiment May P | 98.4 | 98.8 |
Canada employment dropped -1.1k, missed expectation, USD/CAD slightly higher
Canadian employment market contracted -1.1k in April, much worse than expectation of 20.5k. Unemployment rate was unchanged at 5.8%, in line with consensus.
From US, import price index rose 0.3% mom in April, below expectation of 0.50%.
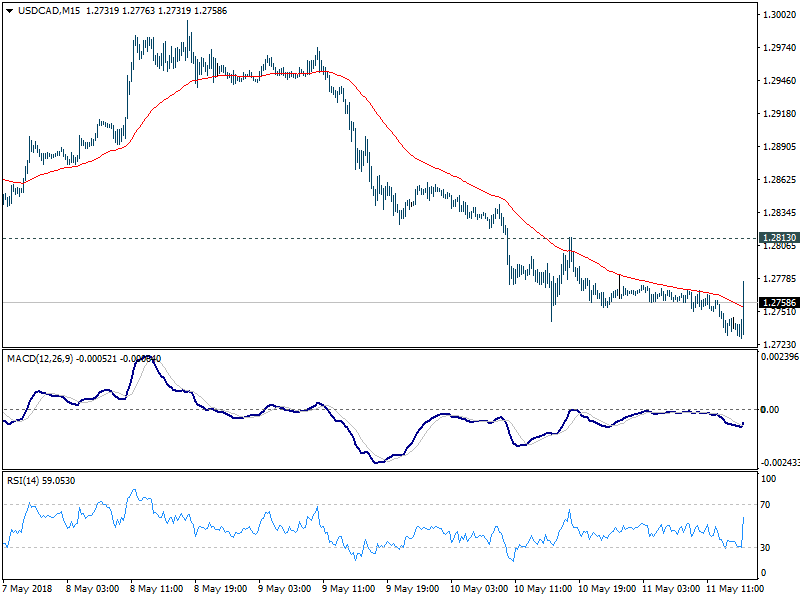
USD/CAD recovers in reaction to the release, but there is no follow through buying yet. It has to overcome a minor support at 1.2813 before forming a temporary bottom. For now, further decline is still expected in the pair before the weekly close.
Stock Markets Green, Dollar Slips While Gold Shines
Global equity markets have attempted to trade cautiously higher at the end of the week, as a combination of soft US inflation figures, stronger commodity prices and slightly easing geopolitical tensions seems to have had a small impact on risk sentiment.
Asian shares closed mostly higher as markets cheered at the news of Donald Trump’s meeting with North Korean leader, Kim Jong-Un, on 12 June in Singapore. In Europe, stocks have shown some signs of buying momentum, and this could benefit Wall Street later on Friday.
It is worth noting that global equity markets remain highly sensitive to geopolitics and speculation of higher interest rates. Risks in the form of escalating geopolitical tensions in the Middle East and other forms of uncertainties could still create headwinds for the markets at any time.
Dollar softens, but remains King
The Greenback extended losses on Friday, after weaker than expected US inflation figures for April prompted market players to scale back bets of faster rate hikes.
US Consumer prices printed below forecasts, rising by 0.2% last month while core inflation remained unchanged at 0.1%. The tame CPI figures are unlikely to materially impact expectations of a rate hike in June. However, the numbers could reduce speculation over the Federal Reserve adopting a more aggressive approach on rate hikes this year. With the widening interest rate differential still supporting the Dollar, losses are likely to be limited.
Taking a look at the technical picture, the Dollar Index has retreated from 2018 highs this week, with prices trading marginally below 92.60 as of writing. The Index continues to fulfil the prerequisites of a bullish trend as there have been higher highs and higher lows. Bulls remain in firm control above the 92.22 higher low. A failure for prices to keep above this level could encourage a decline towards 91.80.
Gold shines on Dollar weakness
It is shaping up to be a positive trading week for Gold thanks to a weakening US Dollar.
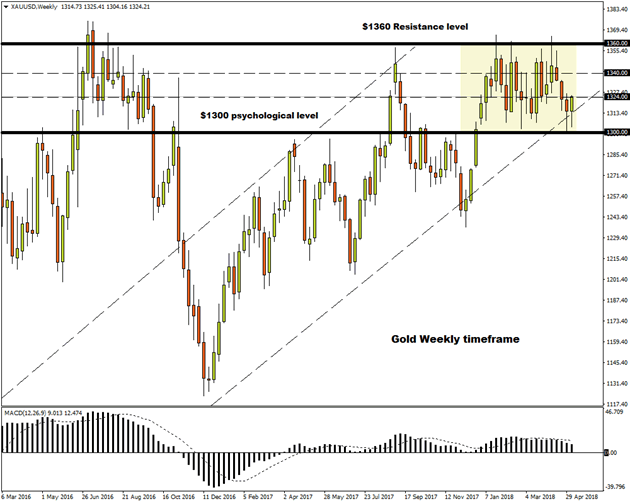
Appetite for the precious metal has received encouragement after the Dollar suffered heavy losses following the release of disappointing US inflation figures. The upside was complemented by geopolitical tensions in the Middle East stimulating some appetite for safe-haven assets. With a softening Dollar empowering Gold bulls, further upside could be on the cards if prices are able to conquer the $1324 level.
Taking a look at the technical picture, Gold remains in a wide range on the daily charts with major support at $1300 and a major resistance at $1360. A breakout above the minor $1324 resistance level could encourage an incline higher towards $1340.
Commodity spotlight – WTI Oil
Global crude oil prices have been firmly bullish this week after US President Donald Trump’s decision to withdraw from the nuclear deal with Iran.
WTI Crude Oil rallied to a fresh three and a half year high yesterday, with prices punching above $71.70 on prospects of tighter global supply after the US re-imposed sanctions on Iran. The upside was boosted by heightened geopolitical tensions in the Middle East, which fanned concerns of potential supply disruptions. While oil prices have scope to venture higher as bulls exploit geopolitics to power the rally, the question is – for how long?
Taking a look at the technical picture, WTI Crude is bullish on the daily charts. The upside momentum could inspire oil bulls with enough inspiration to challenge $72.00 in the near term.