Sample Category Title
Euro Steady On Lack Of Eurozone Data
EUR/USD is unchanged in the Friday session. Currently, the pair is trading at 1.1933, up 0.15% on the day. In economic news, it’s a quiet end to the week, with no German or eurozone events. ECB President Mario Draghi will speak at an event in Florence and the US releases UoM Consumer Sentiment, which is expected to improve to 98.4 points.
The ECB continues to send a message of cautious optimism to the markets, and this was underscored by the release of the ECB Economic Bulletin on Thursday. The report stated that the eurozone economy continues to show “solid and broad-based expansion” but did acknowledge that growth in the first quarter slowed. As for inflation, policymakers remain confident that inflation will continue to move towards the inflation target of 2 percent. However, inflation remains subdued and has not shown signs of an upward trend. The report reaffirmed that the ECB plans to maintain interest rates at current levels for an “extended period of time, and well past the horizon of the net asset purchases.”
In the US, Thursday indicators were a mixed bag. Unemployment claims impressed, remaining unchanged at 211 thousand. This easily beat the estimate of 219 thousand. The US labor market is at near or full employment, which has resulted in a slowdown in job growth due to a shortage of skilled labors. Earlier in the week, JOLTS Job Openings climbed to a record 6.6 million. At the same time, inflation levels remain low, as the Federal Reserve target of 2 percent remains elusive. CPI rebounded with a gain of 0.2%, but this fell short of the estimate of 0.3%. Core CPI edged lower to 0.1%, shy of the forecast of 0.2%. Inflation levels will be an important factor for the Fed in its monetary policy projection, which remains at two more hikes in 2018. According to the CME Group, the odds that the Fed will press the rate trigger at the June meeting stand at 100%.
SPOT GOLD Extends Recovery Above Key Fibo Barrier
Gold price regained traction and bounced from session low at $1318 hit in late Asian trading, as dollar remains at the back foot after weak US CPI data.
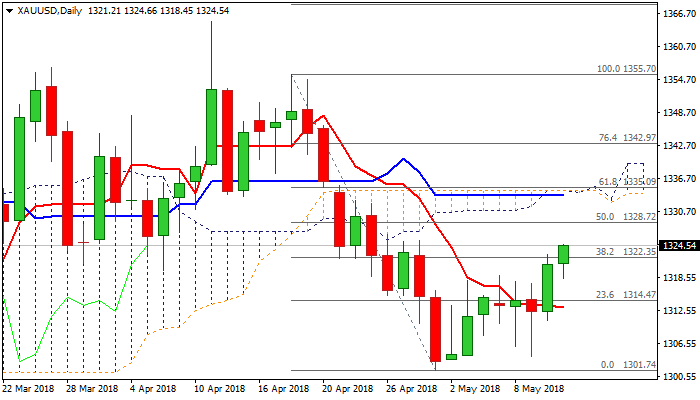
Fresh extension of Thursday’s strong rally when the yellow metal was up nearly 1%, probes again above pivotal barrier at $1322 (Fibo 38.2% of $1355/$1301 fall) close above which is needed to generate further bullish signal.
Strong bullish momentum is building and could help to extend rally further, as bulls are also attracted by twist of daily cloud ($1334).
Session low at $1318 marks initial support, while broken 10SMA ($1313) is expected to keep the downside protected.
Res: 1325, 1328, 1333, 1335
Sup: 1322, 1318, 1313, 1310
GBPJPY Finds Strong Resistance At 20- And 40-SMAs In Near Term
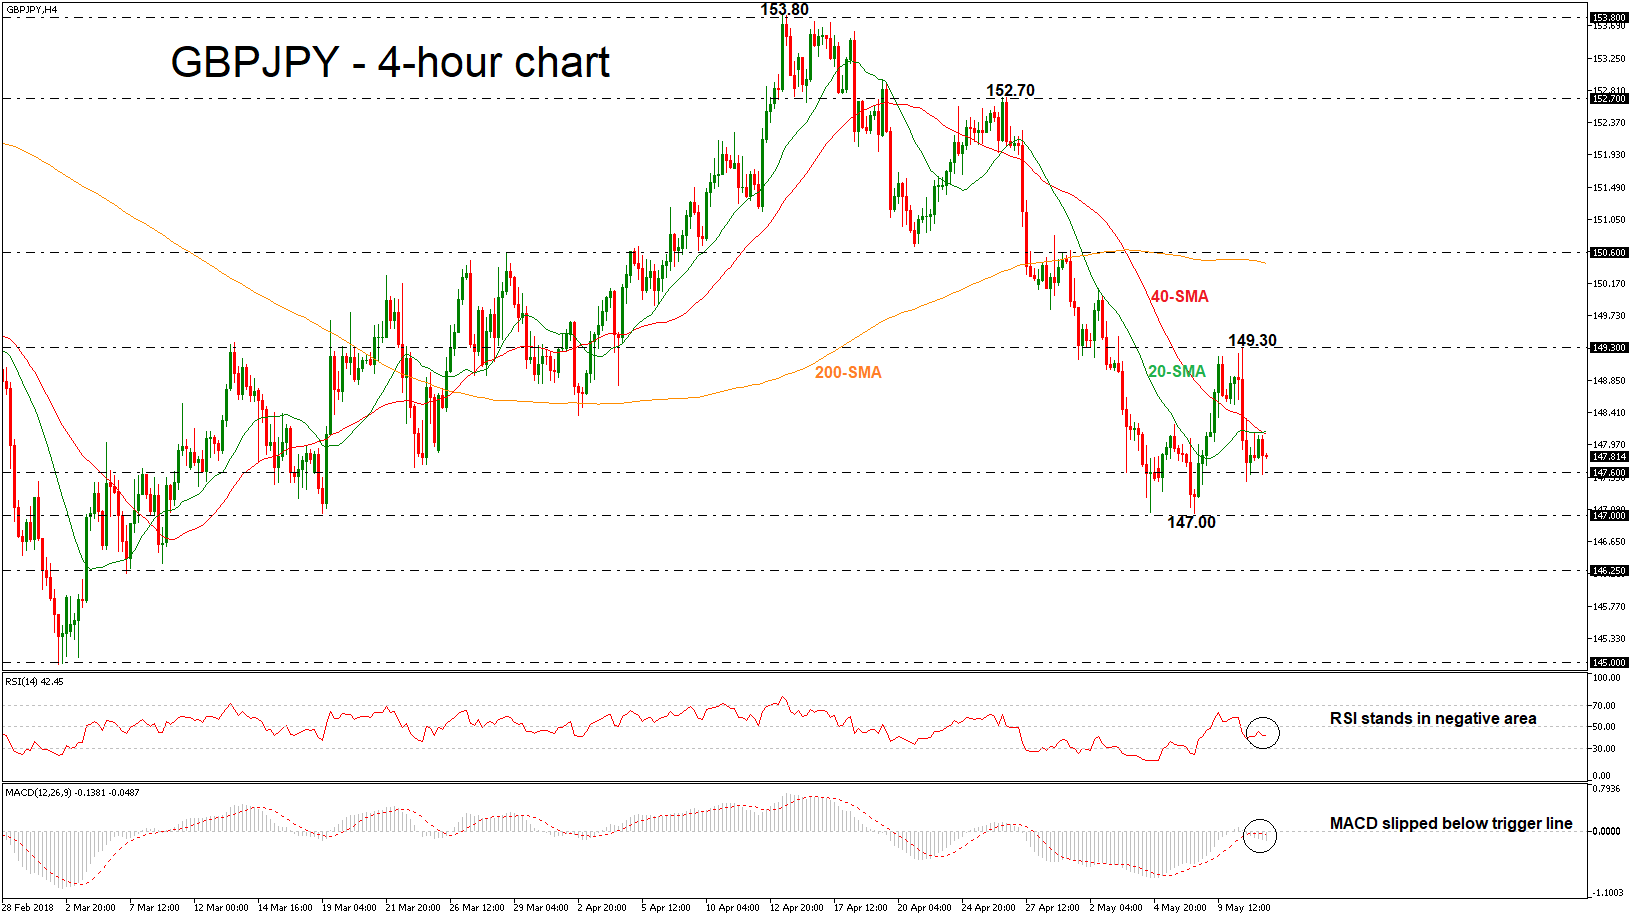
GBPJPY has reversed back down again after finding resistance on the bullish cross within the 20- and 40-simple moving averages (SMAs) in the 4-hour chart. This top is just above the last day’s high near 148.10, while the price started a sharp bearish bias after the pullback on 149.30 on in Thursday’s trading session.
In the 4-hour chart, the technical indicators dropped to their negative levels, confirming the bearish attitude on price. The RSI indicator slipped below the 50 level and is still sloping down, while the MACD oscillator declined below its trigger line.
In case of further losses, the price could challenge the immediate support of 147.60. A drop below this region should see the March 19 trough of 147.00 acting as a major support barrier. Further downside pressures would reinforce bearish structure in the medium-term and open the way towards the next key support level of 146.25, taken from the low on March 7.
In the event of an upside reversal, a successful surpass above the moving average could drive the pair until the 149.30 resistance barrier. Also, above this critical level, the 150.60 hurdle, which holds near the 200-SMA could add some gains to the pair if broken.
Overall, GBPJPY continues the negative movements and more declines are expected in the near future.
Forex Analysis: USDCAD And EURCAD
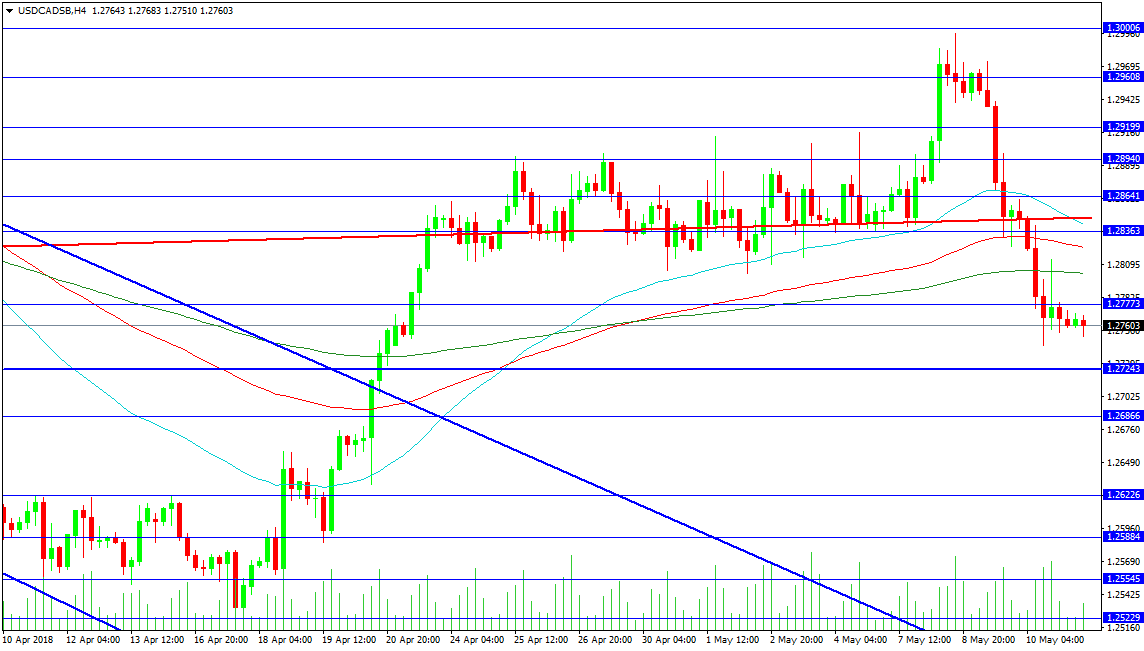
The USDCAD pair is currently trading around the 1.27600 level, just off the lows of the week and above the 1.27243 support zone. Price initially broke higher after consolidating around 1.28500 but the resistance at 1.30000 was too strong and sellers pushed price under 1.28000 and the moving averages. Resistance has accumulated at the low of the recent range, at the 1.28130 area, and this is one of the first hurdles to overcome on any move higher. A rally that takes price back to 1.29000 would give buyers hope of reaching for 1.30000 again.
As resistance firms up, the creation of a consolidation pattern at the current level potentially opens the way for a test lower to 1.27000. A loss of that area would bring the prospect of a revisit to the 1.26225 area of former resistance. Below this level lies another zone of consolidation, as far as the 1.25230 level with trend line support at 1.24500. This level should support buyers on a longer-term basis.
EURCAD
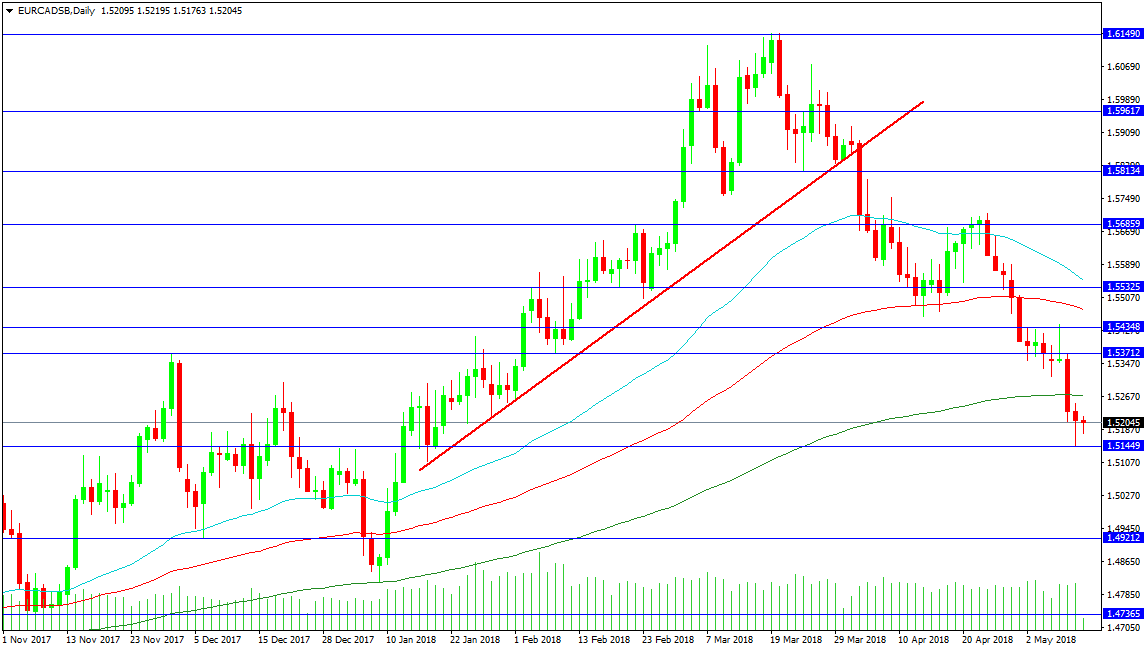
This pair has found support at the 1.51450 level, after falling hard on Wednesday through the 200 DMA at 1.52710. This area gives the best chance of a pause in selling and for a period of consolidation to take hold. The rally during January through May broke out from the current levels, around 1.52000, to ultimately reach a high at 1.61490. The sell-off has been fast, with a loss of 1.58500 accelerating momentum to the downside. The market can turn back higher from here to test resistance at the 1.54000 area and potentially set up a trading range.
At present, support has been found at yesterday’s low but a loss of this area could see price test the 1.49212 level or the January low of 1.48168 at the 200 DMA. For now, the price is under the 200 DMA at 1.52698 and a confirmed retest on that MA could result in lower price levels. Further support is located at 1.47365 and the 1.44413 low of H2 2017.
Forex Technical Analysis: EUR/USD, USD/JPY, GBP/USD
EUR/USD
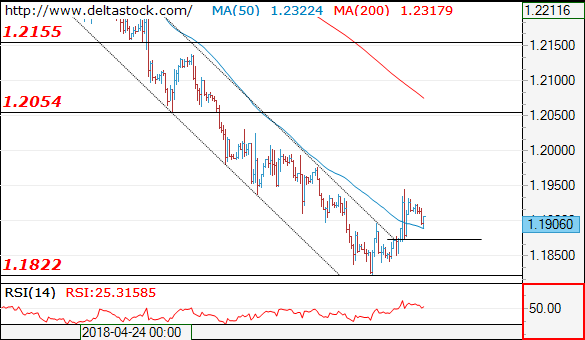
Current level - 1.1906
Yesterday's break through 1.1900 has violated the dynamic resistance of the whole slide since 1.2414 and the intraday bias is positive above 1.1870, for a rise towards 1.2000, en route to 1.2060 major hurdle.
| Resistance | Support | ||
| intraday | intraweek | intraday | intraweek |
| 1.1900 | 1.2060 | 1.1840 | 1.1840 |
| 1.2060 | 1.2160 | 1.1720 | 1.1720 |
 USD/JPY
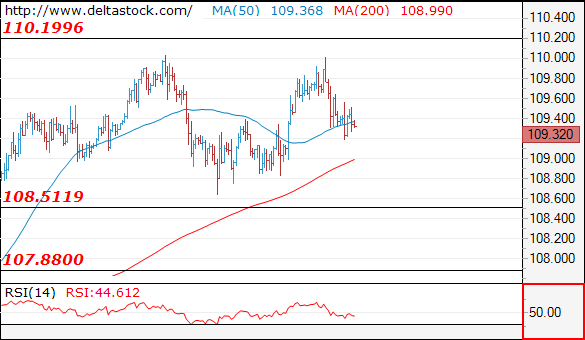
Current level - 109.32
The test at 110.00 failed and the bias is bearish, for a slide towards 108.50. Minor resistance lies at 109.60.
| Resistance | Support | ||
| intraday | intraweek | intraday | intraweek |
| 109.60 | 110.20 | 108.50 | 107.90 |
| 110.20 | 111.90 | 108.50 | 104.60 |
GBP/USD
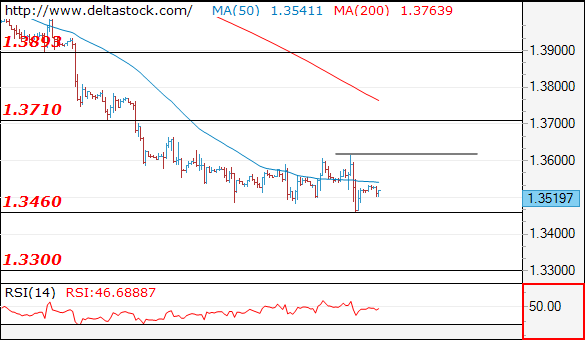
Current level - 1.3519
Yesterday's peak at 1.3620 is already crucial high for the whole slide since 1.4380, but the downtrend is still intact and a break through 1.3460 will target 1.3300 area.
| Resistance | Support | ||
| intraday | intraweek | intraday | intraweek |
| 1.3620 | 1.3990 | 1.3460 | 1.3460 |
| 1.3710 | 1.4100 | 1.3310 | 1.3310 |
AUD boosted by surge in Iron Ore futures in China’s DCE
AUD surges broadly and the rally started as markets entered into European session.
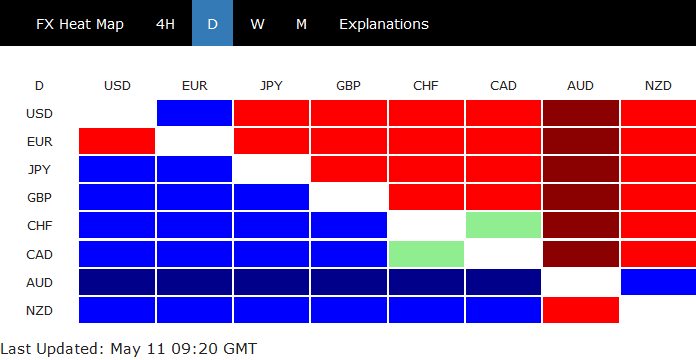
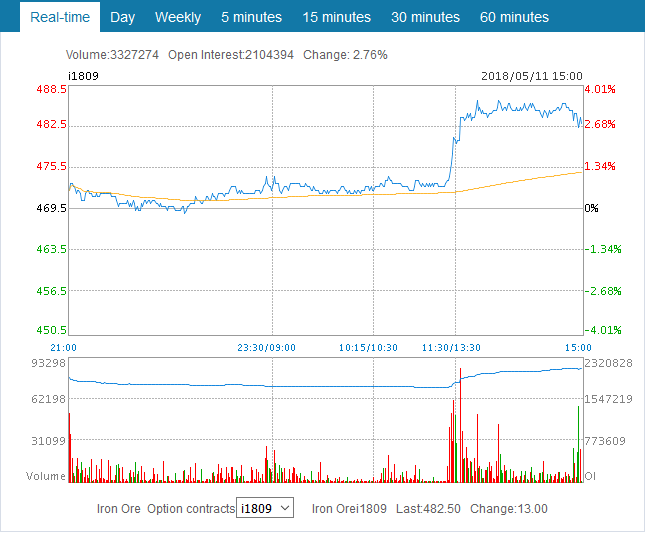
Strength in Iron ore price is likely a key factor. Iron Ore futures in China's Dalian Commodity Exchange soared after lunch and gain 2.76% for the day.
In the background, there is some optimism on iron ore and steel price as inventory falls. Reuters reported ANZ research note saying that "Chinese steel demand continues to beat expectations. Real estate investment and housing starts are picking up, while infrastructure spending remains elevated." And, "after some restocking in late March ahead of a key maintenance period, the scene is set for steel mills to re-enter the market."
ANZ also noted that the outlook for iron ore also picked up in recent weeks, as seen from recent Chinese data. In addition, prolonged mine outage in Brazil and falling exports from India and Sierra Leone will support prices.
WTI OIL – Corrective Dips Seen As Positioning For Fresh Rally
WTI oil is holding within tight consolidation range under new 3 ½ year high at $71.86 on Friday, taking a breather after strong rally during the week.
Oil price was boosted by US decision to pull out of nuclear deal with Iran which caused strong uncertainty about global oil supply and strong fall in US crude stocks.
Strong bullish sentiment could drive oil price higher for test of targets at $74.94 (Oct 2011 low) and $76.35 (Fibo 61.8% of 107.45/$26.04 fall).
Meanwhile, corrective actions on profit-taking after strong rally in past two weeks and overbought daily studies could be anticipated.
Dips are expected to provide better buying opportunities and should be contained by rising 10SMA ($69.60).
Res: 71.61, 71.86, 72.24, 73.00
Sup: 71.12, 70.55, 70.00, 69.60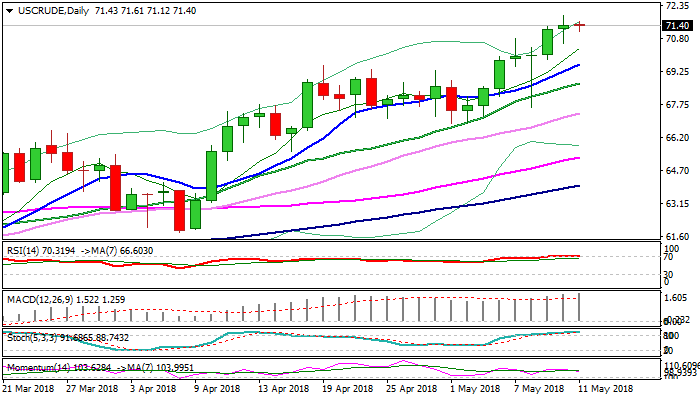
AUDUSD – Bullish Signal On Close Above 10SMA For Extension Towards 0.7565/84 Pivots
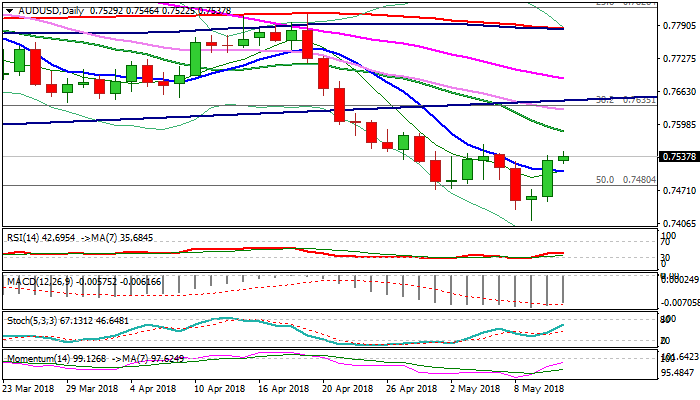
The Aussie dollar holds firm tone in early Friday's trading and looking for further upside after strong rally on Thursday completed Doji reversal pattern and generated bullish signal on close above 10SMA. North-heading momentum adds to near-term bullish bias for test of key barriers at 0.7565 (Fibo 38.2% of 0.7812/0.7412 fall) and 0.7584 (falling 20SMA), break of which would generate strong bullish signal. Broken 10SMA (0.7507) is expected to hold and keep bullish scenario in play.
Res: 0.7565, 0.7584, 0.7612, 0.7641
Sup: 0.7507, 0.7472, 0.7450, 0.7412
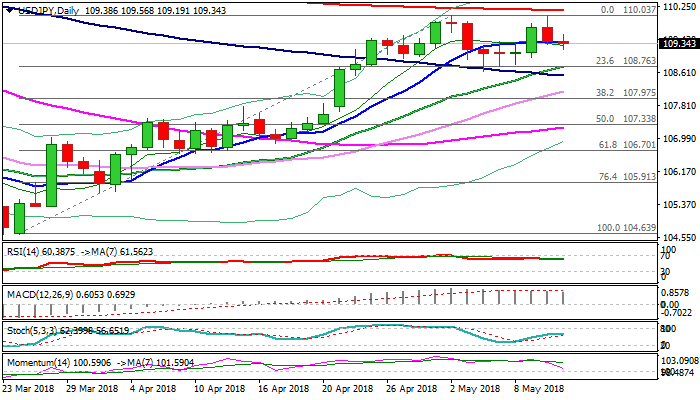
USDJPY – Bullish Bias Above 10SMA For Renewed Attack At 110 Barrier And 200SMA
The pair remains biased higher and looks for renewed attack at key barriers at 110.00 and 200SMA (110.15) after bulls were repeatedly rejected at psychological 110 barrier on Thursday and subsequent pullback contained by 10SMA (109.40) which marks key near-term support.
Weekly close above 200SMA is needed to signal continuation of larger uptrend from 104.63 (26 Mar low).
Bullish setup of daily MA's is partially offset by weakening momentum, which could keep in play risk of deeper pullback.
Today's close below 10SMA would be negative signal and risk test pivotal 108.75 support (higher low, reinforced by rising 20SMA), break of which would generate strong bearish signal on confirmation of a double-top at 110.
Res: 109.56, 110.03, 110.15, 110.48
Sup: 109.19, 108.99, 108.75, 108.53
EUR/GBP Daily Outlook
Daily Pivots: (S1) 0.8751; (P) 0.8793; (R1) 0.8858; More...
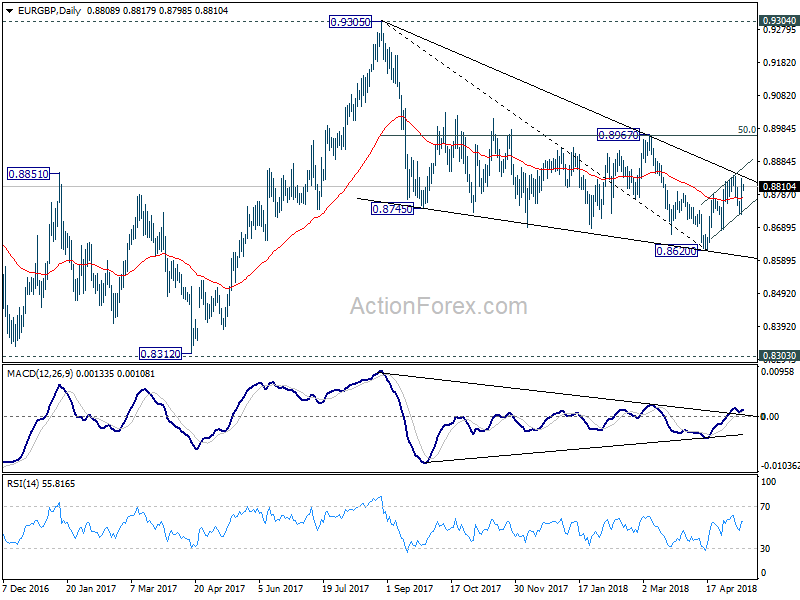
While EUR/GBP rebounded strongly, it's limited below 0.8844 resistance. Intraday bias remains neutral first. On the upside, break of 0.8844 will revive the case of bullish trend reversal. Intraday bias will be turned back to the upside for 0.8967 cluster resistance (50% retracement of 0.9305 to 0.8620 at 0.8963) to confirm. On the downside, however, below 0.8727 will target a test on 0.8620 low instead.
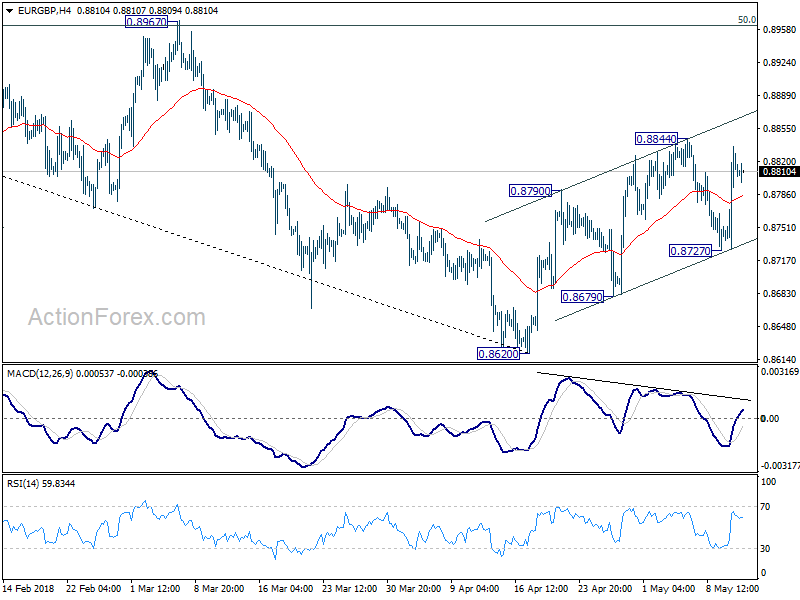
In the bigger picture, for now, the decline from 0.9305 is seen as a leg inside the long term consolidation pattern from 0.9304 (2016 high). Such consolidation pattern could extend further. Hence, in case of strong rally, we'd be cautious on strong resistance by 0.9304/5 to limit upside. Meanwhile, in another decline attempt, we'd expect strong support from 0.8116 cluster support (50% retracement of 0.6935 to 0.9304 at 0.8120) to contain downside.