Sample Category Title
USD/CHF Daily Outlook
Daily Pivots: (S1) 0.9996; (P) 1.0026; (R1) 1.0058; More...
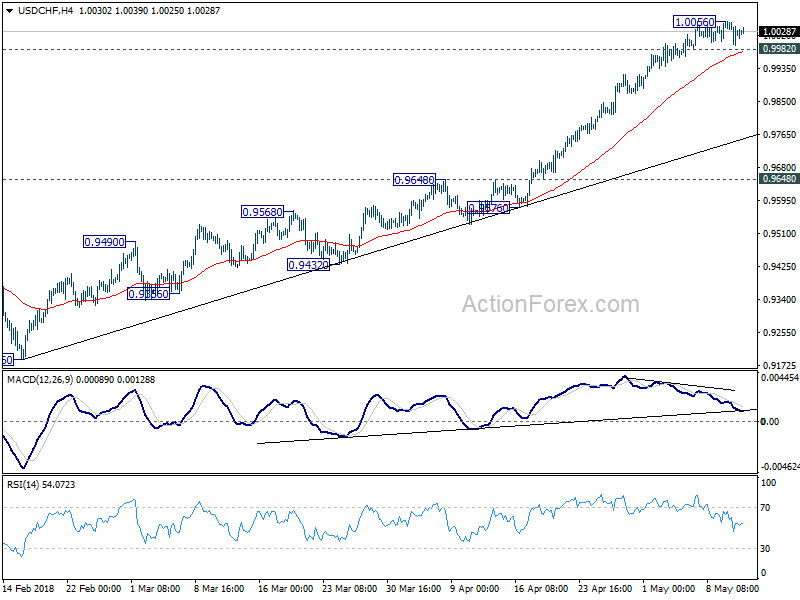
Intraday bias in USD/CHF remains neutral for the moment. Consolidation should be brief as long as 0.9982 minor support holds. Break of 1.0056 will resume recent rise for 1.0342 key resistance. However, break of 0.9982 will turn bias to the downside for deeper pull back, possibly to trend line support (now at 0.9757) before staging another rally.
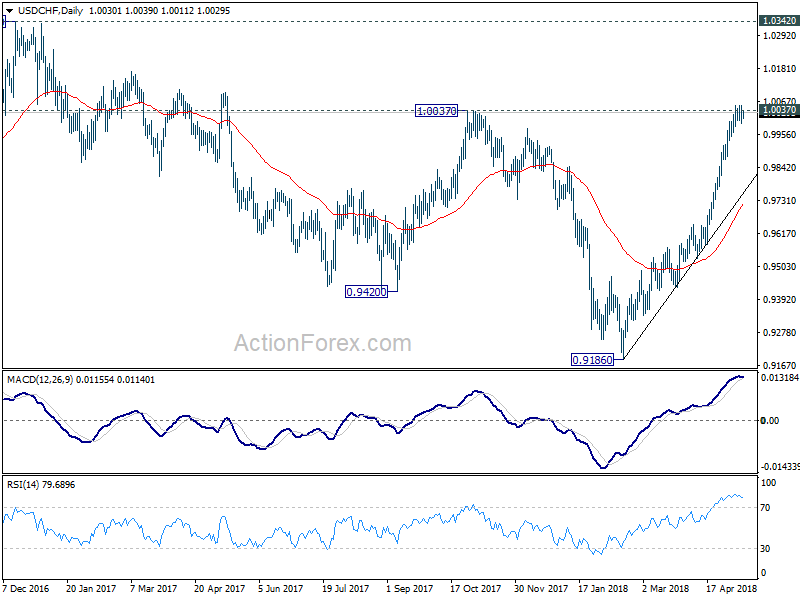
In the bigger picture, medium term decline from 1.0342 has completed with three waves down to 0.9186. Rise from there is currently viewed as a leg inside the long term range pattern. Hence, while further rally would be seen, we'd be cautious on strong resistance from 1.0342 to limit upside. For now, further rise is expected as long as 0.9648 resistance turned support holds, even in case of pull back.
USDCAD Plunges Below 1.3000 Strong Key Level, Bearish In Short-Term
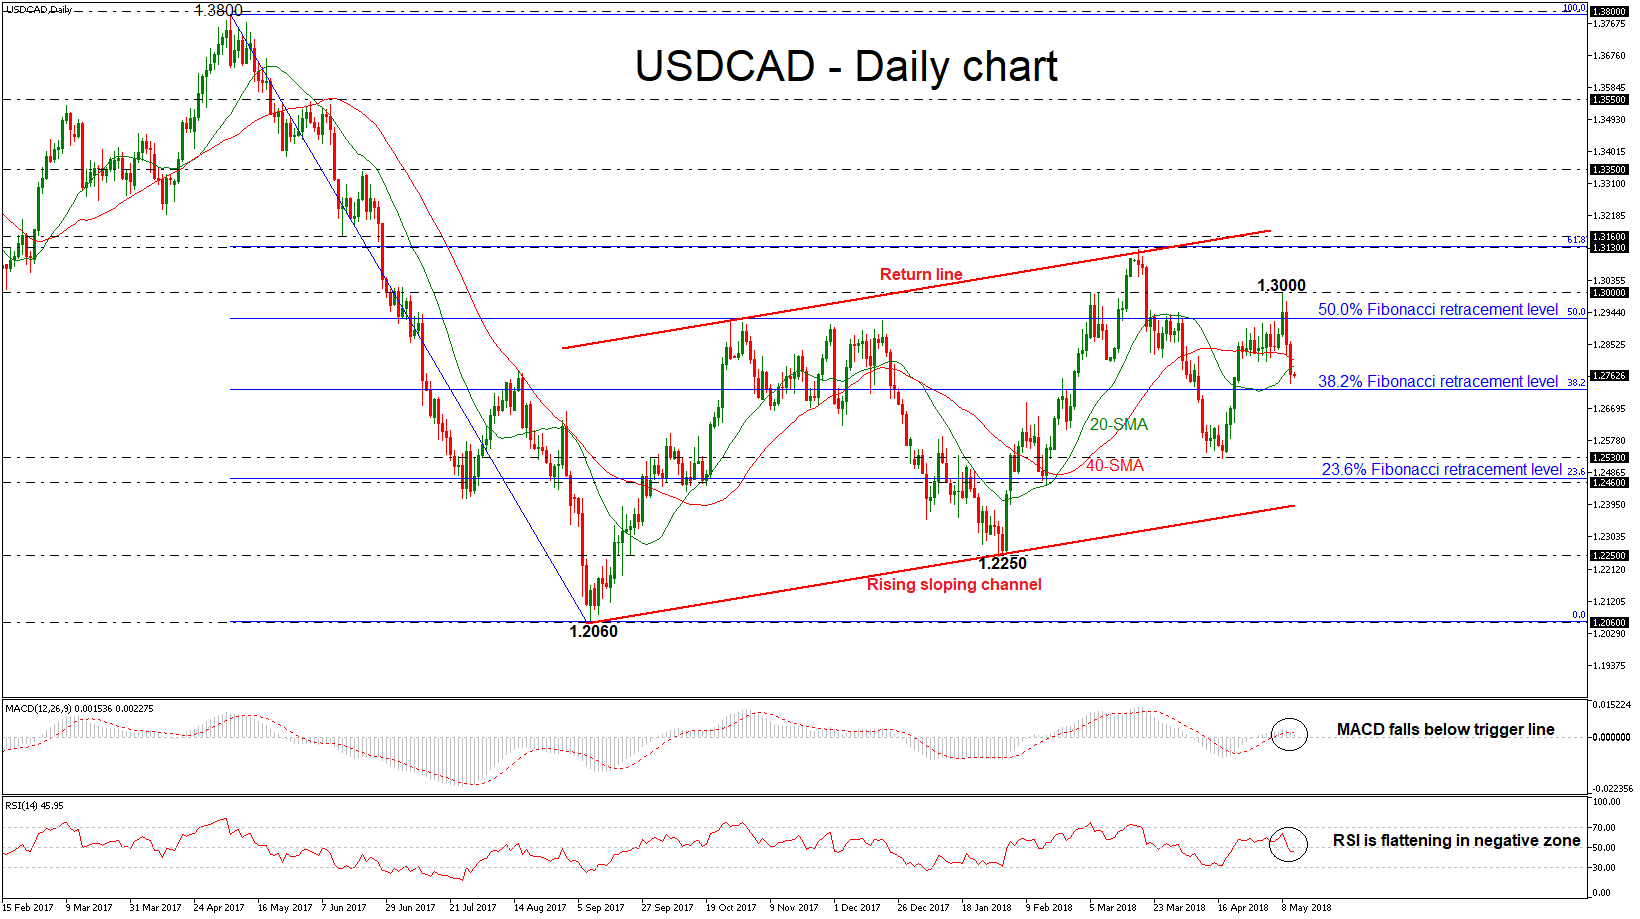
USDCAD has been underperforming in the past two days, following the rebound on the 1.3000 strong psychological level on Tuesday. The pair plunged below the 50.0% Fibonacci retracement level of 1.2925 of the downleg from 1.3800 to 1.2060 and is developing below the 20- and 40-simple moving averages (SMAs) in the short-term as well.
Looking at the daily timeframe, the MACD oscillator slipped below its trigger line in the positive area, while the RSI indicator fell in the negative zone but lost some of its strengthening bearish momentum. Both are confirming the scenario of further declines in price action.
Should prices continue to move lower, immediate support could come at 38.2% Fibonacci retracement level of 1.2720. A drop below this area would take the price to the next low of 1.2530 and significantly weaken the bullish medium-term structure.
In the event of an upside reversal, the 50.0% Fibonacci mark at 1.2925 could act as a barrier before being able to re-challenge the 1.3000 handle. A climb above this significant region would open the way towards the 1.3130 resistance level, taken from the peak on March 19, which overlaps with the 61.8% Fibonacci.
Turning to the medium-term picture, the pair has been trading within a rising sloping channel since September 2017, failing several times to exit from this range.
EUR/USD Daily Outlook
Daily Pivots: (S1) 1.1856; (P) 1.1901 (R1) 1.1960; More....
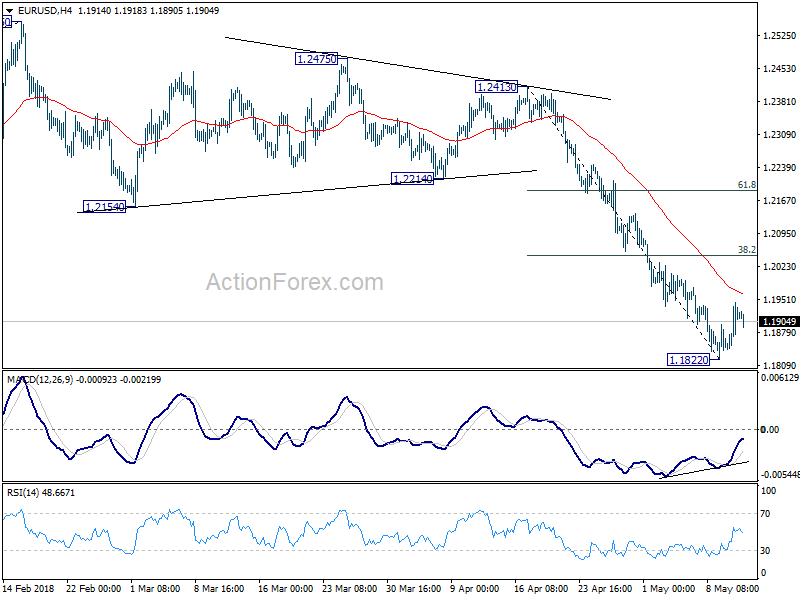
With a short term bottom formed at 1.1822, further rebound is in favor in EUR/USD for 4 hour 55 EMA (now at 1.1962) and above. However, upside should be limited by 38.2% retracement of 1.2413 to 1.1822 at 1.2048 to bring fall resumption. Below 1.1822 will resume the whole decline from 1.2555 and target 1.1708 medium term fibonacci level next.
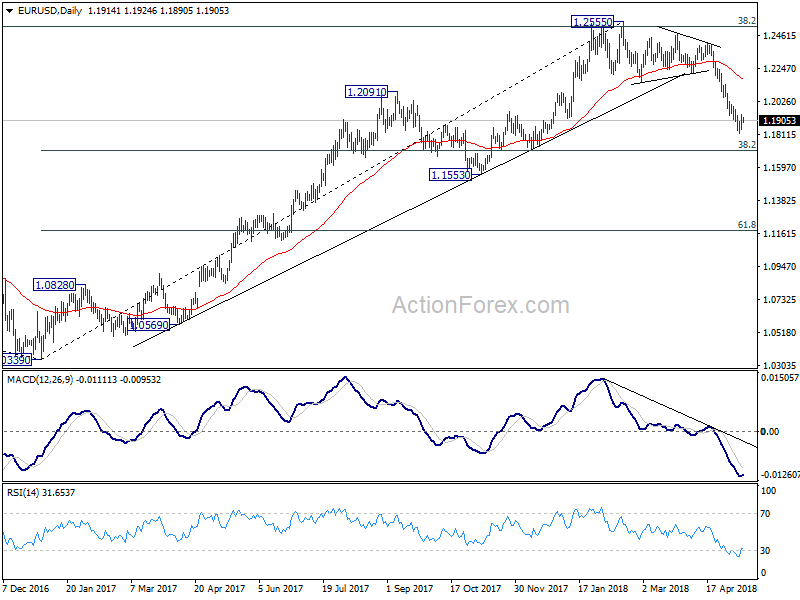
In the bigger picture, current decline and firm break of 1.2154 support confirms rejection by 38.2% retracement of 1.6039 (2008 high) to 1.0339 (2017 low) at 1.2516. A medium term top should be in place at 1.2555 and deeper decline would be seen back to 38.2% retracement of 1.0339 to 1.2555 at 1.1708 first. With current downside acceleration, there is prospect of hitting 61.8% retracement at 1.1186 before completing the decline. But still, we'll need to look at the structure before deciding if it's a corrective or impulsive move.
GBPUSD Only Intraday Bearish Below 1.3500 Level
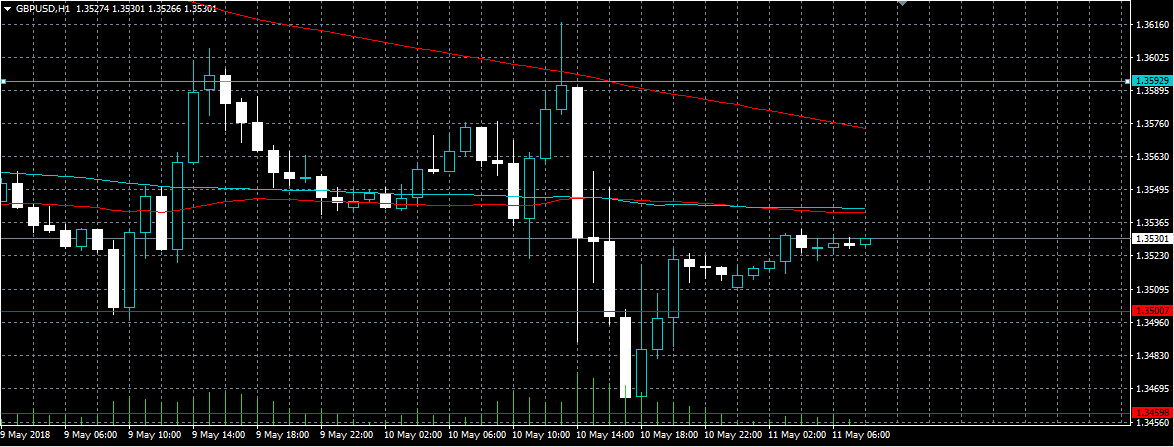
The British pound has moved back towards the key 1.3500 level against the U.S dollar, after the Bank of England struck a more dovish tone at yesterday’s policy meeting. The GBPUSD pair had bounced prior to the BOE decision, but quickly fell-lower on the dovish BOE Policy Statement, hitting 1.3459. Sterling traders are likely to focus on the pair’s 200-day moving average, and further downside if sellers push price back below the 1.3500 level.
The GBPUSD pair remains bearish while trading below the 1.3500 level. Further losses towards 1.3459 and 1.3425 seem possible.
If the GBPUSD pair starts to hold price above the 1.3500 level, key intraday resistance is now found at the 1.3542 and 1.3592 levels.
USDJPY Selling Continues After Softer U.S CPI
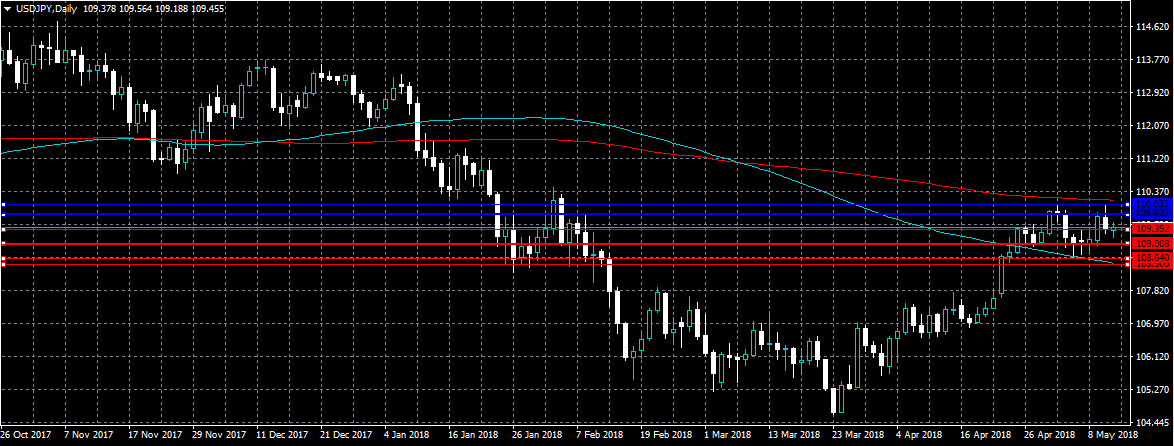
The U.S dollar has continued to move lower against the Japanese yen currency, after the United States economy posted weaker than expected monthly CPI Inflation data. The USDJPY pair currently trades around the 109.39 level, after finding strong interim technical support from the 109.19 level. Traders are likely to focus on the current unwinding in the value of the U.S dollar index, and the release of U.S Consumer Confidence data later today.
The USDJPY pair is bearish while trading below the key 109.39 level, key support is found at the 108.93 and 108.60 levels.
If the USDJPY trades back above the 109.39 level, traders may test back towards the 109.80 and 110.03 level.
North America In The Spotlight On Friday
Economic data and monetary policy will make headlines on Friday, with North America seeing the most potential in terms of impact. That said, a policy-oriented speech from Europe is expected to generate significant headlines.
On the data front, Europe has very little to offer on Friday. The Spanish government will release a pair of inflation figures at 07:00 GMT, which could provide a snapshot of regional consumer price trends. Spain's consumer price index (CPI) is forecast to rise 0.8% in April, translating into a year-over-year growth rate of 1.1%. Spain's harmonised index of consumer prices (HICP) is forecast to rise by a similar amount.
European Central Bank (ECB) Governor, Mario Draghi, will deliver a speech shortly after North American markets begin trading. The ECB head presided over the recent decision to keep interest rates on hold. The ECB is monitoring a sharp pick up in economic activity, though significant downside risks remain.
In terms of North American data releases, the US Department of Labor will report on export and import prices on Friday. Washington's export price index is forecast to rise 3.6% in the 12 months through April, up from 3.4% the month before.
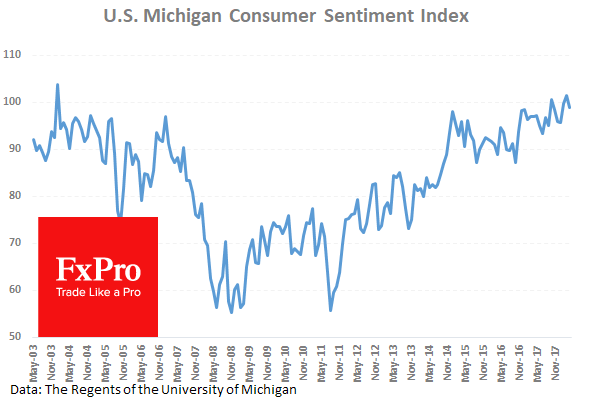
Later in the session, the University of Michigan will produce the May edition of its consumer sentiment index. The sentiment indicator is projected to edge down slightly to 98.5 for May from 98.8 the month before.
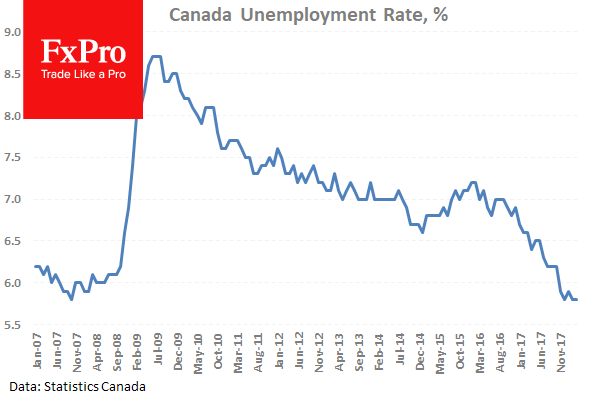
North of the border, the Canadian government will release its monthly employment report at 12:30 GMT. Canada's unemployment rate is forecast to hold steady at 5.8% as 17,400 jobs are added to the economy.
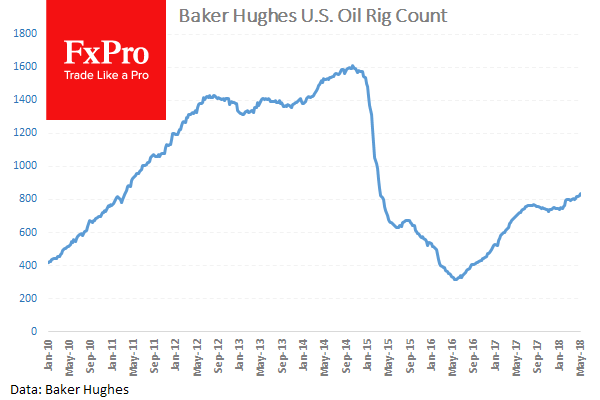
Energy traders will also be keeping tabs on the weekly rig count data courtesy of Baker Hughes Inc. With oil prices surging, US shale producers are chomping at the bit to reactivate their production.
EUR/USD
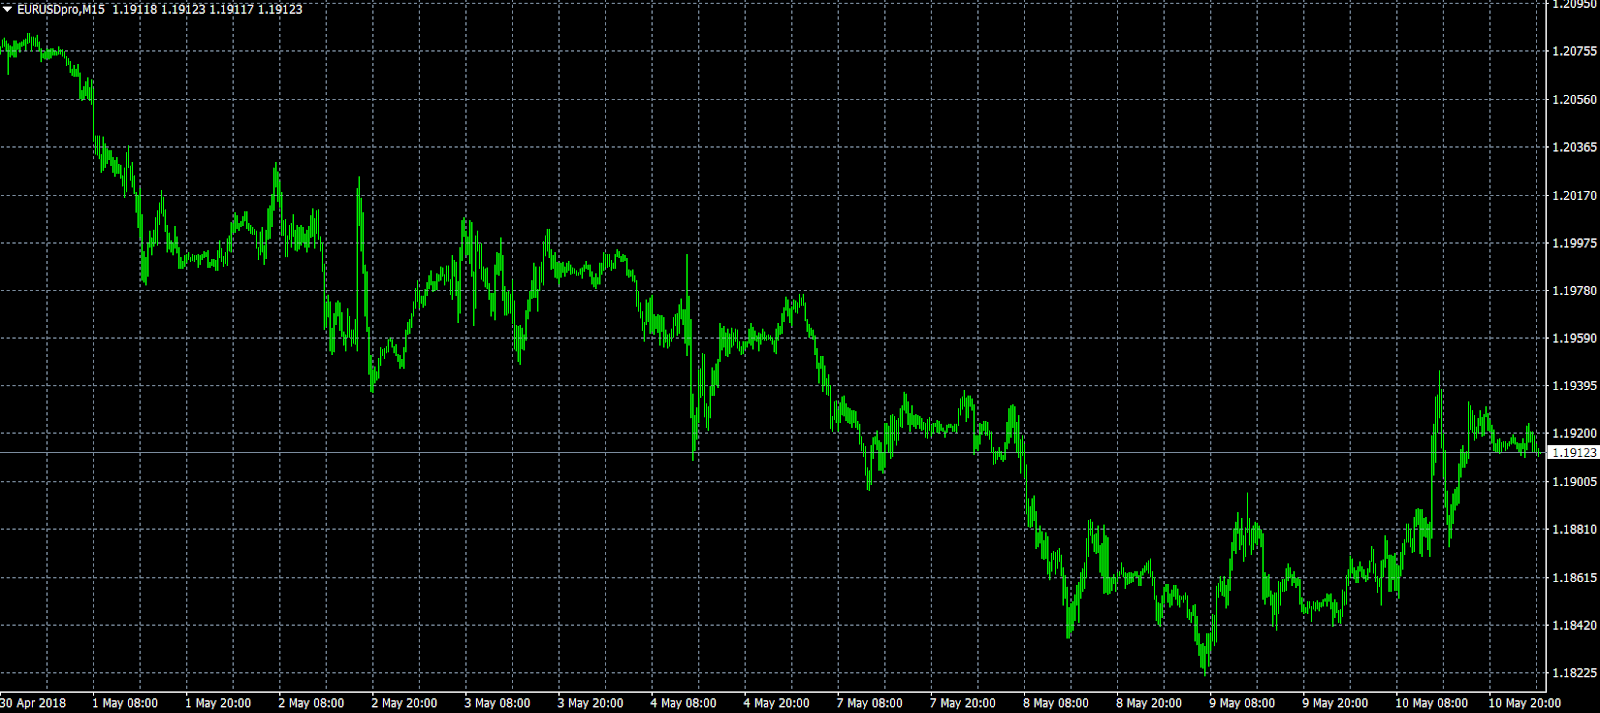
Europe's common currency bottomed in the low 1.1830 US region on Thursday before rebounding later in the session. EUR/USD was last seen trading at 1.1914, where it was virtually unchanged from the previous close. Prices are supported at 1.1880. On the opposite side of the ledger, immediate resistance is located at 1.1960.
USD/CAD
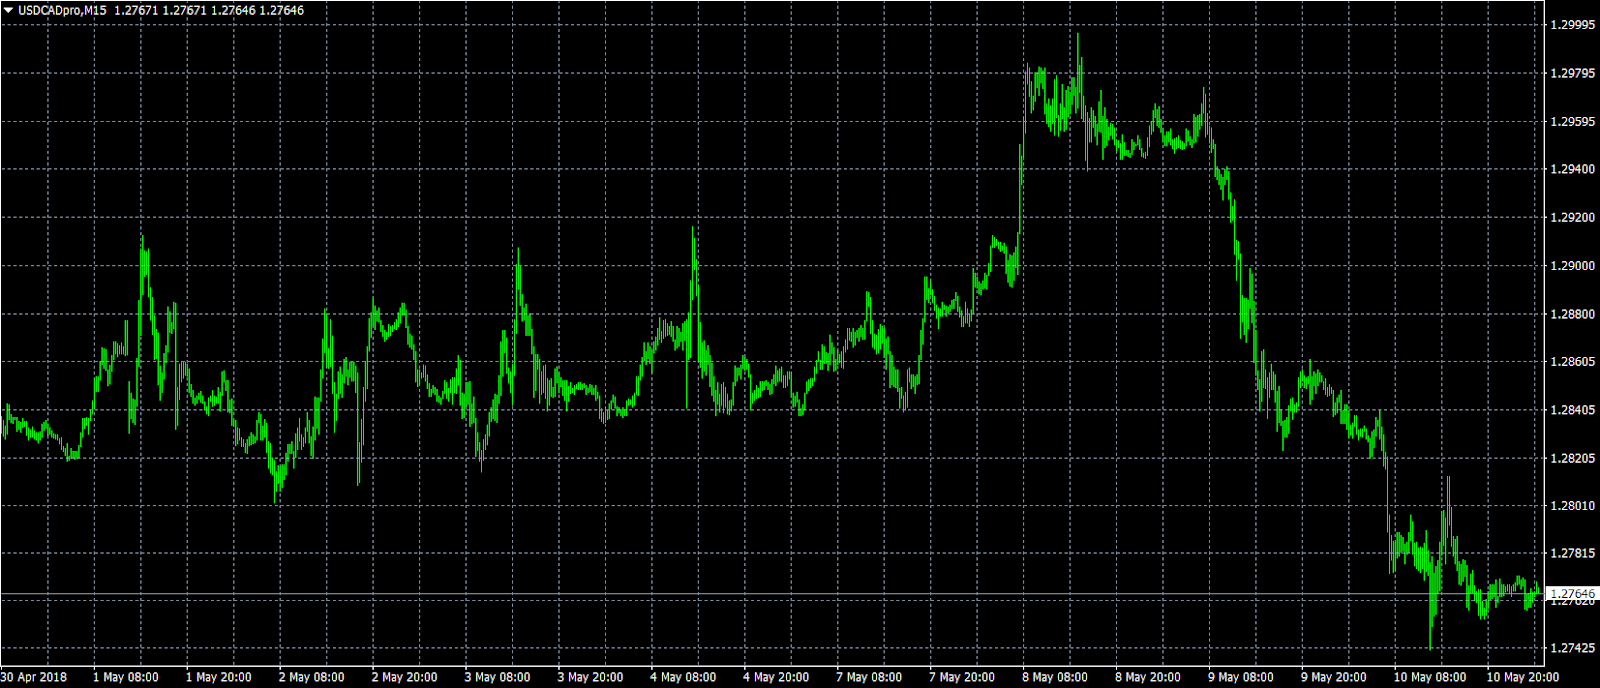
Rising oil prices lifted the Canadian dollar to three-week highs on Thursday, as the USD/CAD exchange rate plunged back below 1.2800. The pair is now trading around 1.2770 after shedding more than 200 pips from its recent high. Canadian employment data will provide much of the catalyst on Friday.
GBP/USD
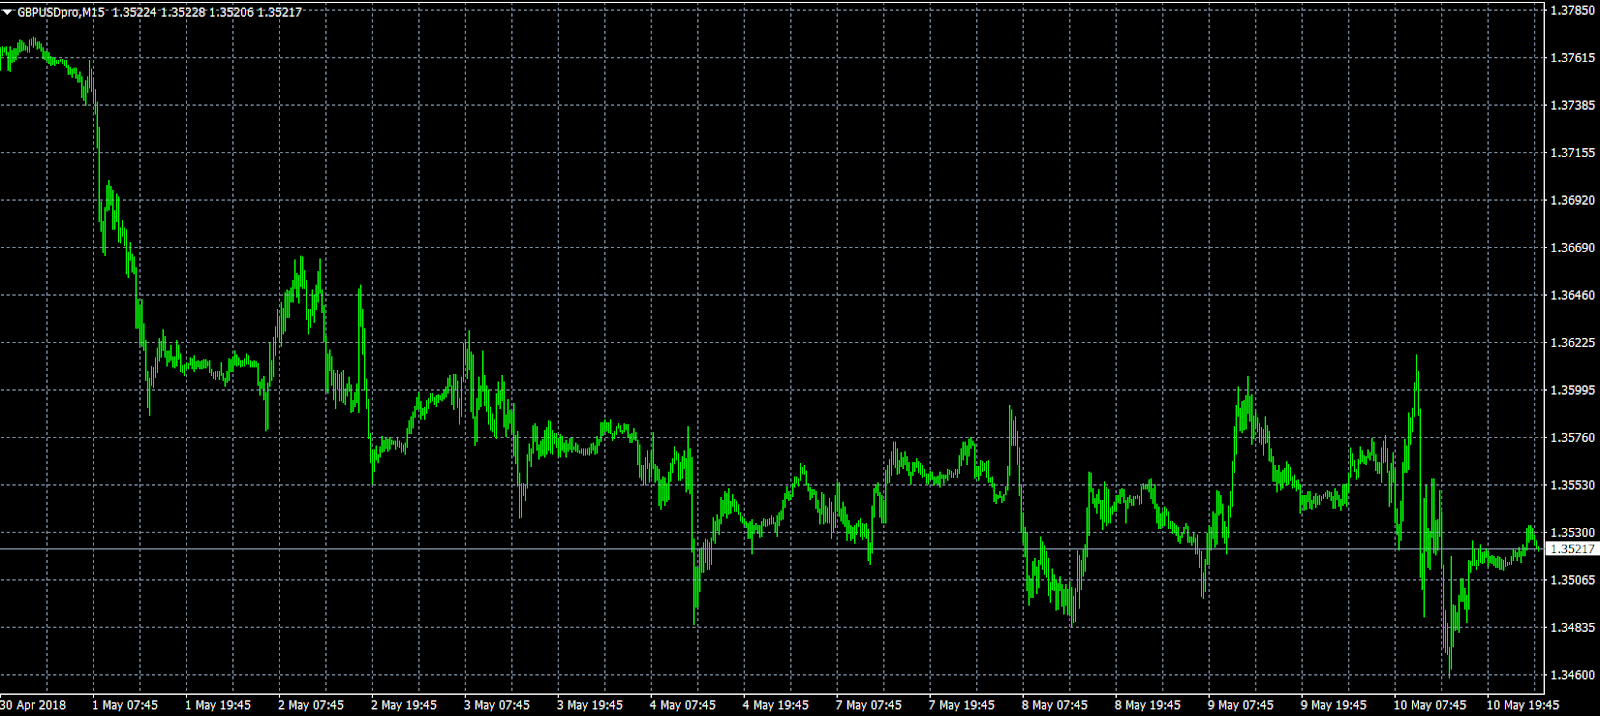
Cable weakened on Thursday after the Bank of England kept monetary policy on hold in a 7-2 vote. GBP/USD bottomed below 1.3430 but has since recovered to trade at 1.3523. The trading outlook is highly choppy, with pound sterling susceptible to bigger downside risks in the short term.
Canadian Unemployment Rate Forecast To Hold Steady At 5.8%
At 08:30 GMT, Hong Kong Gross Domestic Product (YoY) (Q1) data will be released with a previous reading of 3.4%. This data has been lower since the high of 4.3% achieved in May 2017. HKD pairs could move because of this data release.
At 12:30 GMT, Fed Member Bullard is due to give a pre-scheduled speech. USD crosses could see spikes in volatility during this event.
At 12:30 GMT, Canadian Unemployment Rate (Apr) is expected to be unchanged at 5.8%. Participation Rate (Mar) is also expected to be unchanged at 65.5%. Net Change in Employment (Mar) is expected to be 17.4K against a prior 32.3K. Unemployment had fallen to 5.7% in December, the lowest levels in ten years, but ticked up slightly in January with the large drop to -88K in the Net Change in Employment data, the largest fall since 2009. CAD pairs may see an increase in price movement from this data.
At 13:00 GMT, BOC Governing Council Member Wilkins is expected to speak in a panel discussion titled “Closing the Gap: How an Inclusive Economy is a More Secure One” at the Women’s Forum for the Economy and Society, in Toronto. CAD crosses may be affected by any comments made.
At 13:15 GMT, ECB President Mario Draghi will speak at the 8th edition of The State of the Union, organized by the European University Institute, in Florence. Comments made may give some insight on current thinking and future monetary policy for the EUR.
At 14:00 GMT, US Michigan Consumer Sentiment Index (May) is expected to come in at 98.5 against a previous 98.8. The March reading was a record high for the index, at 102.0, and a slight slip lower is expected again this time around. USD pairs may react to this data release, which is seen as a barometer of consumer spending.
At 17:00 GMT, Baker Hughes US Oil Rig Counts is due to be released with a headline number from last week of 834. As this number creeps higher, more and more rigs are coming into operation, increasing the supply of oil and adding downward pressure on prices. WTI Oil can become volatile around this data release and it will be in traders’ minds when trading resumes on Monday.
Markets Steady Ahead Of European Open
After further increases in stock markets yesterday, the market is pausing and consolidating ahead of European trading. Asian equity markets are in the green, trading up around 1% but Chinese markets are lagging due to trade tensions with the US. Dovish comments from BOE Governor Carney and soft US CPI data yesterday led to a risk-on mood in markets. Lower inflation is a key driver at the moment, with markets fearing any move higher in rates. USDJPY has slipped lower from its second test of the 110.000 level, as US 10-Year yields hang just under the 3% mark, at 2.97%. Spot US Oil is off its high from yesterday of $71.80, trading around $71.26.
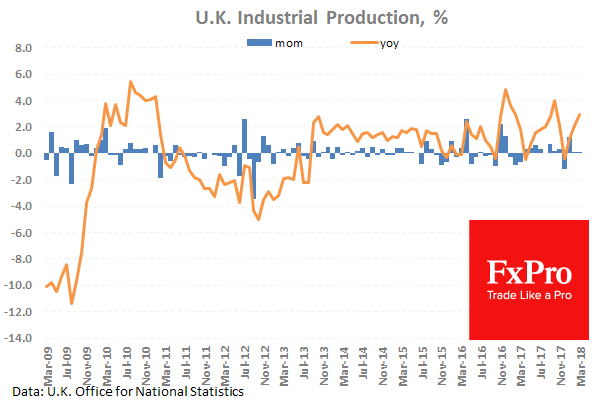
UK Industrial Production (YoY) (Mar) was 2.9% versus an expected 3.1%, against a previous 2.2%, which was revised down to 2.1%. Industrial Production (MoM) (Mar) was 0.1% versus an expected 0.2%, against 0.1% previously. This reading came in higher than last month but again failed to meet expectations. Manufacturing Production (YoY) (Mar) was 2.9% versus an expected 2.9%, against 2.5% previously. Manufacturing Production (MoM) (Mar) was -0.1% versus an expected -0.2%, against -0.2% previously. GBPUSD moved higher from 1.35268 to 1.36170 after this data release.
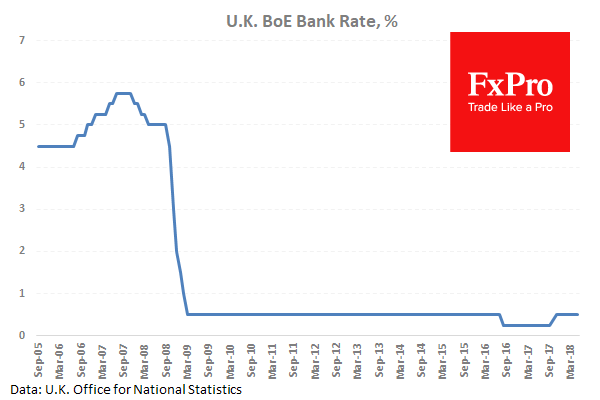
The Bank of England’s Interest Rate Decision resulted in rates remaining unchanged at 0.5%. The BOE Minutes, BOE Quarterly Inflation Report and the Monetary Policy Statement were also released at the same time. The BOE Asset Purchase Facility remained unchanged at £435B. BOE Governor Mark Carney led the Press Conference where he continually repeated that he was confident in the economy but any hikes would be “limited and gradual”. The BOE is in “wait and see mode”, with a focus on Q2 data. GBPUSD fell from 1.35951 to a low of 1.34900 during this event.
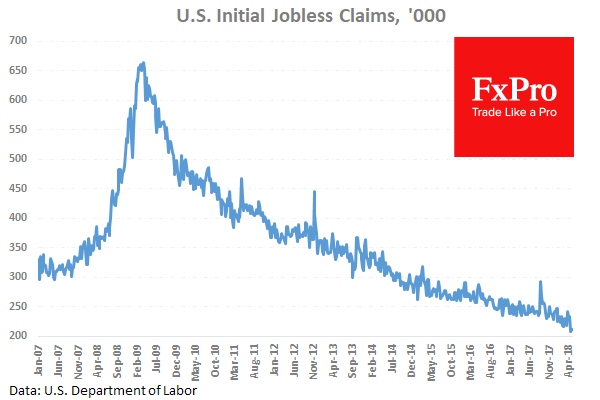
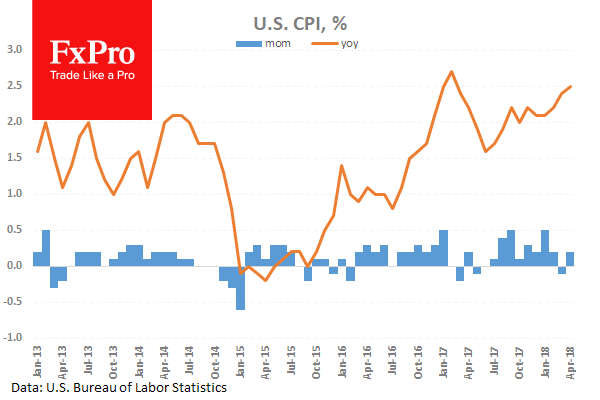
US Continuing Jobless Claims (Apr 27) were 1.790M versus an expected 1.778M, against 1.756M previously, which was revised up to 1.760M. Initial Jobless Claims (May 4) was 211K versus an expected 218K, against 211K previously. This data is showing a continuing increase in the number of people who are jobless. US Consumer Price Index (YoY) (Apr) data was released, coming in as expected at 2.5% against 2.4% previously. Consumer Price Index Ex-Food & Energy (YoY) (Apr) data was released, missing the expected reading of 2.2% and matching the previous 2.1% reading. Consumer Price Index Ex-Food & Energy (MoM) (Apr) came in at 0.1% versus an expected reading of 0.2%, against 0.2% previously. Consumer Price Index (MoM) (Apr) data was released coming in at 0.2% versus an expected reading of 0.3%, against -0.1% previously. Consumer Price Index Core s.a. (Apr) data came in at 256.450 versus an expected reading of 256.899, against 256.200 previously. These data points will provide an updated measure of the effect of inflation on consumers. Inflation is one of the main drivers of market sentiment in the US currently. The expectation was for an increase in consumer prices, with most data matching or falling marginally short of those expectations. USDJPY fell from 109.593 to 109.316 after this data release.
EURUSD is down -0.04% overnight, trading around 1.19104.
USDJPY is up 0.10% in early session trading at around 109.495.
GBPUSD is unchanged this morning, trading around 1.35167.
USDCAD is unchanged overnight, currently trading around 1.27668.
Gold is down -0.17% in early morning trading at around $1,318.91.
WTI is down -0.22% this morning, trading around $71.26.
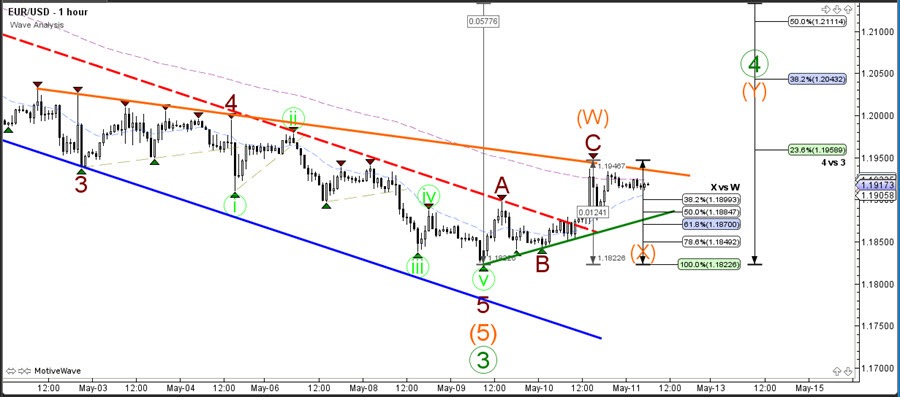
EUR/USD Bullish Break Of Downtrend Starts Wave 4 Correction
The EUR/USD made a bullish breakout above the resistance of the downtrend channel. This bullish breakout could indicate the end of wave 3 (green) and the start of wave 4 (green). Price has already reached and respected the 23.6% Fibonacci retracement level of the wave 4. Price however could retrace deeper to the 38.2% or 50% Fibonacci level. A break above the 61.8% Fib would make such a wave 4 (green) pattern less likely. A break below support could perhaps see an immediate continuation lower and indicate the completion of wave 4.
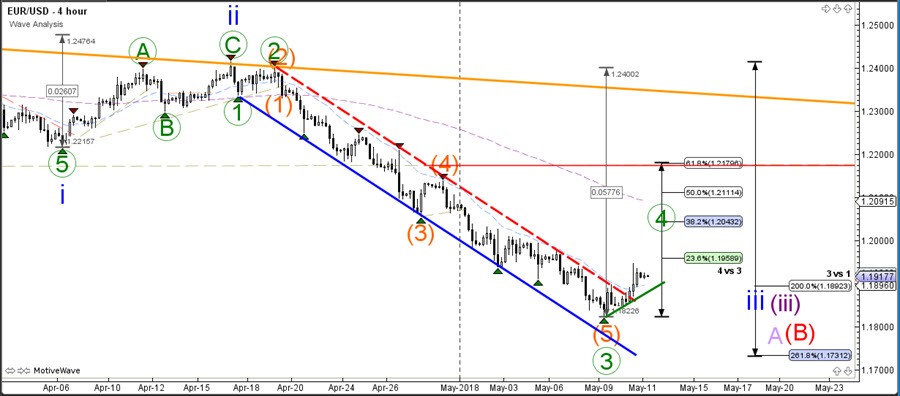
The EUR/USD seems to have completed a bullish ABC (brown) pattern, which could be part of a larger WXY (orange) correction. A bullish break above resistance (orange) could still a larger bullish correction. However, a bearish breakout below the support trend line (green) could indicate a trend continuation towards 1.17-1.18.
GBP/USD Daily Outlook
Daily Pivots: (S1) 1.3444; (P) 1.3530; (R1) 1.3602; More...
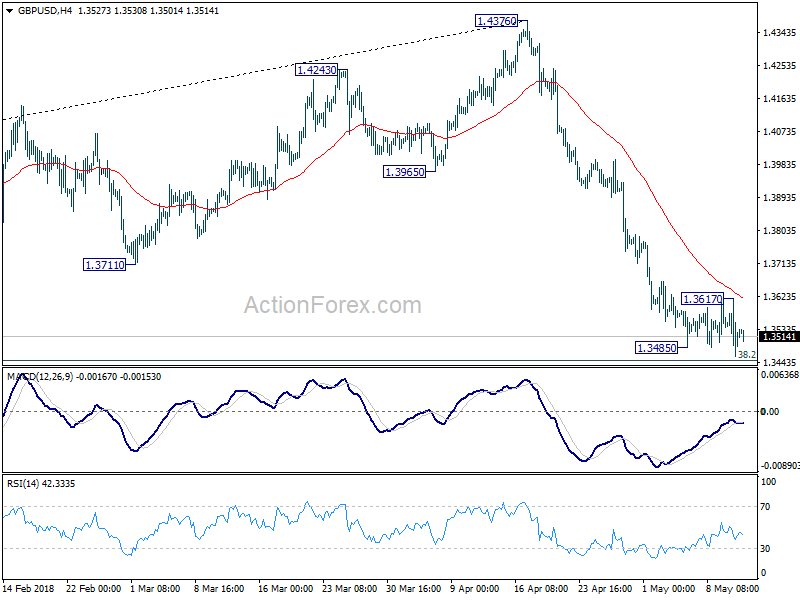
GBP/USD dipped to 1.3459 as recent decline resumed. But downside momentum is a bit week. Nonetheless, intraday bias is back on the downside. Firm break of 1.3448 fibonacci level will pave the way to next fibonacci level at 1.2874. On the upside, break of 1.3617 will indicate short term bottoming. In that case, bias will be turned to the upside for stronger rebound, possibly back to 55 day EMA (now at 1.3869).
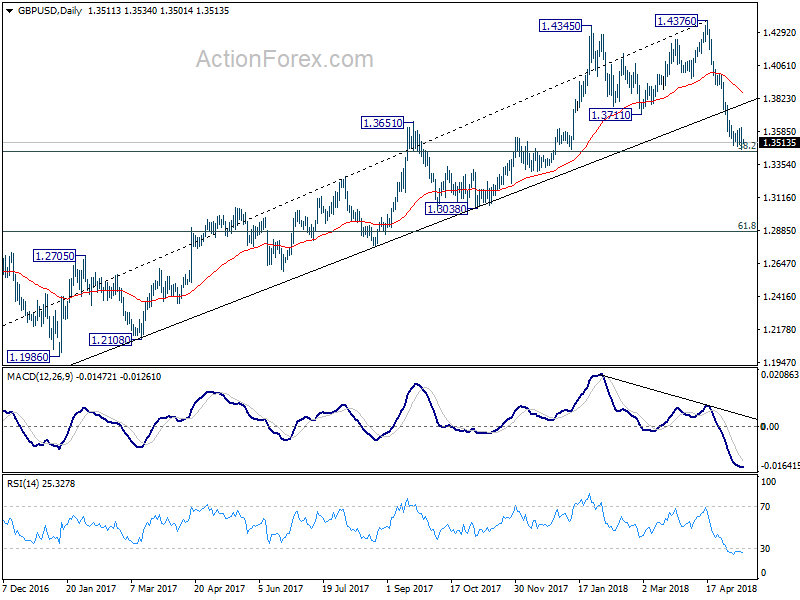
In the bigger picture, current development suggests that whole medium term rebound from 1.1936 (2016 low) has completed at 1.4376 already, with trend line broken, on bearish divergence condition in daily MACD, after rejection from 55 month EMA (now at 1.4223). Deeper decline should be seen to 38.2% retracement of 1.1936 (2016 low) to 1.4376 at 1.3448 first. Break will target 61.8% retracement at 1.2874 and below. Outlook will stay bearish as long as 55 day EMA (now at 1.3925) holds, even in case of strong rebound.