Sample Category Title
AUD/USD Daily Outlook
Daily Pivots: (S1) 0.7738; (P) 0.7773; (R1) 0.7795; More...
Intraday bias in AUD/USD remains neutral at this point. Another rise in favor as long as 0.7725 minor support holds. Above 0.7809 will target 0.7915 resistance first. Break there will confirm that whole decline from 0.8135 has completed. However, below 0.7725 will bring retest of 0.7642 low instead.
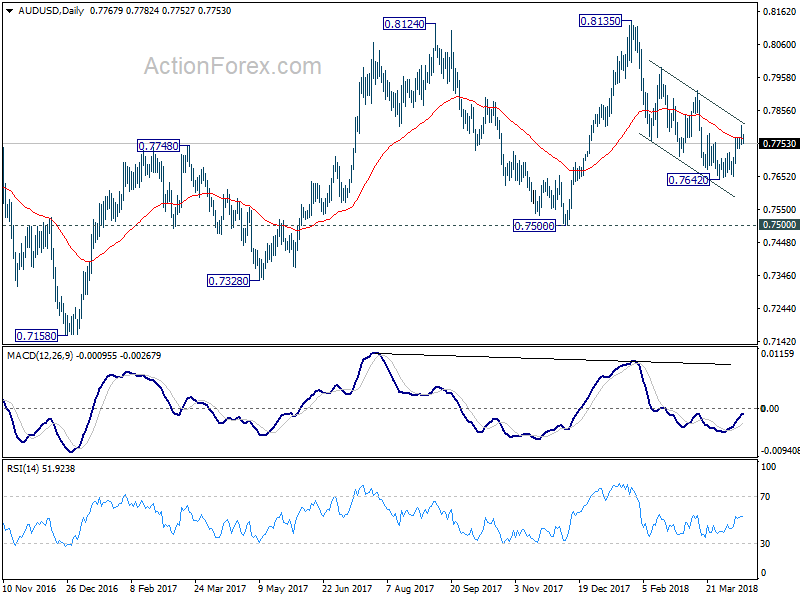
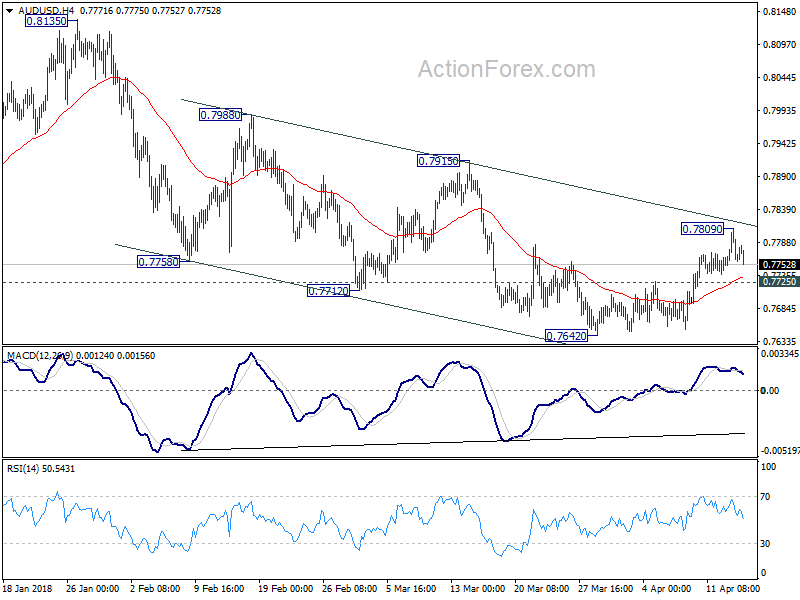 In the bigger picture, medium term rebound from 0.6826 is seen as a corrective move. It might still extend higher but we'd expect strong resistance from 38.2% retracement of 1.1079 to 0.6826 at 0.8451 to limit upside to bring long term down trend resumption. On the downside, break of 0.7500 support will now be an important signal that such corrective rebound is completed. In that case, AUD/USD would be heading back to 0.6826 low in medium term.
In The US, Retail Sales In March Are Due Out
Market movers today
In a week with few important data releases and scheduled events, we expect markets to remain focused on global politics - there have been encouraging signs on trade policy lately but increasing worries over Syria and the US-Russia relationship.
In the US, retail sales in March are due out. Retail sales have been weak in recent months but the slowdown comes after a period with strong growth. Retail sales are very noisy but, given the high degree of optimism among US consumers, we believe private consumption will remain a growth driver.
We also have a range of Fed speakers later today.
In Sweden, March HOX residential property prices are in the limelight, where we expect another fall in prices (see next page).
Selected market news
Despite heightened geopolitical tensions over Syria after America, France and Britain launched military strikes over the weekend, US and UK stock index futures are in the green this morning along with most Asian equities as the risk of a military showdown between the US and Russia faded. However, volatility will likely remain elevated, also because the US Treasury Department is set to announce fresh sanctions on Russia today related to its involvement in Syria's use of chemical weapons.
At the time of writing, EUR/USD was steady around the 1.233 level, while 10-year US Treasury yields ticked up to 2.84%. FX markets have been experiencing some trade war fatigue recently and, more importantly for both majors and EM, is the escalating Russia/Syria versus US/allies conflict in our view (see also FX section). The semi-annual FX report from the US administration notably did not label China a currency manipulator (though adding India to the watch list) and hence refrained from adding fuel to the trade war issue for now.
However, the pendulum keeps swinging in the US-China trade conflict. Recently, tensions eased following Xi Jinping's speech at the Boao Forum last week, but we could see a further escalation again this week. The White House is preparing to announce details on which goods categories of the USD100bn announced previously will be subject to a 25% tariff and in this case we expect China to be quick to announce a 1-1 retaliation. While we still believe in a deal between the US and China, ultimately we may be in for another escalation soon. We are likely to see ebbs and flows in the conflict before a deal is finally reached down the line (see also Flash Comment: Is Trump preparing for a round of trade escalation - again? ).
EU and UK officials will start talks about the post-Brexit relationship this week, according to an EU official . There remain marked differences between the two sides: The EU has rejected the UK's proposals as cherry picking, while the UK says the EU is being too inflexible. The sessions will also cover the still unresolved issue of the Irish border and other parts of the divorce agreement that remain to be settled.
EUR/USD Daily Outlook
Daily Pivots: (S1) 1.2307; (P) 1.2327 (R1) 1.2346; More....
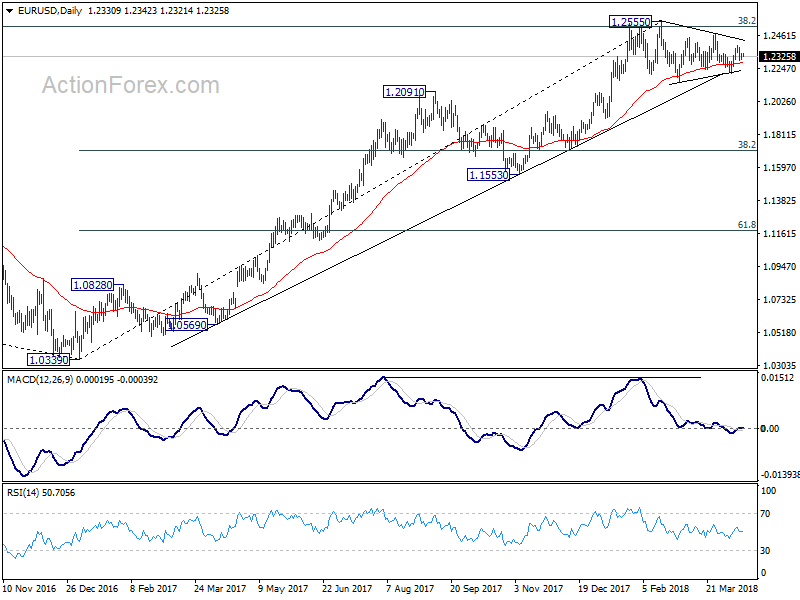
Intraday bias in EUR/USD remains neutral at this point, with focus on 1.2302 minor support. Break there will indicate completion of the rebound from 1.2214. Intraday bias would be turned back to the downside for 1.2214. Firm break there will revive the bearish case of trend reversal. On the upside, above 1.2396 will target 1.2475 and above to 1.2516/2555 key resistance zone.
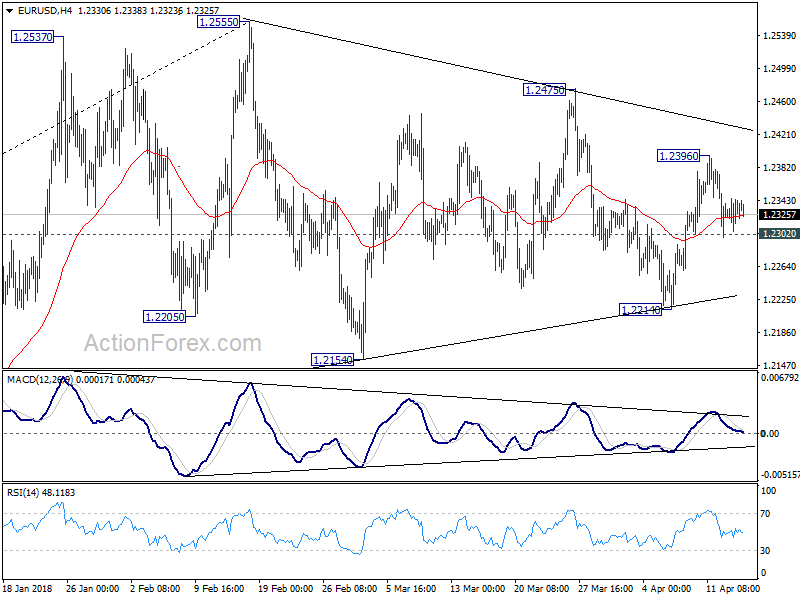 In the bigger picture, key fibonacci level at 38.2% retracement of 1.6039 (2008 high) to 1.0339 (2017 low) at 1.2516 remains intact despite attempts to break. Hence, rise from 1.0339 medium term bottom is still seen as a corrective move for the moment. Rejection from 1.2516 will maintain long term bearish outlook and keep the case for retesting 1.0039 alive. Firm break of 1.1553 support will add more medium term bearishness. However, sustained break of 1.2516 will carry larger bullish implication and target 61.8% retracement of 1.6039 to 1.0339 at 1.3862 in medium term.
GBP/USD Prepares Uptrend, EUR/USD Builds Triangle Pattern
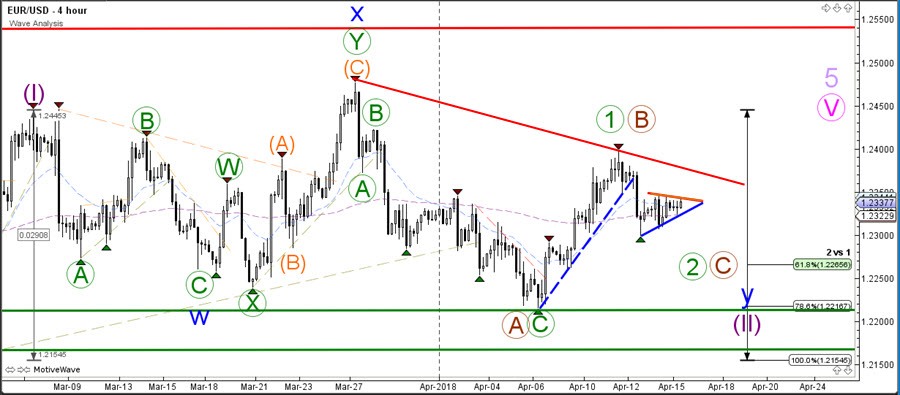
The EUR/USD is in a complex and lengthy correction. The entire chart could be part of wave 4 correction (pink) or price is already building a wave 1-2 (purple) as shown in this chart. Within wave 2, price could have completed an ABC (green) correction or still be building an expanded ABC (brown). Price will need to break above the resistance trend line (red) before more upside could be expected whereas a break below the support trend lines could indicate a bearish reversal.
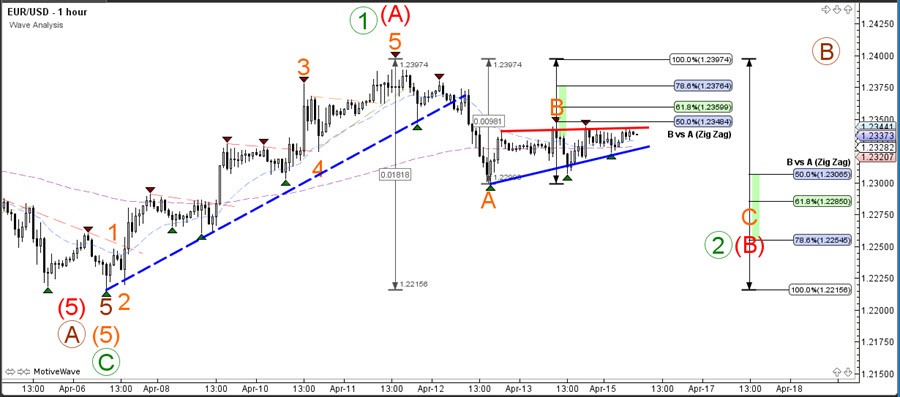
The EUR/USD is building a small chart pattern and the breakout direction could indicate a short-term movement. However, keep in mind that a bullish break is running into the potential resistance of the Fibonacci levels of wave B (orange). A break above the 100% Fib level of wave B (orange) could indicate an uptrend continuation rather than an ABC correction. The current wave count remains complicated as it could be part of a larger wave 2 (green), wave B (red) or even wave C of wave 2 (brown4 hour chart).
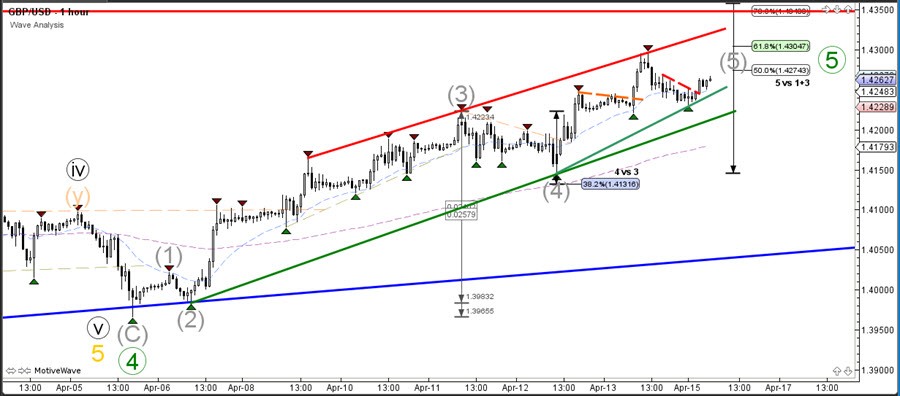
The GBP/USD remains in a strong bullish trend and it could be ready to continue with that trend to retest the key resistance zone as part of the 5th wave (green).
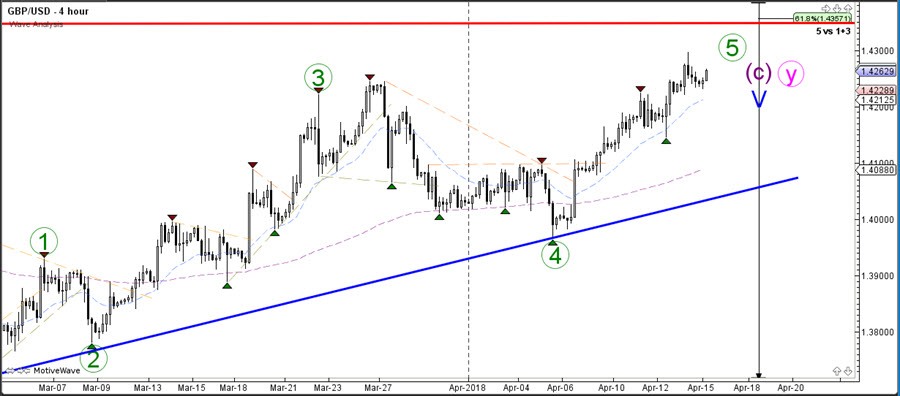
The GBP/USD is expanding the bullish wave 5 (grey) continuation within the uptrend. Price will need to break below the support levels (green) before a larger bearish reversal becomes more likely.
GBP/USD Daily Outlook
Daily Pivots: (S1) 1.4205; (P) 1.4250; (R1) 1.4281; More....
With 1.4220 minor support intact, intraday bias in GBP/USD remains mildly on the upside for 1.4345 high. Firm break there will resume medium term rally and target 61.8% projection of 1.3038 to 1.4345 from 1.3711 at 1.4519 next. On the downside, below 1.4220 minor support will turn intraday bias neutral again. But retreat should be contained well above 1.3964 support to bring another rally.
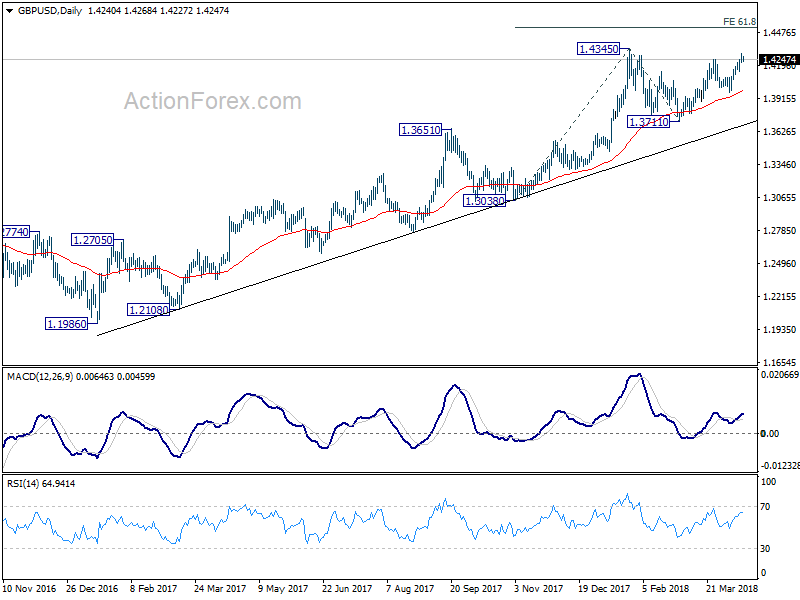
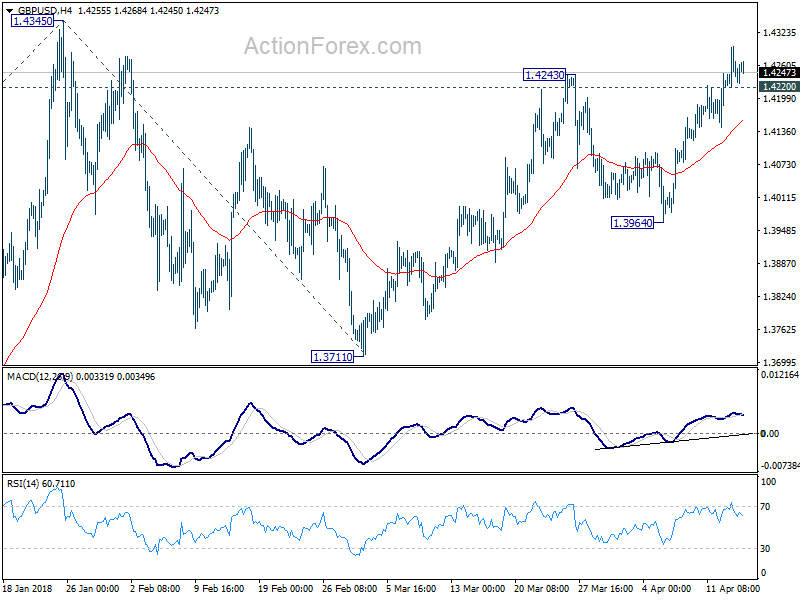 In the bigger picture, as long as 1.3651 resistance turned support holds, medium term outlook in GBP/USD will remain bullish. Rise from 1.1946 is at least correcting the long term down trend from 2007 high at 2.1161. Further rally would be seen back to 38.2% retracement of 2.1161 (2007 high) to 1.1946 (2016 low) at 1.5466. However, GBP/USD fails to sustain above 55 month EMA (now at 1.4267) so far. Break of 1.3651 will be the first sign of medium term reversal and turn focus to 1.3038 support for confirmation.
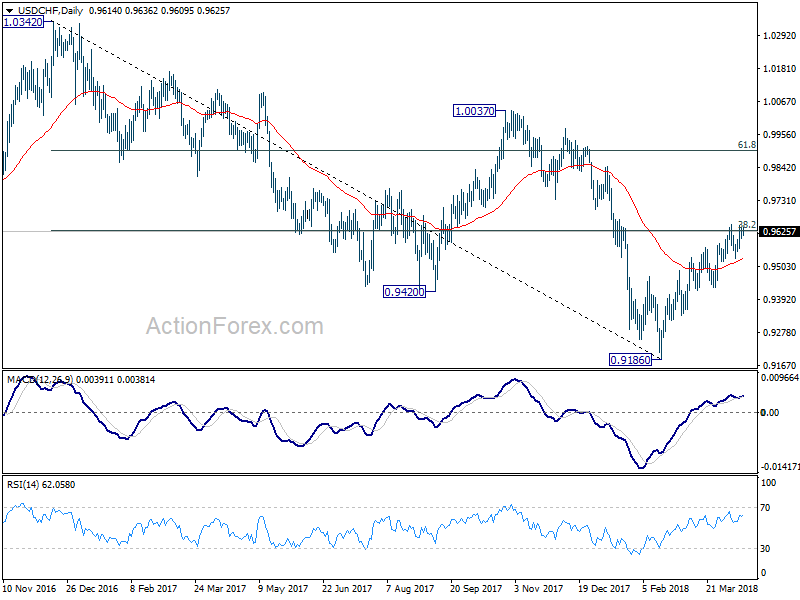
USD/CHF Daily Outlook
Daily Pivots: (S1) 0.9599; (P) 0.9618; (R1) 0.9638; More...
Intraday bias in USD/CHF remains neutral for the moment. Focus stays on 0.9626 key fibonacci resistance. Sustained trading above this level will be another evidence of larger reversal. In that case, further rally should be seen back to next fibonacci level at 0.9900. On the downside, though, break of 0.9533 minor support should indicate rejection by 0.9626. Further break of 0.9432 will turn near term outlook bearish for retesting 0.9186 low.
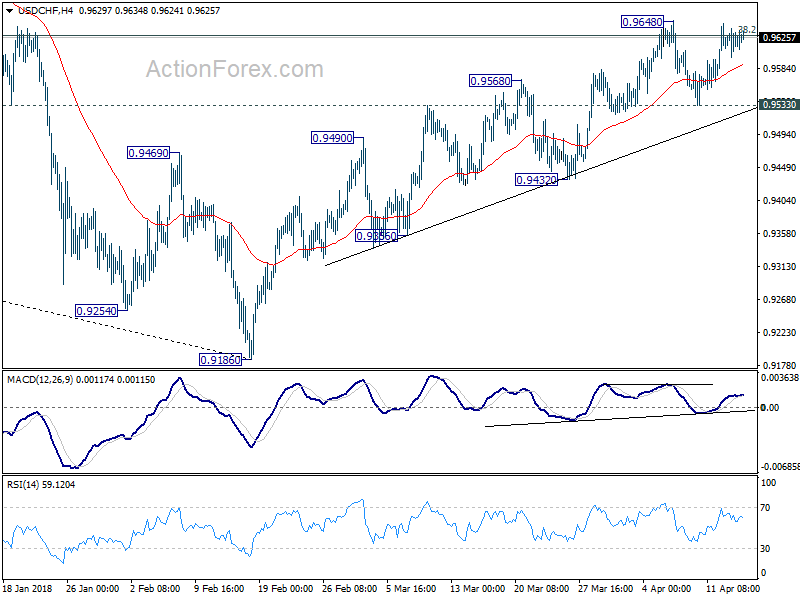 In the bigger picture, fall from 1.0342 is seen as a medium term down trend. Main focus is on 38.2% retracement of 1.0342 (2016 high) to 0.9186 (2018 low) at 0.9626. Sustained break there will add to the case of trend reversal and target 61.8% retracement at 0.9900 and above. However, rejection from 0.9626 will maintain medium term bearishness for another low below 0.9186.
Aussie Trading Higher This Morning
For the 24 hours to 23:00 GMT, the AUD rose 0.15% against the USD and closed at 0.7767 on Friday.
LME Copper prices rose 1.10% or $74.0/MT to $6830.0/MT. Aluminium prices rose 4.71% or $104.5/MT to $2325.0/MT.
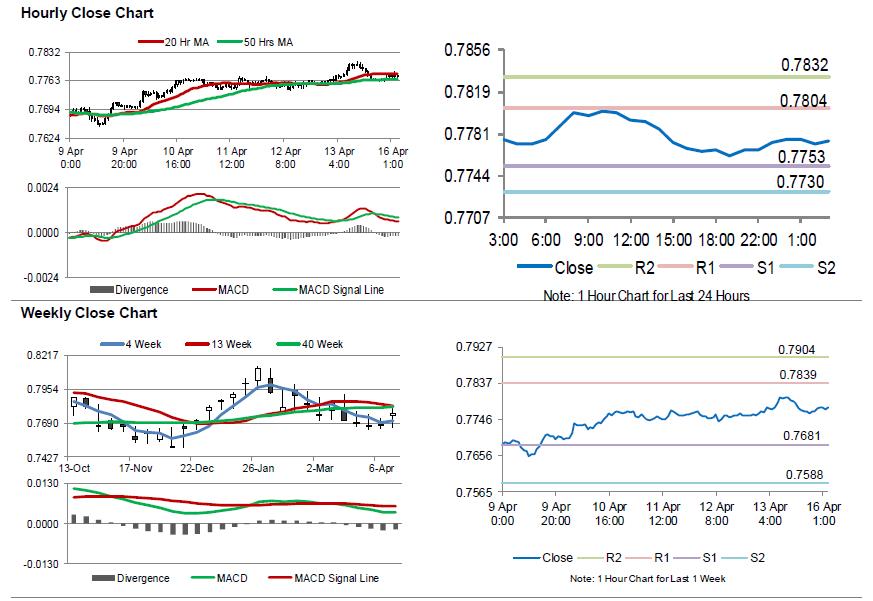
In the Asian session, at GMT0300, the pair is trading at 0.7775, with the AUD trading 0.10% higher against the USD from Friday’s close.
The pair is expected to find support at 0.7753, and a fall through could take it to the next support level of 0.773. The pair is expected to find its first resistance at 0.7804, and a rise through could take it to the next resistance level of 0.7832.
Moving ahead, investors would focus on the Reserve Bank of Australia’s (RBA) latest meeting minutes, set to release overnight.
The currency pair is trading between its 20 Hr and 50 Hr moving averages.
Euro-Zone’s Trade Surplus Surprisingly Widened In February
For the 24 hours to 23:00 GMT, the EUR rose 0.09% against the USD and closed at 1.2339 on Friday.
On the economic front, the Euro-zone's seasonally adjusted trade surplus unexpectedly widened to €21.0 billion in February, while investors had envisaged the region's trade surplus to remain steady at a revised level of €20.2 billion registered in the preceding month.
Separately, Germany's final consumer price index (CPI) grew 1.6% on an annual basis in March, confirming the preliminary print. The CPI had recorded an advance of 1.4% in the prior month.
The US Dollar fell against a basket of major currencies on Friday, after the US flash Reuters/Michigan consumer sentiment index fell to a 3-month low level of 97.8 in April, more than market expectations for a fall to a level of 100.4, as consumers fretted over the possible consequences of a heated global trade war on the US economy. The index had recorded a level of 101.4 in the prior month. Moreover, the nation's JOLTs job openings declined less-than-anticipated to a level of 6052.0K in February, compared to a revised level of 6228.0K registered in the previous month. Market participants had expected job openings to fall to a level of 6024.0K.
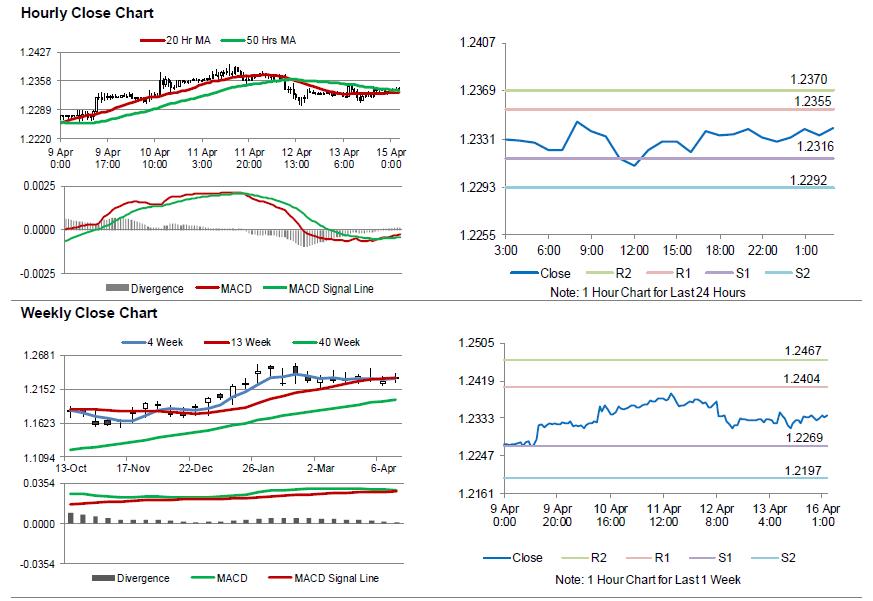
In the Asian session, at GMT0300, the pair is trading at 1.2340, with the EUR trading slightly higher against the USD from Friday's close.
The pair is expected to find support at 1.2316, and a fall through could take it to the next support level of 1.2292. The pair is expected to find its first resistance at 1.2355, and a rise through could take it to the next resistance level of 1.2370.
Amid a lack of key macroeconomic releases in the Euro-zone today, investors will direct their attention to the US retail sales for March, NAHB housing market index for April and business inventories data for February, all due to release later in the day.
The currency pair is showing convergence with its 20 Hr and 50 Hr moving averages.
Britain’s Rightmove House Prices Advanced In April
For the 24 hours to 23:00 GMT, the GBP rose 0.11% against the USD and closed at 1.4246 on Friday.
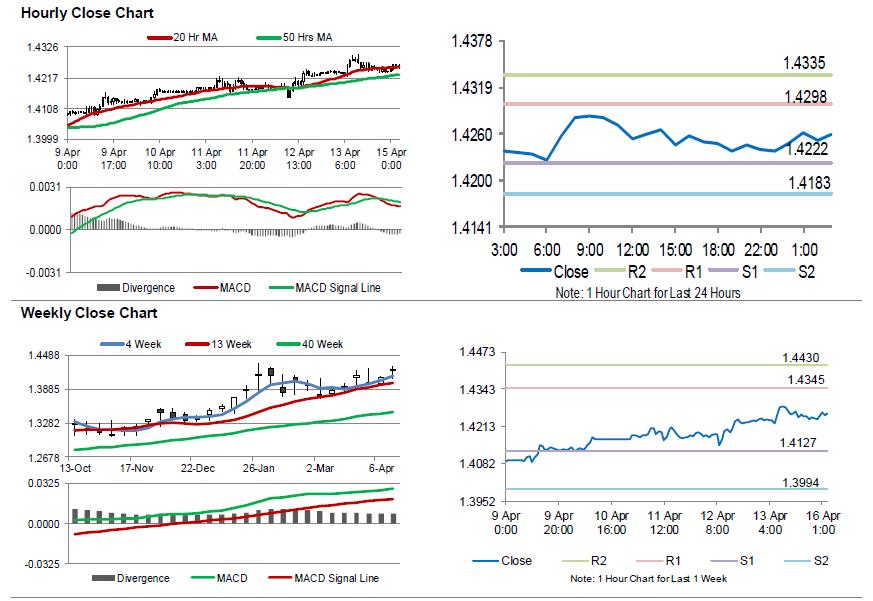
In the Asian session, at GMT0300, the pair is trading at 1.4260, with the GBP trading 0.1% higher against the USD from Friday's close.
Overnight data revealed that UK's Rightmove house price index climbed 0.4% on a monthly basis in April, after registering a rise of 1.5% in the previous month.
The pair is expected to find support at 1.4222, and a fall through could take it to the next support level of 1.4183. The pair is expected to find its first resistance at 1.4298, and a rise through could take it to the next resistance level of 1.4335.
The currency pair is showing convergence with its 20 Hr moving average and trading above its 50 Hr moving average.
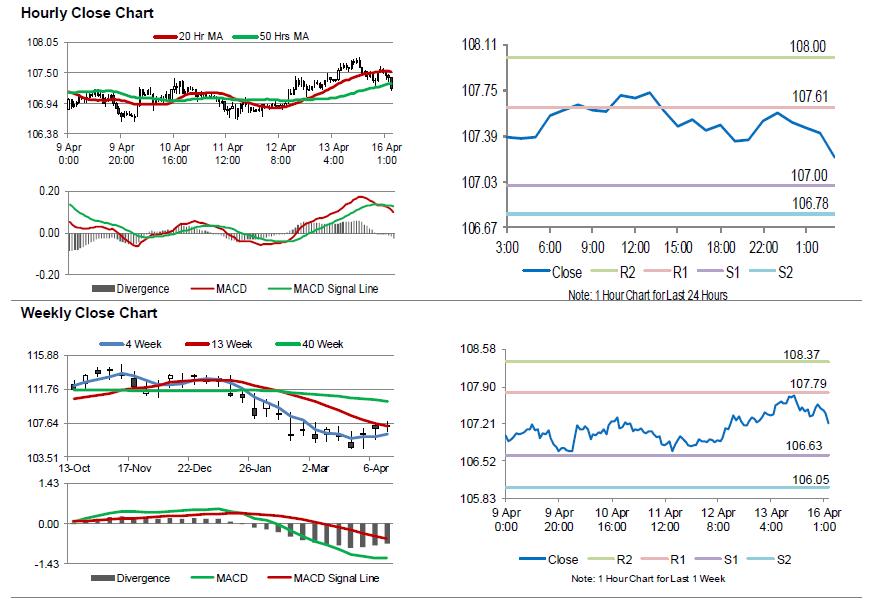
Japanese Yen Trading Higher In The Asian Session
For the 24 hours to 23:00 GMT, the USD rose 0.12% against the JPY and closed at 107.36 on Friday.
In the Asian session, at GMT0300, the pair is trading at 107.22, with the USD trading 0.13% lower against the JPY from Friday’s close.
The pair is expected to find support at 107.00, and a fall through could take it to the next support level of 106.78. The pair is expected to find its first resistance at 107.61, and a rise through could take it to the next resistance level of 108.00.
Going ahead, traders will keep a close watch on Japan’s final industrial production data for February, slated to release tomorrow.
The currency pair is trading below its 20 Hr and 50 Hr moving averages.