Sample Category Title
Singaporean Central Bank Turns Hawkish on Upward Core Inflation Pressure
The Monetary Authority of Singapore* (MAS) last Friday announced to increase the slope of the Singaporean dollar nominal effective exchange rate (SGD NEER) policy band “slightly”, the first adjustment since the policy tool was reduced to 0% in April 2016. As usual, the central bank did not disclose how much the adjustment is, although a +0.5% slope increase per annum is the widely-expected figure. The central bank, however, left the “width of the policy band and the level at which it is centered”. The tilt to a more hawkish monetary stance was driven by improvement in the inflation outlook, although US-China trade tensions have imposed uncertainty to the economic outlook. After all, the MAS remained upbeat, expecting the real GDP to expand slightly above the mid-point of the 1.5-3.5% forecast range.
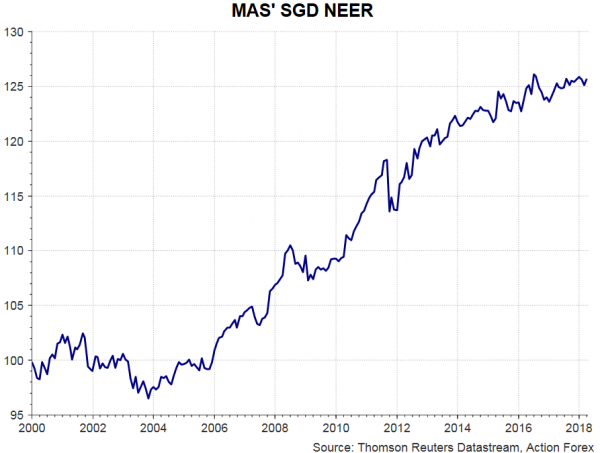 The accompanying statement showed that MAS turned more hawkish at the April meeting. It noted that “upward pressures on MAS core inflation are expected to persist over the course of this year and beyond, underpinned by an improving labor market”. Indeed, the central bank upgraded its assessment on core inflation, estimating that it should “come in within the upper half of the 1-2% forecast range”, compared with the expectations it would “stay in the range of 1-2% in 2018" suggested in the Regional Economic Development Report released last month.
On employment, the central bank judged that “further improvements in resident employment should support a faster pace of wage growth in 2018 compared to 2017”. Expectations of acceleration in wage growth underpinned MAS’ improved inflation outlook.
Policymakers forecast GDP growth to come in “slightly above the middle of the forecast range of 1.5–3.5%” this year. However, they cautioned that “rising trade tensions between the major economies pose a downside risk to the growth outlook”. Separately, the preliminary reading for the country’s real GDP grew +4.3% y/y in 1Q18, up from +3.6% in the prior quarter.
The announcement to increase the slope of its SGD NEER policy band “slightly” marks the first tightening of MAS’ exchange rate-based monetary policy in 6 years. The move might have the impacts of lifting Singapore’s interbank lending rates as well as Treasury yields. Last week, Goldman Sachs reinstated its trade recommendation of paying HKD rates and receiving SGD rates due to weakness in HK dollar. The widening of spread between HIBOR and SIBOR, as a result of MAS’ move, probably reinforced this conviction.
*The MAS adopts an “exchange rate-centered” monetary policy, rather than money supply or interest rates, as the principal tool of monetary policy. The central bank adjusts its monetary policy via adjusting the slope of policy band and the width of policy band, as well as re-centering the level of the policy band. The exchange rate (Singaporean dollar) is managed against a trade-weighted basket of currencies of the country’s major trading partners and competitors. The trade-weighted Singaporean dollar is allowed to float within an undisclosed policy band, which is adjustable and allowed to “crawl”. The authority has never disclosed the components in the currency basket nor the weights of each component.
Risk Trades Supported As Geopolitical Concerns Fade, US Retail Sales In The Spotlight
Here are the latest developments in global markets:
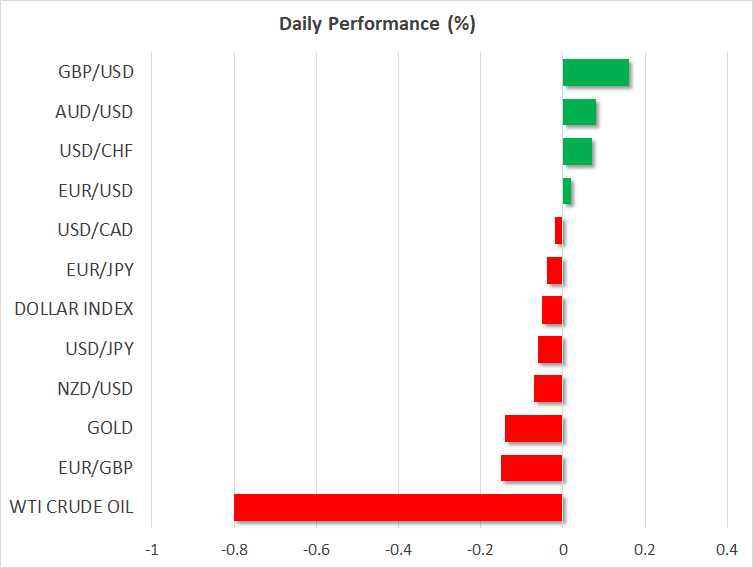
FOREX: The US dollar traded lower on Monday, but by less than 0.1%, showing little response to the US military strike on Syria over the weekend.
STOCKS: US markets closed lower on Friday, though they appear set for a recovery today. The Dow Jones and the Nasdaq Composite both fell by 0.5%, while the S&P 500 shed 0.3% of its value. That said, futures tracking the Dow, S&P, and Nasdaq 100 are currently pointing to a higher open today, despite news over the weekend that the US had bombed Syria. The positive sentiment is likely owed to speculation that the strike was a surgical, isolated incident, and that things will calm down from here. In Asia, Japanese markets were higher, with the Nikkei 225 and the Topix climbing by 0.26% and 0.40% respectively. In Hong Kong though, the Hang Seng tumbled by 1.6%. Meanwhile in Europe, futures tracking all the major indices were flashing green.
COMMODITIES: Oil prices fell on Monday amid signs the conflict in Syria won't lead to a US-Russia confrontation, helping to ease concerns of supply disruptions elsewhere in the Middle East. WTI and Brent declined by 0.8% and 0.9% respectively. Should the situation in Syria indeed calm down, oil prices could remain under pressure as geopolitical risk is priced out and investors turn their sights back on US production. In this respect, the Baker Hughes rig count on Friday showed another sharp increase in active oil rigs, enhancing the narrative that US supply continues to soar. In precious metals, gold traded lower by nearly 0.2% despite the strike on Syria. The broader calmness displayed by investors is likely owed to speculation that a US-Russia face-off over Syria will be averted.
Major movers: Markets shrug off airstrike in Syria as escalation appears unlikely
The US, the UK and France launched missiles against chemical weapons facilities in Syria on Saturday, as US President Trump had hinted recently. Interestingly though, the market response was very limited as traders returned to their desks on Monday. Safe havens were mixed, with the yen trading marginally higher, but gold being 0.2% lower. Meanwhile, US stock futures were flashing green, suggesting the major indices could open higher today, showing no signs of geopolitical stress.
The muted reaction is probably owed to expectations the situation won't escalate any further. Recall that last week, the risk-off market moves occurred after Russia said it will shoot down any US missiles fired at Syria, generating concerns of a US-Russia military standoff. However, once the strike was over on Sunday, both the US and the UK send clear signals this was a 'one and done' attack, and not the beginning of a prolonged operation, easing fears of an imminent conflict with Russia. US President Trump tweeted 'Mission accomplished', while UK Foreign Secretary Boris Johnson said his nation is not seeking escalation, and that the mission's purpose was to 'send a message'.
Even though things appear somewhat rosy at the moment, risk sentiment is not 'out of the woods' just yet. Russia has yet to respond to the Syrian strike, while the US Treasury is reportedly preparing to unveil new sanctions against Moscow today. More importantly, the US-China trade spat may be set to get a new chapter. Recent media reports suggest the White House will unveil a fresh round of tariffs against China this week. If so, China will most likely hit back with its own countermeasures, perhaps triggering another wave of risk aversion over the next days. Even if that is the case though, the broader narrative that the situation may be finally resolved through talks would not necessarily be derailed.
Elsewhere, moves in the FX market were fairly muted. Both the euro and the pound were marginally higher against the US dollar. Meanwhile, the antipodeans were mixed, with aussie/dollar being 0.1% higher, but kiwi/dollar nearly 0.1% lower.
Day ahead: US retail sales in focus; Syria conflict and possible trade developments also eyed
Some US data will dominate Monday's economic calendar, with retail sales being considered as the most important release of the day.
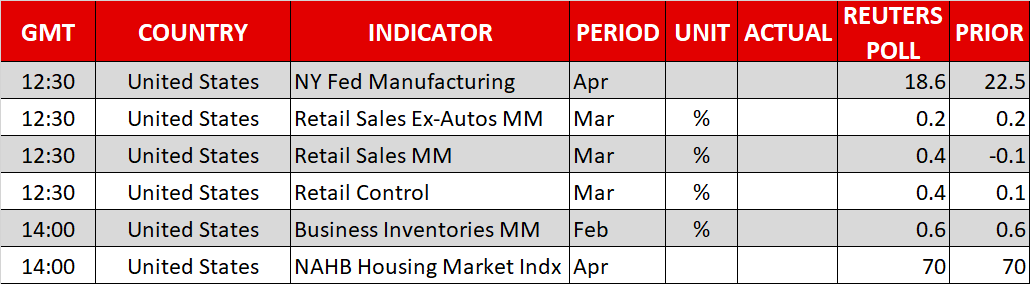
At 1230 GMT, retail sales data for the month of March out of the world's largest economy will be made public. After three straight months of monthly declines, retail sales are projected to reflect positive growth in March, specifically to expand by 0.4% m/m. Consumption was an area of concern for Fed policymakers – this was evident in the official record of March's meeting released last week – and it will be interesting to see whether today's figures alleviate some of those worries. Core retail sales, which exclude items such as automobiles and are more closely aligned with the consumer spending component of GDP, will also be watched.
At the same time as retail sales numbers (1230 GMT), the US will see the release of April's New York Fed manufacturing index as well as data on retail control for March. Afterwards (1400 GMT), February's business inventories and April's NAHB housing market index will be made public as well.
In equites, Bank of America and Netflix are among those corporations releasing quarterly results on Monday. Overall sentiment in stock markets could also be driven by developments on global trade, as well as the conflict in Syria – these being factors that undoubtedly have the capacity to lead to positioning in currency markets as well.
A slew of Fed speakers will be making appearances this week. Starting today, at 1400 GMT, Dallas Fed President Robert Kaplan will be participating in a Q&A session, while Minneapolis Fed President Neel Kashkari will be delivering remarks on 'Too Big To Fail' financial institutions; neither holds voting rights within the FOMC this year. Atlanta Fed President Raphael Bostic will be talking on the US economy and rural market trends at 1715 GMT. He is a voting member within the FOMC in 2018.
Technical Analysis: USDJPY retreats from 2-month high, looking mostly bearish in very short-term
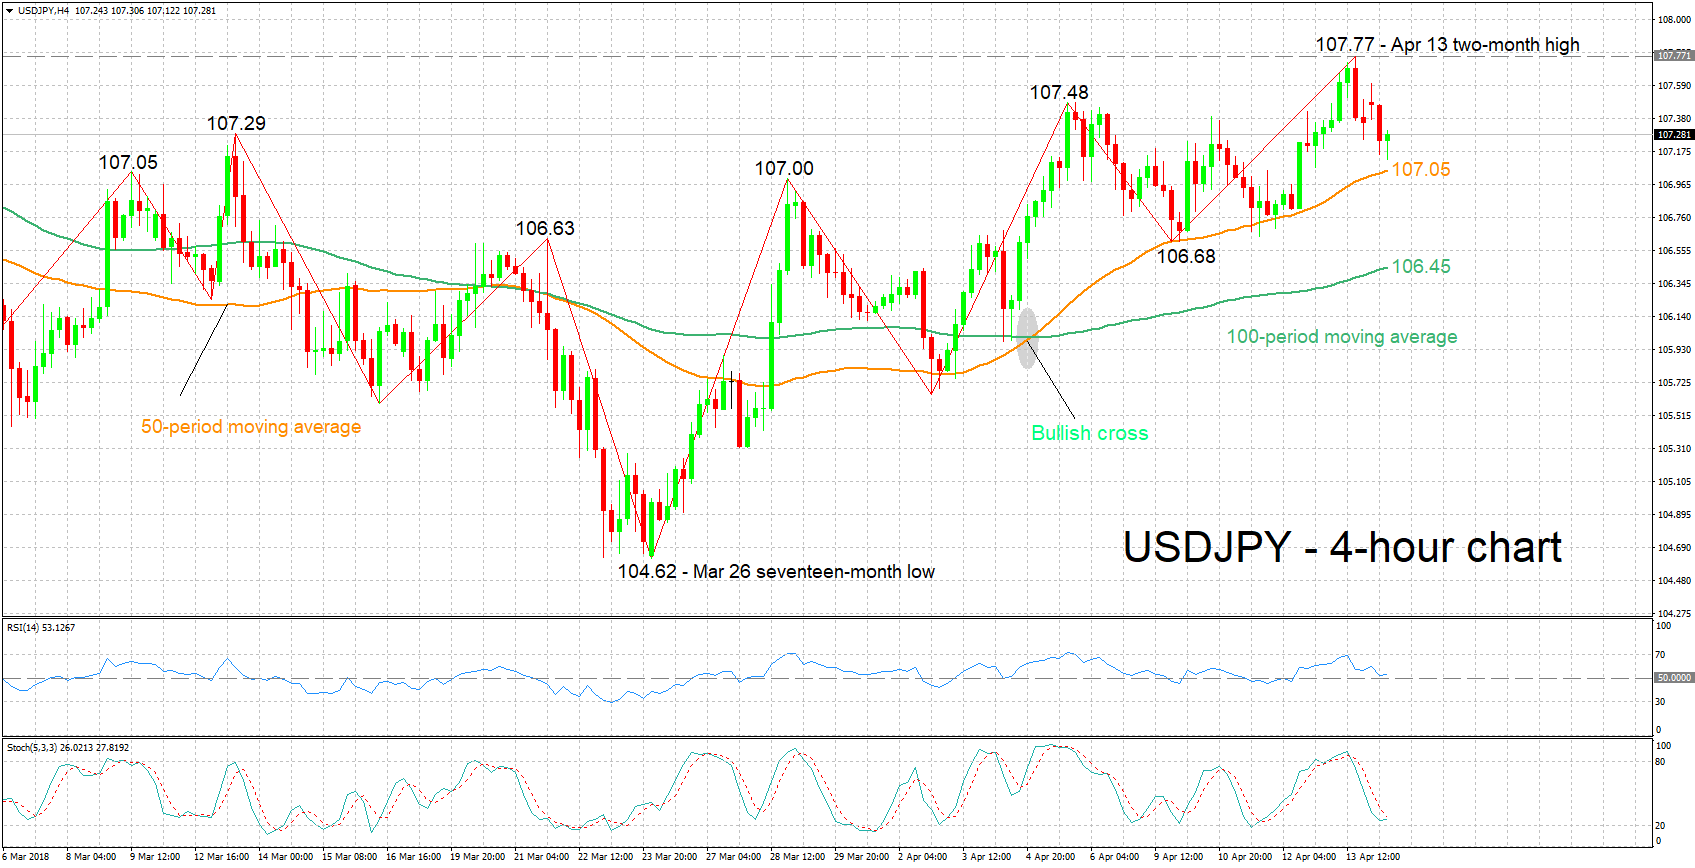
USDJPY has fallen after reaching a two-month high of 107.77 on Friday. The RSI, which gauges the short-term bias, has reversed course, heading lower after coming close to overbought territory. The stochastics are giving a mostly bearish picture in the very short-term, with the %K line below the slow %D line. However, the %K seems to be halting its decline; this could be an early sign of changing momentum in the very short-term.
Better-than-expected US retail sales data could boost USDJPY, with resistance to advances potentially coming around last week’s two-month high of 107.77 – the area around this also includes the 108 round figure. Notice that a couple of peaks from the recent past lie below 107.77 – one at 107.29 and the other at 107.48 – which could also act as barriers to gains.
Weaker-than-anticipated figures out of the US might lead to declines in USDJPY. Support in this case might come around the current level of the 50-day moving average at 107.05, which also encapsulates the 107 handle.
Rising geopolitical and/or trade uncertainty can also affect the pair, particularly pushing it lower. The opposite holds true as well.
EURUSD Analysis: Tests 1.2340 Area
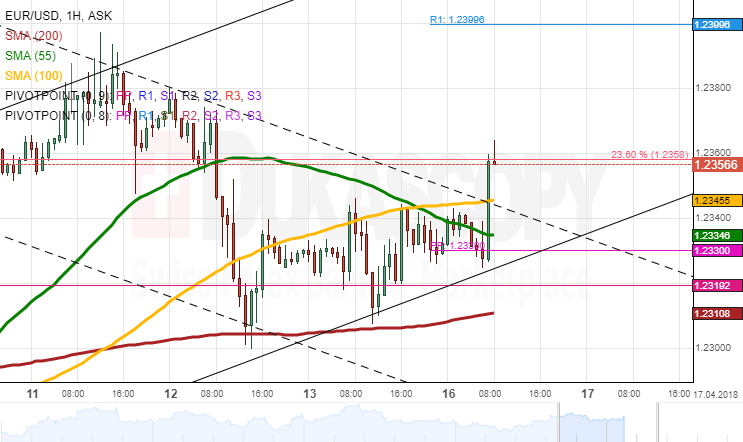
The Euro was trading along the 100-hour SMA on Friday, with the 200-hour moving average working as a strong support. Being stranded by these two barriers, the pair failed to gain momentum and thus ended the session with no change to its positioning.
The general tendency continues to be northwards; thus, a surge is likely to follow if the Euro surpasses the 55– and 100-hour SMAs at 1.2340. Technical indicators are likewise bullish for this session. A breakout is expected to occur during the second part of the day. The upside target is the weekly R1 at 1.24, while the senior channel is likewise located nearby.
In case the bearish sentiment prevails, the rate should breach the 200-hour SMA and a two-week channel up. As a result, the Euro should be sent towards the weekly S1 at 1.2260.
GBPUSD Analysis: Targets Post-Brexit High
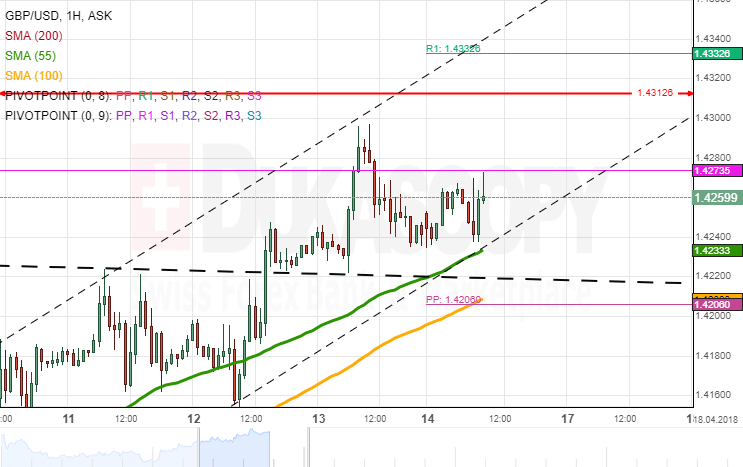
The Sterling remained steady against the US Dollar on Friday except for a slight 54-pip surge early in the day. These gains, however, were already erased within the following hours.
On Monday, the pair was still lingering slightly below its post-Brexit high of 1.4213. Thus, it is likely that the pair tests this mark or edges even higher towards the weekly R1 or R2 at 1.4233 and 1.4424, respectively, in this session, as the combined support of the 55– and 100-hour SMAs could guide the Pound and limit a fall below 1.42. In addition, another bullish signal is provided by the dashed trend-line which was breached on Thursday.
Meanwhile, a fall below the 1.42 mark should continue until the 200-hour SMA and the weekly S1 near 1.4150 are reached. In terms of fundamentals, the US is to release its Retail Sales at 1230GMT.
USDJPY Analysis: Likely To Respect Trend-Line
The US Dollar continued to appreciate against the Yen for the second consecutive session on Friday. Despite this upside movement, the pair was generally trading sideways in the 107.20/80 range.
Downside risks prevailed during the Asia session which pushed the rate down to the 55-, 100– and 200-hour SMAs and the weekly PP circa 107.20. The bottom boundary of a four-week channel is likewise located there. The Greenback should eventually breach this channel to the downside and test the 106.70 area, as it has not been able to surpass 107.65 for several sessions.
However, technical indicators suggest that a breakout of the aforementioned support cluster should not occur today. In this case, a possible upside target is the weekly R2 at 108.00.

XAUUSD Analysis: Could Re-Test Senior Channel
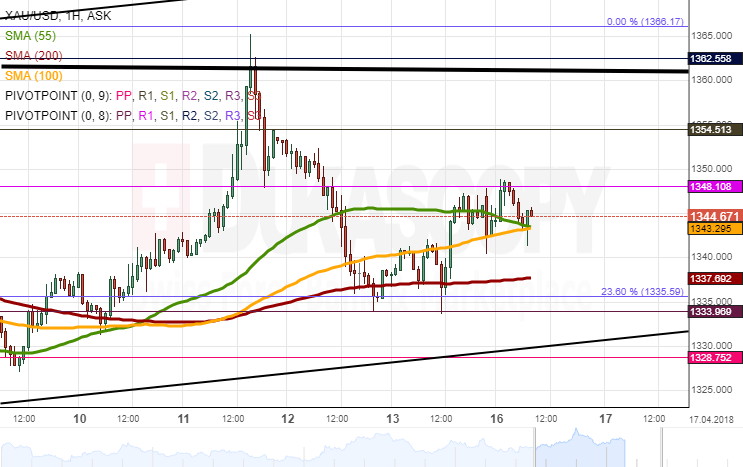
XAU/USD did not introduce massive changes to its positioning during the previous session, as its movement was stranded by the 55-, 100– and 200-hour SMAs.
By Monday morning, the pair had already surpassed all this levels and was seemingly set for a surge. The nearest resistance is the monthly R1 and the senior channel at 1,354.00 and 1,360.00, respectively. In case the pair is driven by strong upside momentum, the yellow metal should not edge above the 2017/2018 high of 1,366.17.
By and large, Gold has diminished its trading range in a seven-week ascending channel. This might be an early indication of a breakout south. This bearish movement also corresponds with the senior channel. In terms of today, Gold should not fall below the 1,330.00 mark.
EUR/NZD 1D Chart: Pair Meets Long Term Support
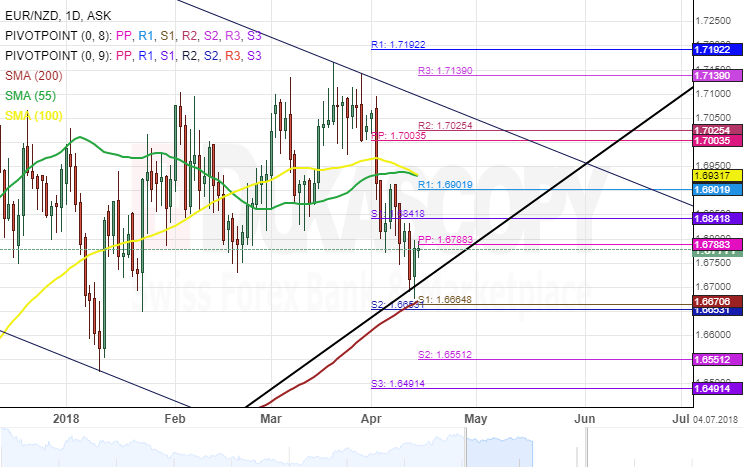
There is a new large scale development to be noted about the daily chart of the EUR/NZD currency exchange rate.
The pair has met the support of a massive scale long term channel up pattern. Moreover, it has made the initial rebound against the support.
Due to that reason it can be expected that the pair will begin a long term ascent. However, that might not be possible, as the pattern, which is considered at the moment junior to the most dominant channel up, has very similar width like the dominant one.
Watch the trend line and various resistance levels closely, as a break below the 1.6660 mark might signal a long term descent. In addition that would begin with a drop down to the 1.6550 level.
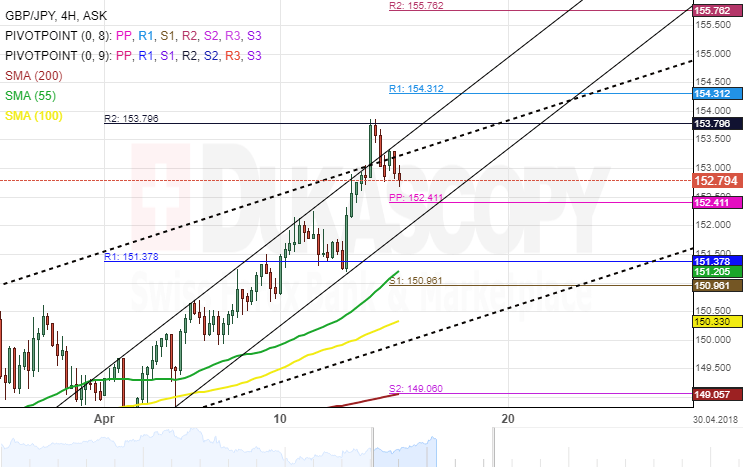
GBP/JPY 4H Chart: Patterns Get Broken
During the recent surge of the Pound against the Japanese Yen more patterns were broken. Namely, two ascending channels of various importance have been broken to the upside at the point of the crossroads of their resistance lines.
However, the break out was stopped by the resistance of the monthly R2 at the 153.80 mark. Moreover, since then the pair has declined, as it approaches the support of the weekly PP at the 152.41 level.
In regards to the future, it is imperative to watch the pair's movements near pivot points and SMAs in an order the spot the next pattern, which could be taken advantage of.
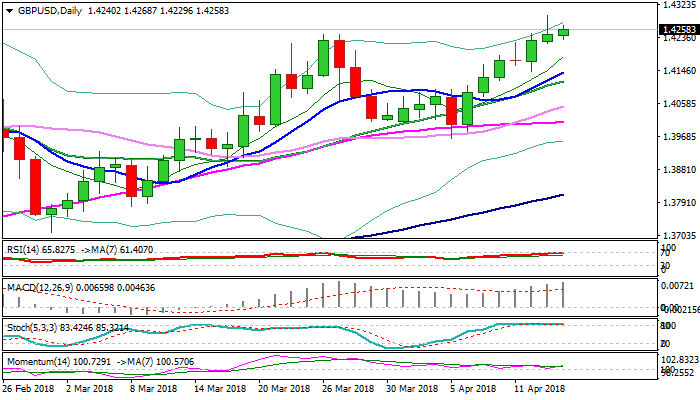
GBPUSD Holds Firm Tone In Early Monday’s Trading And Ignores Negative Signal From Friday’s Shooting sStar
Cable is standing at the front foot in the early European trading despite upside rejection at 1.4268 (session high).
Overall structure remains bullish and keeps target at 1.4300 in focus, after key near-term barrier at 1.4244 (27/26 Mar highs) was cracked on Friday's spike to 1.4296.
Friday's strong upside rejection which ended in Shooting star reversal patter, so far did not show stronger impact on bulls, but requires caution.
Stronger bearish signal could be expected on close below 1.4220 (Friday's low) which would validate the pattern and generate stronger bearish signal.
Overbought slow stochastic on daily chart supports scenario, however, bullish setup of daily MA's and firming momentum studies, offset negative signals for now.
Bulls need break and close above psychological 1.4300 barrier to neutralize downside risk and open way for test of key med-term barrier at 1.4244 (25 Jan post-Brexit recovery high).
Meanwhile, the pair may hold in extended consolidation, with downside remaining at risk, while bearish scenario on close below 1.4220 would open way for deeper pullback and expose supports at 1.4170 (Fibo 38.2% of 1.3965/1.4296) and 1.4141 (rising 10SMA).
Res: 1.4268; 1.4277; 1.4300; 1.4345
Sup: 1.4230; 1.4200; 1.4170; 1.4141
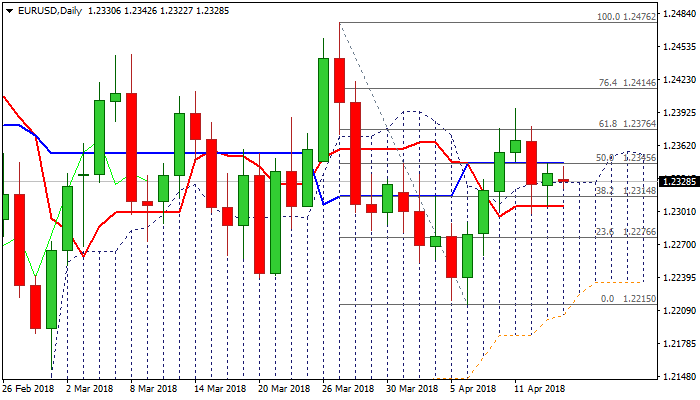
EURUSD – Daily Cloud/10SMA Hold For Now But The Downside Remains Vulnerable
The Euro traded within tight range in Asia on Monday, showing no significant reaction on US strikes on Syria over the weekend.
The EURUSD pair maintains bullish bias at the beginning of the week, despite last week’s pullback to 1.2299, as repeated downside attempts were contained by 10SMA and repeatedly closed above thick daily cloud which continues to underpin.
Near-term action is in consolidative mode above the cloud top (1.2327), also Fibo 38.2% of 1.2215/1.2396 upleg and supported by rising 10SMA (1.2310), however, weak momentum studies keep in in play risk of fresh attacks at clout top / 10 SMA supports.
Clear break here would be bearish signal for further retracement of 1.2215/1.2396 upleg.
Close above 55SMA (1.2335) will be initial bullish signal, but regain of 1.2377 (tops of 12/10 Apr / Fibo 61.8% of 1.2476/1.2215 descend) is needed to neutralize bearish threats.
Res: 1.2335, 1.2345, 1.2377, 1.2400
Sup: 1.2327, 1.2310, 1.2299, 1.2284