Sample Category Title
Euro Steady To Start Week, US Retail Sales Next
EUR/USD has posted slight gains in the Monday session. Currently, the pair is trading at 1.2360, up 0.23% on the day. On the release front, there is only one eurozone event. The German Wholesale Price Index improved to 0.0%, but fell short of the estimate of 0.4%. In the US, the key indicators are retail sales reports. Retail Sales are expected to improve to 0.4%, after two straight declines. Core Retail Sales is forecast to remain unchanged at 0.2%. On Tuesday, German releases ZEW Economic Sentiment, and the US will publish Building Permits and Housing Starts.
It was a dramatic weekend, as a US-led strike destroyed several chemical installations in Syria. Predictably, Syria and Russia strongly condemned the attack, but are unlikely to retaliate despite the rhetoric. The markets had already priced in an attack, and are hopeful that Trump’s declaration of “mission accomplished” means that things will remain relatively quiet in Syria. However, further chemical attacks by the Syrian regime could trigger a response from the US and its allies, which could result in volatility in the markets, similar to what occurred last week.
US consumer numbers ended the week on a disappointing note, as UoM Consumer Sentiment dropped to 97.2, down from 102.0 a month earlier. The reading missed the estimate of 100.6, and marked a 3-month low. Still, with the economy continuing to perform low and unemployment at very low levels, the US consumer remains very optimistic.
The Federal Reserve minutes from the March meeting were hawkish in tone, reflective of a solid US economy. All of the Fed policymakers indicated that the US economy would continue to improve and that inflation would rise in the next few months. At the March meeting, the Fed unanimously voted to raise rates by a quarter-point, bringing the benchmark rate to a range between 1.50% and 1.75%. The Fed projection for rate policy in 2018 remains at three hikes, although there is speculation that the Fed could revise the forecast to four rate hikes. Last week, Fed Chair Jerome Powell said that the Fed would likely continue to raise rates in order to keep a lid on inflation, but added that the rate moves would be gradual. A new headache for the Fed is the escalating trade battle between the US and China, which could hurt the economy and raise consumer prices. The Fed is expected to sit maintain rates at the May policy meeting and raise rates by a quarter-point in June.
GBPUSD heading to 1.4345 as buying emerges
Strong buying emerges in GBP as it surges across the board just now. In particular GBP/USD has taken out last week's high at 1.4295 and is on track to 1.4345 resistance (2018 high).
 Looking at GBP action bias table, bullishness in the GBP is consistently against all other major currency In particular, GBPUSD is on upside bias across time frame.
 The GBPUSD D action bias chart also supports that' it's heading to 1.4345 and above.
Forex Analysis: USDCAD And EURGBP
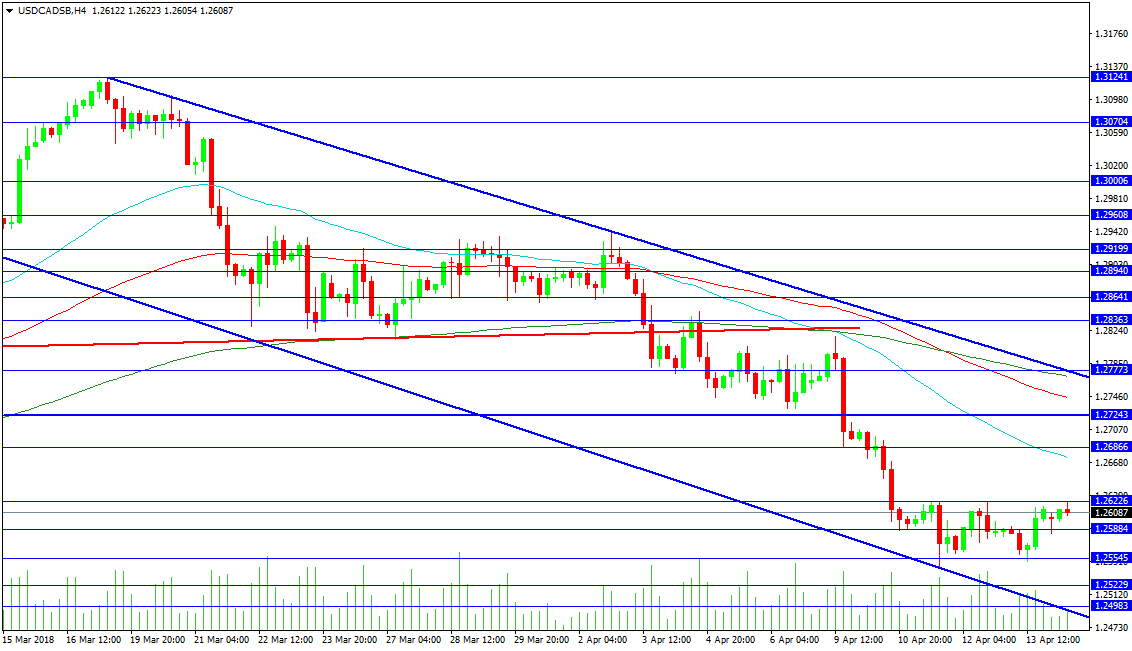
USDCAD is once again testing the 1.26226 level today. This level provides traders with a very interesting decision. Will price break out higher from here or respect the level and fall back lower again? A break higher is supported by the creation of higher lows since the middle of last week, and the 50-period MA at 1.26743 represents the first target for longs. A short squeeze would take traders to the 1.27243 area, with the 100-period MA at 1.27449 and the 200-period MA at 1.27704. The 1.27773 level contains the falling blue trend line, with a break above targeting 1.29000 and 1.29420, with 1.30000 above. The highs at 1.31241 are a target for longer timeframe traders.
The short side is supported by 1.25884 and 1.25545. A loss of this area would target the low of last week at 1.25432, with the 1.25000 level below. A test of the blue supporting trend line at 1.24872 could find buyers. However, weakness could see 1.24000 tested, with rising support at 1.23545.
EURGBP
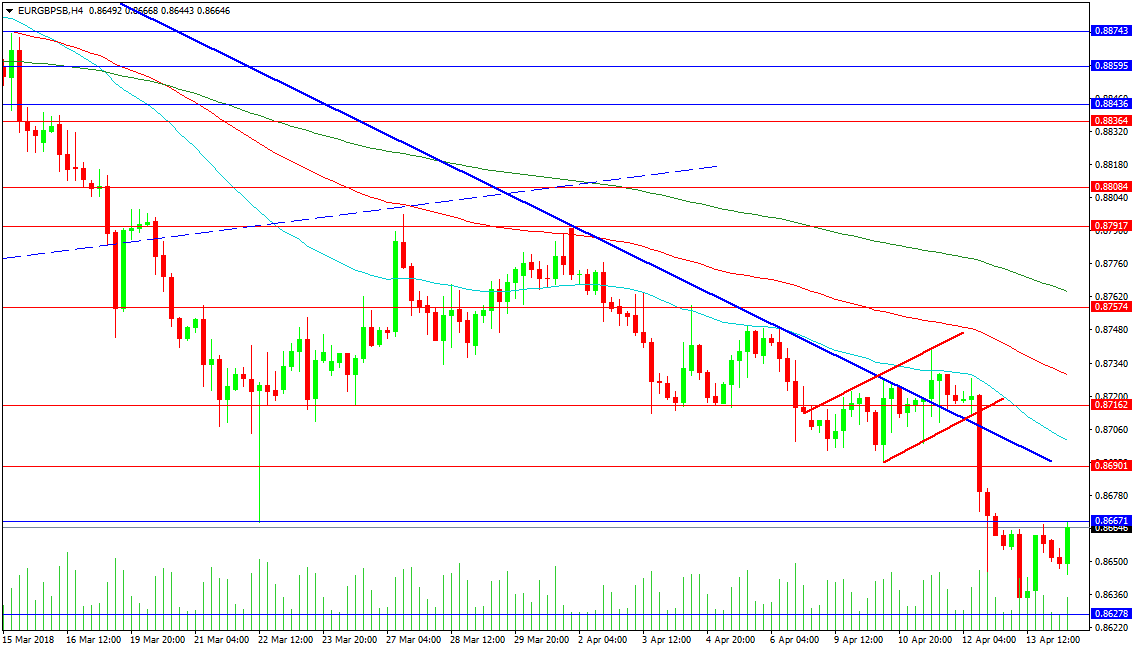
This pair has found new lows, breaking under the low from late March at 0.86671 (after triggering shorted based on the bear flag pattern), which has been retested today as resistance. Further support can be seen at Friday’s low of 0.86278, with a loss of this level targeting 0.86000. Support below comes in at 0.85400 and the 0.85000 level.
Resistance can be seen at the 0.86900 level and the falling blue trend line. The 50-period MA is located at 0.87015, with the 0.87162 level above. The 100-period MA comes in at 0.87291, with the 200-period MA falling through 0.87645 on its way to the 0.87574 level. There is a considerable area of resistance around 0.88000 that was observed during March and this area can once again have an impact on price should it be reached.
WTI OIL Eases On Lowered Tension Over Syria/Overbought Studies
Oil price fell over 1% on Monday on growing signs that weekend air strikes on Syria were unlikely to escalate.
Rising geopolitical tensions sent oil price to the highest levels in over three years at $67.74 last week, which resulted in strongest weekly rally since late Nov 2016.
Bulls are taking a breather as tensions over Syria ease, with overbought conditions signaling that corrective action may extend.
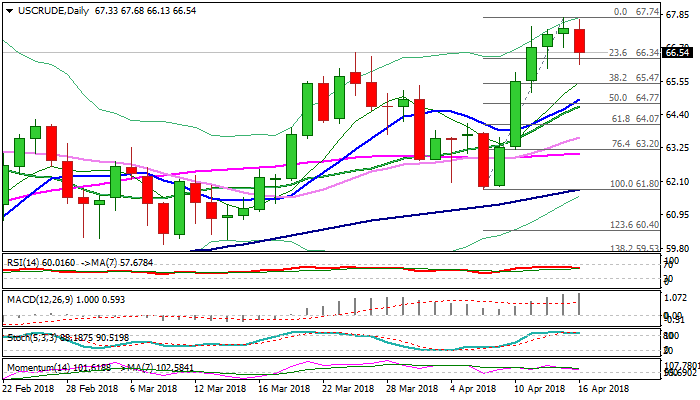
Pullback from new high at $64.74 cracked initial support at $66.34 (Fibo 23.6% of $61.80/$67.74 rally) and approached round-figure support at $66.00 on Monday.
The price could dip further on bearish signal from south-turning daily RSI and strongly overbought slow stochastic which turns lower.
In addition, easing fears of stronger conflict in the Middle East and increasing US drilling activities weigh and keep oil price at the back foot.
Monday’s close in red would be initial negative signal for deeper pullback which could extend towards next strong support at $65.47 (Fibo 38.2% of $61.80/$67.74 rally).
Overall structure remains firmly bullish and sees current correction as positioning for fresh upside, as bulls eye psychological $70 barrier.
Such scenario favors limited corrective action, with extended dips to be contained above $65.47 support to keep bulls intact.
Conversely, bulls might be delayed further on break below $65.47 Fibo support and violation of rising 10SMA ($64.93).
Res: 66.64, 67.00, 67.74, 68.63
Sup: 66.43, 66.00, 65.47, 64.93
BoJ Wakatabe: Maintaining currency policy could heighten inflation expectations
BoJ Deputy Governor Masazumi Wakatabe urged patience in maintaining ultra loose monetary policy. He repeated that "inflation has yet to reach our 2 percent target" even though price growth is on an "upward trend". And by "patiently maintaining our current policy", BoJ could "heighten inflation expectations".
Waktatabe is not concerned with falling behind the curve as "even if for some reason inflation accelerates rapidly, we have the tools to deal with it."
Though, he noted that "the merits and demerits of the BOJ's monetary policy change over time." And he added that BoJ needs to be "mindful of the danger, or risk, a prolonged low-interest rate environment would weigh on bank profits and that such impact could accumulate."
Separately, the Japan Cabinet Office maintained the assessment that the economy is "recovering at a moderate pace".
Elliott Wave Analysis: DAX, S&P500 And Nasdaq100
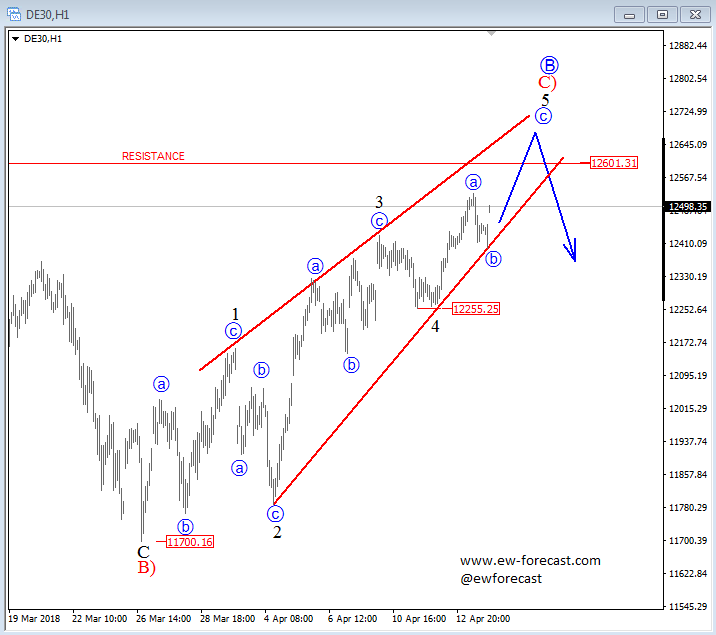
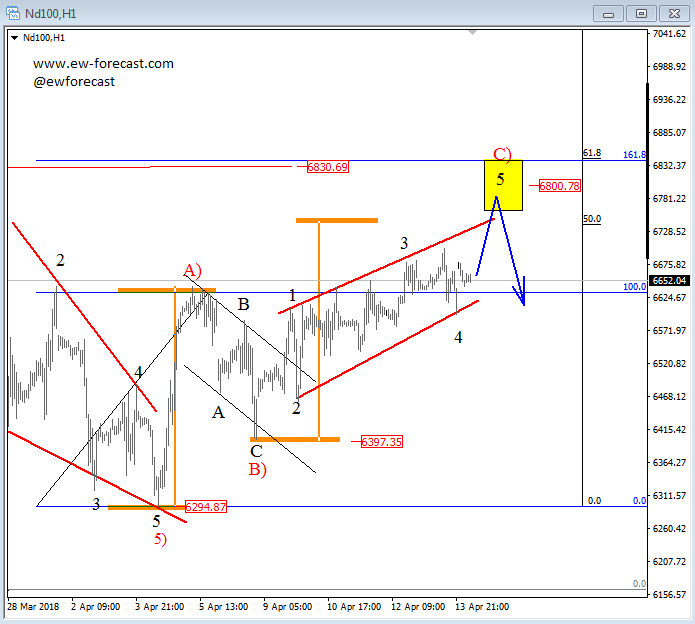
US attacked Syria on Friday, a few hours after the US close, which I firstly through it will hurt the markets, so I expected gaps lower but it appears that markets do not care much at the moment. However, there is still big risk because of Russia and US conflict, that can send stocks down. Technically speaking, we see SP500, NASDAQ100 and even DAX in late stages of a current bullish run.
On Dax we are looking at an ending diagonal that can stop at 12600, while NASDAQ100 and SP500 have resistance at 6800 and 2700.
German dax, 1h
Nasdaq, 1h
S&P500, 1h
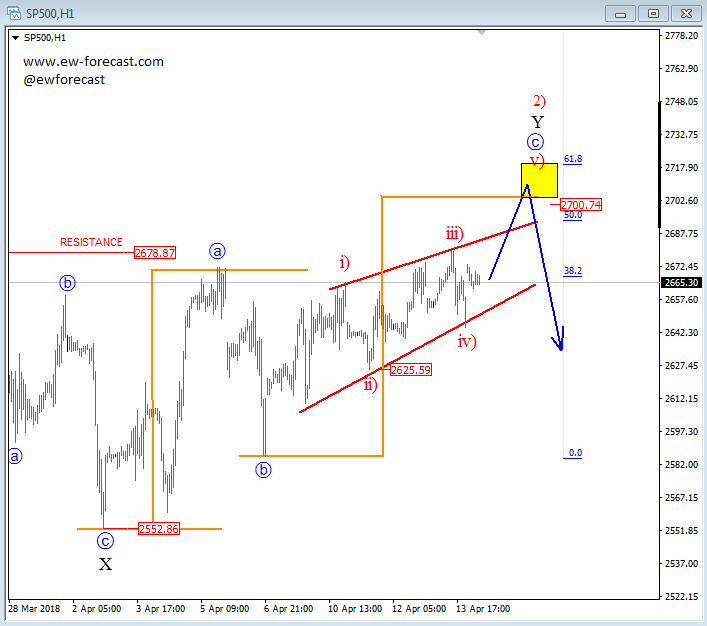
If these observations play out as expected, then stocks can face a nice bearish reversal in sessions to follow, also xxx/jpy pairs, as they trade in positive correlations.
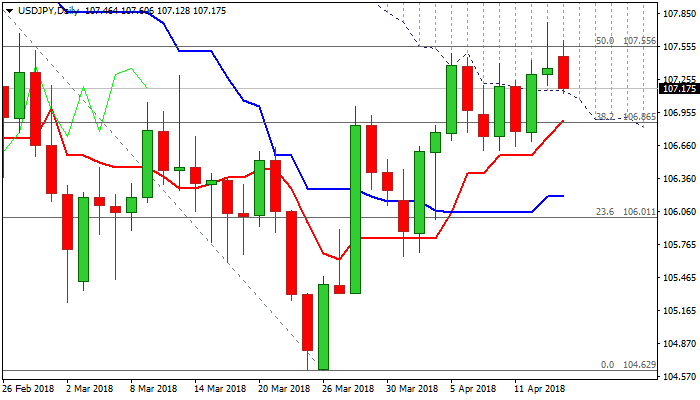
USDJPY – Bullish Bias Above Daily Cloud Base But Close Above Fibo Barrier At 107.56 Needed For Fresh Bullish...
The pair holds between daily cloud base (107.16) and cracked Fibo barrier at 107.56 (50% retracement of 110.48/104.63 bear-leg) on Monday, but keeping bullish bias while above cloud base.
Friday's upside rejection at 107.77 and failure to close above 107.56 barrier so far did not show stronger impact on bulls, as US attacks on Syria failed to trigger stronger safe-haven demand.
Bullish setup of daily techs is reinforced by formation of 10/55SMA bull cross at 107.00 today and remains supportive for further advance, however, close above 107.56 pivot is needed to generate bullish signal for extension towards next key barrier at 107.97 (Fibo 38.2% of 113.38/104.63 descend).
Conversely, near-term structure would weaken on close below cloud base, while return below 10/55SMA's would generate strong bearish signal for deeper pullback.
Res: 107.56, 107.97, 108.28, 108.77
Sup: 107.00, 106.65, 106.45, 106.20
NZD/USD Progressive Zig-Zag Uptrend
The NZD/USD has been in a steady uptrend with a progressive zig-zag pattern. At this point the price is within the POC zone 0.7337-0.7348 and we could see a spike towards 0.7386 with a potential for 0.7420. However if the price breaks below 0.7335 pay attention to POC2 0.7313-0.7325 as the POC2 is also a bouncing spot. Targets will remain the same. As long as W L4 holds -0.7280, bulls should be safe.
W L3 - Weekly Camarilla Pivot (Weekly Interim Support)
W H3 - Weekly Camarilla Pivot (Weekly Interim Resistance)
W H4 - Weekly Camarilla Pivot (Strong Weekly Resistance)
D H4 - Daily Camarilla Pivot (Very Strong Daily Resistance)
D L3 – Daily Camarilla Pivot (Daily Support)
D L4 – Daily H4 Camarilla (Very Strong Daily Support)
POC - Point Of Confluence (The zone where we expect price to react aka entry zone)
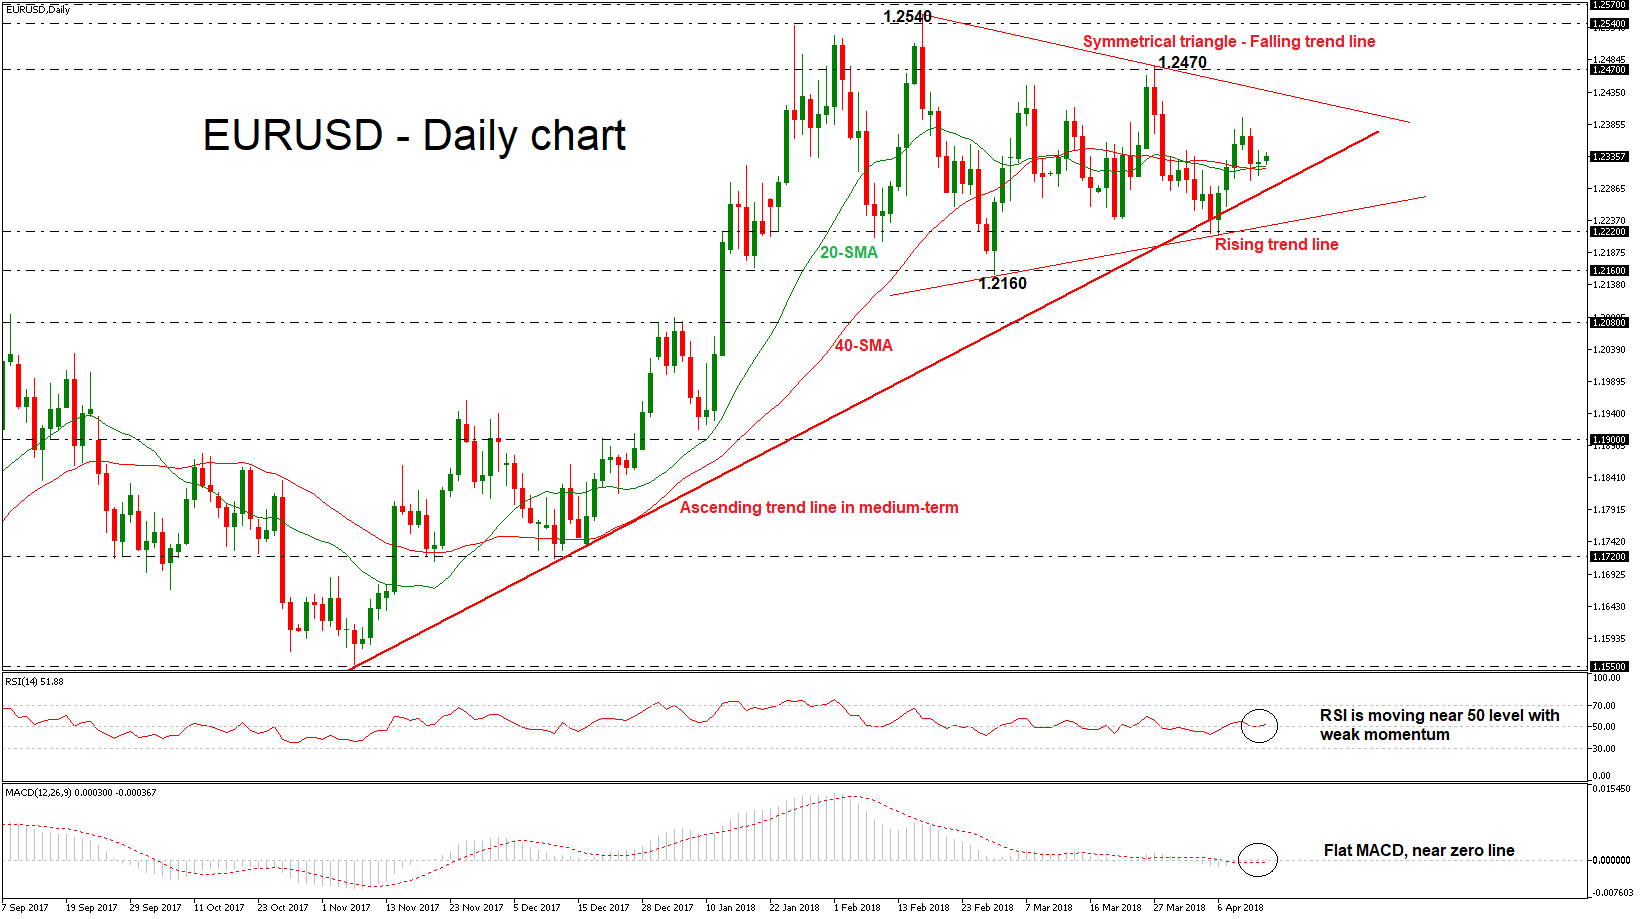
EURUSD Creates Symmetrical Triangle, Looking Neutral
EURUSD has been underperforming in the past two days, failing to extend its gains to the upside. The pair has been developing within a symmetrical triangle since February in the short- to medium-term timeframe, while the price lacks a clear trend. In the longer-term, the single currency has been developing in an ascending movement against the greenback over the last year.
Looking at the daily timeframe, prices are holding above the 20- and 40-simple moving average (SMA), which are flattening near the 1.2320 price level. The RSI indicator is holding slightly above the threshold of 50, while the MACD oscillator remains flat around the zero line. Both are moving with weak momentum.
Upsides moves are likely to find resistance at the descending trend line of the triangle formation near the 1.2430 barrier. A successful close above the aforementioned obstacle could shift the neutral short-term bias to bullish and push the price towards the 1.2470 resistance level. Breaking this level could see a re-test of the 1.2540 high, taken from the peak on January 25.
On the flip side, a move to the downside, below the 20- and 40-SMAs could see immediate support at the longer-term ascending trend line near the 1.2300 handle. A slip below this level could re-challenge the ascending diagonal line of the symmetrical triangle, which overlaps with the 1.2220 support level. Any strong violation of this point could increase chances for further losses probably until 1.2160.
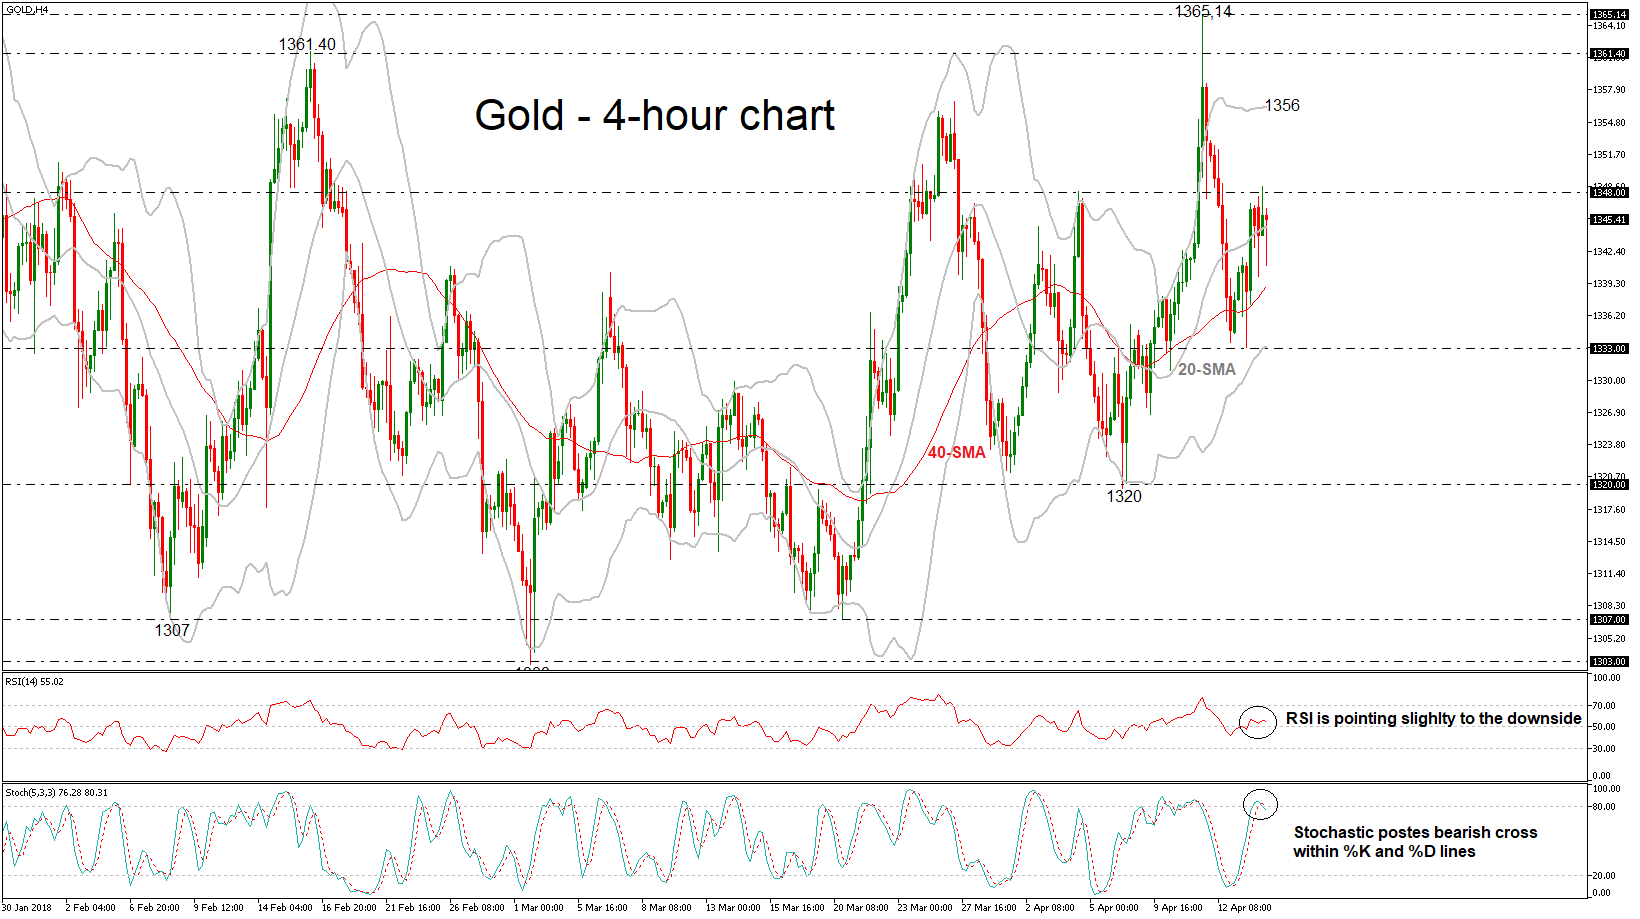
Gold In Neutral Bias Again After It Recorded 11-Month High Of 1365.14
Gold reached an eleven-month high of 1365.14 during the previous week, while at the end of the weekly session it retreated. The price has been trading within a trading range since January 25 with upper boundary the 1365 resistance level and lower boundary the 1307 support level.
From the technical point of view, in the 4-hour chart, the RSI indicator is sloping slightly to the downside in the positive territory, while the %K line of the stochastic oscillator posted a bearish cross with the %D line, suggesting an increase in the bearish mode. The price is moving above the mid-level of the Bollinger band (20-SMA) as well as above the 40-SMA.
In the wake of negative pressures, the market could meet support at 1333, which overlaps with the lower Bollinger band. A successful close below this level could see a retest of the previous low of 1320, taken from the bottom on April 6.
However, if prices are able to break the 1348 resistance level in the next few sessions, the risk would shift to the upside, with the upper Bollinger band coming into focus near the 1356 price level. A drop above would signal a resumption of the upward rally until the 1361.40 barrier.