
Sample Category Title
Crude Oil: Oil Reverses Its Gains, Ahead Of Baker Hughes Weekly Rig Count Data
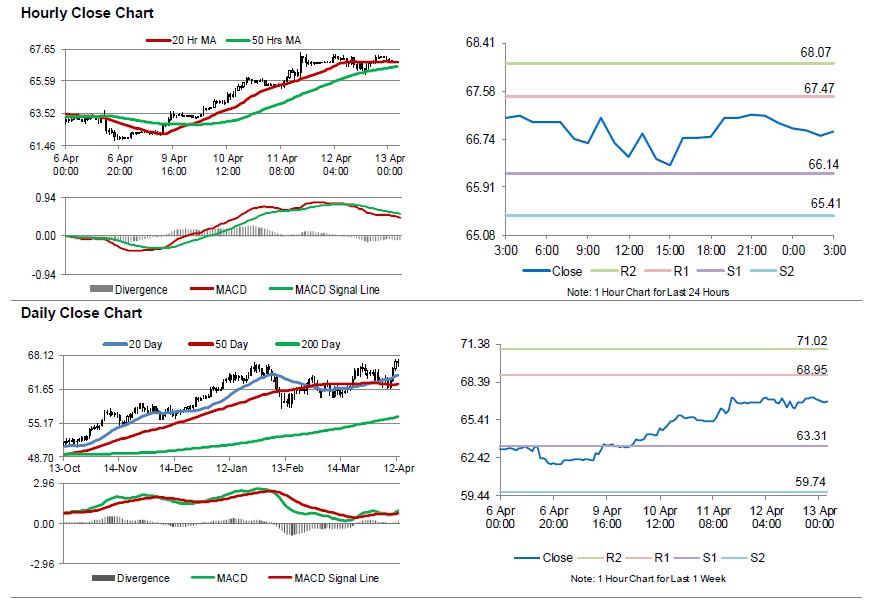
For the 24 hours to 23:00 GMT, Crude Oil rose 0.31% against the USD and closed at USD67.02 per barrel, amid persistent tensions over Syria as well as bullish monthly report from Organisation of the Petroleum Exporting Countries (OPEC).
The report revealed that OPEC’s total crude output declined by 201,000 barrels per day (bpd) to average 31.96 million bpd in March.
In the Asian session, at GMT0300, the pair is trading at 66.88, with oil trading 0.21% lower against the USD from yesterday’s close.
The pair is expected to find support at 66.14, and a fall through could take it to the next support level of 65.41. The pair is expected to find its first resistance at 67.47, and a rise through could take it to the next resistance level of 68.07.
Crude oil is showing convergence with its 20 Hr moving average and trading above its 50 Hr moving average..
New Zealand BusinessNZ PMI: Weak spot in production
New Zealand BusinessNZ Performance of Manufacturing Index (PMI) dropped -1.1 to 52.2 in March. That's also the second consecutive decline in 2018 even though it still signaled expansion.
BusinessNZ's executive director for manufacturing Catherine Beard:
- "On a positive note, the proportion of positive comments in March (55.1%) picked up from both February (51.4%) and January (50.7%). Those who provided negative comments typically noted a lack of finding the right staff, reduced orders (both domestically and offshore) and general uncertainty in the market."
BNZ Senior Economist, Craig Ebert:
- "The weak spot in March's PMI was its production index. With a seasonally adjusted outcome of 50.8 this was close to stalling. Compare this to February's 53.7 and the exceptionally high reading of 61.0 back in November and a sense of sharp deceleration arises".
Market Morning Briefing: Euro Has Dipped From Its High Near 1.2396
STOCKS
Dow (24483.05, +1.21%) and Dax (12415.01, +0.98%) have moved up a bit yesterday but have important resistances just above current levels. Watch price action here. If the indices manage to break above immediate resistances, near term could see a decent upmove towards 25000 and 12800-12900 respectively.
Nikkei (21771.69, +0.51%) is almost stable but has some chances of moving up towards 22200-22400 in the near term before coming off from there again in the longer run
Shanghai (3170.10, -0.28, -0.25%) is trading below 3200 levels just now and could test 3150 once before again trying to move above 3200. Near term looks bearish.
Nifty (10458.65, +0.40%) has risen well yesterday also and has some chances of testing 10500-10550 on the upside. A short dip could be possible thereafter towards 10400 or lower in the longer term. Sensex (34101.13, +0.47%) has some scope of testing 34500 on the upside if the upside momentum sustains.
COMMODITIES
Brent (71.79) and Nymex WTI (66.85) are down a bit today. Some stable movement or a small corrective dip is likely to be seen after the recent surge in the last few sessions. Overall 68 on the WTI and 74 on Brent are likely to be tested and may hold for some more time.
Gold (1342.90) is slightly down again. While resistance near 1360/70 holds, it would not be easy for Gold to attempt a break above 1370. The price may continue to trade in the 1320-1370 region for now.
Copper (3.0680) saw a sharp fall from levels near 3.15. A bounce back from 3.02 is expected just now. Some stability may be seen in the prices for a few sessions.
FOREX
Dollar is seeing some strengthening due to a combination of various factors : US unemployment claims data coming in lower; Trump moderating his threat of a US attack on Syria and the US Fed minutes reflecting the FOMC's firm belief in the US economy's growth. On the other hand, the ECB minutes reflected some shakiness in the outlook for EU inflation's sustainability, thereby weakening the Euro slightly.
Dollar index (89.79) is seeing a pause in its downmove towards support on daily candles and weekly line chart near 89.25. There 13 and 21 moving average lines on the 3 day line chart could provide resistance at current levels and push it down.
Euro (1.2327) has dipped from its high near 1.2396 day before yesterday and is testing support near 1.23 on 3 day candles and daily line chart. It is likely that this support will hold and push Euro up towards 1.24-1.2425 again (seen as immediate resistance on daily line chart). If Euro rises beyond 1.24-1.2425, it could then target previous highs near 1.26 (or max, go up to 1.28), from where a medium term correction could be possible. A straight rise past 1.26-1.28 would imply medium term bullishness for the Euro.
Dollar Yen (107.34), against our expectation of a dip towards 106.6 has risen to previous highs near 107.4. There could be some resistance at this level provided by the 21 moving average line on 3 day line chart and also by a possible trendline on daily candles and daily line chart coming down from Jan ’18. A breach of 107.4 would open up possibility of a further upmove towards 107.9-108.0, which is seen as a crucial level. A breach of this level would imply medium term bullishness for Dollar Yen.
Euro Yen (132.33), as mentioned yesterday, is getting some immediate resistance from the 21 moving average line on the 3 day line chart. Slightly higher up, there is the 21 week moving average near 133 on the weekly line chart which could also provide resistance. We could see 133 being tested if Dollar Yen stays in the 107.0-107.4 zone while Euro moves up towards 1.24.
Pound (1.4231) has breached immediate resistance near 1.42 (seen on daily and 3 day candles) and might now move towards interim resistance near 1.43-1.435 on 3 day candles. In the medium term, a breach of 1.430-1.435 could imply bullishness towards 1.46 (seen as resistance on weekly line chart).
Dollar Rupee (65.26) - We need to see whether the market closes above 65.20 or below 65.15 today. A Week Close above 65.20 increases the chances of a rise towards 65.50 over the coming weeks. Alternatively, a Week Close below 65.15 will increase the chances of a break below 65.05, targeting 64.80 all over again.
INTEREST RATES
US yields have seen a rise due to the positive developments listed in the Forex section above: US unemployment claims decreasing (thereby suggesting a stronger economy), Trump’s moderation on Twitter with respect to Syria and the Fed minutes reflecting increased belief in a stronger economy.
US 10 Yr Yield (2.8174%), 30 Yr (3.02%), 5 Yr (2.65%), 2 Yr (2.3357%):
The 10 Year yield, contrary to expectation, has moved higher towards resistance on short term chart near 2.83%-2.85%. It could see a dip soon.
The 30 yr as expected didn’t break support near 3% on short term and medium term chart and might dip from resistance near 3.03%-3.04% on short term charts.
Could Tariffs Gum Up Industry Supply Chains?
Executive Summary
We focus in this report on how potential American tariffs on Chinese goods could affect the supply chains of different industries. Not only would tariffs directly raise the prices of Chinese-produced goods, but non-Chinese producers of those goods could use the opportunity to raise their prices. We find that the aircraft manufacturing industry is among the industries with the most exposure to inputs that are targets of potential tariffs. But there are some not-so-readily apparent industries that could also see the prices of many of their inputs rise.
Is China a Major Supplier of Potentially Tariffed Goods?
The news media has been filled in recent weeks with stories of proposed American tariffs on Chinese goods and Chinese threats of retaliation. Chinese President Xi made a speech recently that was conciliatory in nature, so some of the tension between the United States and China has been reduced, at least for now. That said, the situation is fluid and it would be premature to claim categorically that both sides will not resort to tariff implementation. In three previous reports, we analyzed the vulnerability of specific American industries to potential tariff retaliation, which countries could be affected indirectly by U.S. tariffs on Chinese goods and the potential costs of a full-blown trade war.1 In this report, we focus on the effects that American tariffs on Chinese goods could have on specific industries in the United States to determine how the tariffs could affect the supply chains of different industries.
On April 3, the Office of the U.S. Trade Representative (USTR) released a list of proposed tariffs on 1,300 Chinese goods that have a total import value of roughly $50 billion. The goods are classified according to the Harmonized Commodity Description and Coding System (HS), and they can be broadly grouped into imports of the following goods: chemicals and pharmaceutical products, (HS 28, 29 & 30), rubber and articles thereof (HS 40), iron and steel and articles thereof (HS 72 & 73), aluminum and articles thereof (HS 76), machinery (HS 84, 85 & 86), vehicles other than railway (HS 87), aircraft and parts (HS 88), ships and boats (HS 89), optical and other types of equipment (HS 90) and arms and ammunition (HS93)2. Note that many of these broad categories of goods are not consumed directly by consumers but rather are used as inputs into the production of other goods in the United States.
If implemented, the measures announced by the USTR would directly raise the price of the Chinese goods that are subject to the tariffs. But they would also encourage non-Chinese producers of the goods, whether in the United States or in other foreign economies, to raise prices as well. For goods for which China is not an important supplier, prices probably would not rise that much. But for goods for which China is a major supplier, prices could rise meaningfully. In that regard, Figure 1 shows that the United States gets 30 percent or more of its imports of the following goods from China: electric machinery (HS 85), railway machinery (HS 86), nuclear reactors and other machinery (HS 84) and articles of iron and steel (HS 73).3 Consequently, prices of these products could rise in a meaningful way if the United States goes through with its stated intention of enacting tariffs on these goods.
 Some Industries Are Apparent, Some Not So Much
So which industries in the United States would potentially bear the brunt of higher costs of inputs? To answer this question, we turned to the input-output tables of the U.S. economy. These tables are useful because they contain data on the inputs that are required to produce the output of 71 individual industries. We started by isolating the goods noted above that are potentially subject to tariffs. For each of the 71 industries, we then summed the dollar value of these tariff-affected goods and expressed them as a percent of total inputs of each industry. Finally, we ordered the 71 industries in descending order of percentages. The results for the industries with percentages in excess of 10 percent are shown in Table 1.
 Our analysis shows that the "other transportation equipment" industry, which is essentially aircraft manufacturing, is the industry with the most exposure to inputs that are targets of potential tariffs. That is, 67 percent of the inputs of the aircraft manufacturing industry are at risk of higher prices, either directly or indirectly, from the announced list of tariffs. Other industries with high degrees of exposure to the price-raising effects of tariffs include electrical equipment, appliances & components, fabricated metal products, plastic and rubber products, machinery, computer and electronic products, chemicals and primary metals.
It is notable that there is some overlap between goods subject to tariffs and industries that have high degrees of exposure to those goods. But this makes sense upon further reflection. For example, many chemicals are potentially subject to the announced tariffs, but our analysis also shows that many chemical producers are highly vulnerable to higher costs via inputs of other chemicals. We are not experts on the chemical industry, but certain types of chemicals probably are important inputs into the production of other types of chemicals. Likewise, the electrical equipment industry uses significant amounts of other types of electrical equipment (e.g., integrated circuit boards) in its production process.
An "industry" that is listed in Table 1 that bears mentioning is "federal government defense." Indeed, 41 percent of the "inputs" of this "industry" are at risk of higher prices from tariffs. Although the Department of Defense likely does not buy many goods directly from China, the prices of the goods that it buys from competing American producers (e.g., iron and steel products, electrical equipment, etc.) could be pushed up meaningfully if those producers take the opportunity of tariffs on Chinese goods to raise their own prices. This is an example of the potential negative effect that tariffs could have on an "industry," which would not be readily apparent from casual observation. The construction industry, which may not spring readily to mind as an industry that could have its supply chain affected by tariffs, is also vulnerable to higher costs of many of its major inputs.
Conclusion
A few weeks ago, the USTR released a list of 1,300 Chinese goods that could potentially be subject to tariffs. These tariffs have not yet gone into effect, because they are subject to a public comment period. Moreover, the administration could eventually decide not to impose the tariffs if negotiations with China are successful. But if the tariffs are ultimately enacted, then certain American industries could be facing higher costs of important inputs, either directly or indirectly.
Our analysis shows that the aircraft manufacturing industry is among the industries with the most exposure to inputs that are targets of potential tariffs. Other industries with high degrees of potential exposure include manufacturers of electrical equipment, appliances & components, fabricated metal products, plastic and rubber products, machinery, computer and electronic products, chemicals and primary metals. But there are other "industries," which are not so readily apparent, that could face higher costs if the tariffs are enacted. For example, the U.S. Department of Defense and the construction industry could be negatively affected if the prices of the goods they buy rise on account of the tariffs.
USD/JPY Looks Set To Trade Higher
Key Highlights
- The US Dollar formed a major support at 104.60 and recovered nicely against the Japanese Yen.
- There was a break above a significant bearish trend line with resistance at 106.35 on the daily chart of USD/JPY.
- The US Initial Jobless Claims in the week ending April 7th, 2018 declined from 242K to 233K.
- Today, the Michigan Consumer Sentiment Index for April 2018 (Prelim) will be released, which is forecasted to decline from 101.4 to 100.5.
USDJPY Technical Analysis
The US Dollar started an upside move after trading as low as 104.63 against the Japanese Yen. The USD/JPY broke a few resistances such as 105.00 and 106.00 to move back in a positive zone.
Looking at the daily chart, the pair broke the 23.6% Fib retracement level of the last decline from the 110.48 high to 104.63 low. Moreover, there was a break above a significant bearish trend line with resistance at 106.35.
It opened the doors for more gains with a close above the 106.50 pivot level. Going forward, the pair has to break the 107.60 resistance, and the 50% Fib retracement level of the last decline from the 110.48 high to 104.63 low to gain bullish momentum.
The next major hurdle for buyers is near the 108.40 level, which was a support earlier. On the downside, supports are at 106.50 and 106.20.
Recently in the US, the Initial Jobless Claims for the week ending April 7th, 2018 was released by the US Department of Labor. The market was positioned for decline in claims from 242K to 230K.
The actual result a bit on the lower side, as the decline in claims was less at 233K. Still, there was a decrease of 9K in claims, which is a positive sign. The report added that:
The 4-week moving average was 230,000, an increase of 1,750 from the previous week’s unrevised average of 228,250.
Overall, the US Dollar may continue to rise versus the Japanese Yen, and other major pairs such as EUR/USD could decline in the short term.
Economic Releases to Watch Today
- German Consumer Price Index for March 2018 (YoY) – Forecast +1.6%, versus +1.6% previous.
- German Consumer Price Index for March 2018 (MoM) – Forecast +0.4%, versus +0.4% previous.
- Michigan Consumer Sentiment Index for April 2018 (Prelim) – Forecast 100.5, versus 101.4 previous.
Eco Data 4/13/18
[php_everywhere instance="1"]
Gold Slides on Trump Tweet, Roller Coaster Ride Continues
Gold has posted sharp losses in the Thursday session, erasing the strong gains which marked the Wednesday trading. In North American trade, the spot price for an ounce of gold is $1337.67, down 1.14% on the day. In economic news, unemployment claims dropped to 233 thousand, within expectations of the estimate of 231 thousand. On Friday, the US releases the UoM Consumer Sentiment report.
It’s been a roller-coaster ride for gold over the past two days, marked by sharp gains and losses for the base metal. Tensions in the Middle East remain high, and gold prices soared higher on Wednesday, as US President Trump promised to punish the Syrian regime for an alleged chemical attack by government forces last weekend. For its part, Russia has countered that it will respond to any US move against Syria. The markets were braced for an imminent US air strike, but investors have regained some risk appetite on Thursday after Trump tweeted that a US response could come “very soon or not so soon at all.” With the possibility that Trump’s bite might not follow his bark, gold has become less attractive and dropped sharply on Thursday.
The Federal Reserve minutes had a generally hawkish tone, reflective of a solid US economy. All of the Fed policymakers indicated that the US economy would continue to improve and that inflation would rise in the next few months. At the March meeting, the Fed unanimously voted to raise rates by a quarter-point, bringing the benchmark rate to a range between 1.50% and 1.75%. The Fed projection for rate policy in 2018 remains at three hikes, although there is speculation that the Fed could revise the forecast to four rate hikes. Last week, Fed Chair Jerome Powell said that the Fed would likely continue to raise rates in order to keep a lid on inflation, but added that the rate moves would be gradual. A new headache for the Fed is the escalating trade battle between the US and China, which could hurt the economy and raise consumer prices. As for the next two rate meetings, the markets expect Powell & Co. to sit tight in May and raise rates at the June meeting.
Pound Rally Continues, Pushes to 2-Week High
The British pound is on a roll and has recorded gains for a fifth straight day. In the Thursday session, GBP/USD is trading at 1.4243, up 0.45% on the day. The pound has enjoyed a strong week, gaining 1 percent. On the release front, the Bank of England released its quarterly credit conditions survey. In the US, unemployment claims dropped to 233 thousand, very close to the estimate of 231 thousand. On Friday, the US releases the UoM Consumer Sentiment report.
The Federal Reserve minutes had a generally hawkish tone, reflective of a solid US economy. All of the Fed policymakers indicated that the US economy would continue to improve and that inflation would rise in the next few months. At the March meeting, the Fed unanimously voted to raise rates by a quarter-point, bringing the benchmark rate to a range between 1.50% and 1.75%. The Fed projection for rate policy in 2018 remains at three hikes, although there is speculation that the Fed could revise the forecast to four rate hikes. Last week, Fed Chair Jerome Powell said that the Fed would likely continue to raise rates in order to keep a lid on inflation, but added that the rate moves would be gradual. A new headache for the Fed is the escalating trade battle between the US and China, which could hurt the economy and raise consumer prices. As for the next two rate meetings, the markets expect Powell & Co. to sit tight in May and raise rates at the June meeting.
The plucky pound continues to head higher and has surged a sizzling 5.4% since the start of the year. The stronger currency has helped ease inflation concerns to a degree, although the inflation rate is still close to 3%, well above the BoE target of 2%. As for rate policy, bank policymakers do not meet for a rate meeting until May, but there appears to be strong support for a quarter-point rate increase. On Tuesday, a key BoE member, Ian McCafferty, urged the bank not to delay in raising rates, and other policymakers support this view. One strong reason in favor of a rate hike is that inflation remains around 3%, well above the 2% target. However, the lukewarm British economy and the dark cloud of Brexit are key reasons why Governor Mark Carney has not been enthusiastic about raising rates. As things currently stand, a quarter-point rate hike seems likely at the May meeting.
A look at Euro pairs after today’s selloff
Euro suffered broad based selling today, except versus JPY and CHF. Markets seemed to take ECB minutes rather negatively. The cautious tone prompted talks that ECB could stay dovish for longer than expected. Let's have a quick glance on how Euro pairs are doing.
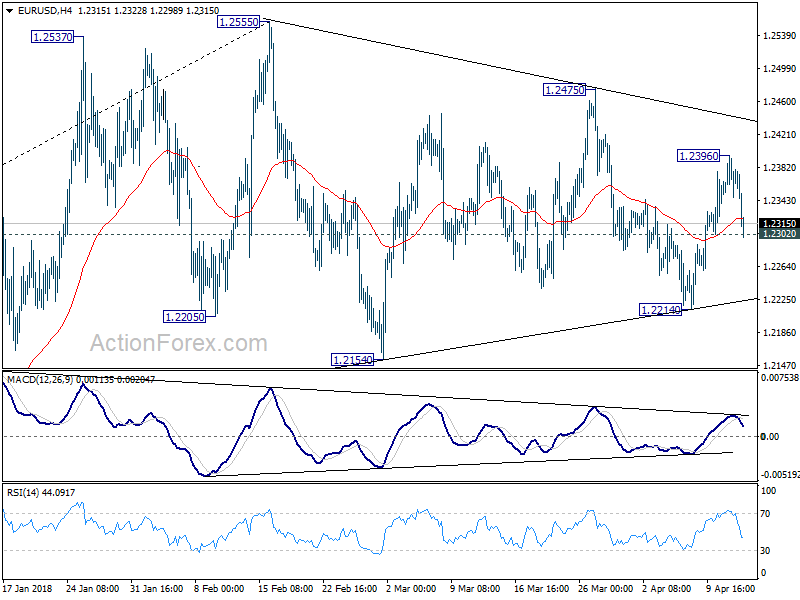
EUR/USD breached 1.2302 minor support briefly, but stabilized since then. There is, so far, at least no downside acceleration through 1.2302 yet. And, even if that happens, the key support level is at 1.2214. As long as it holds, the triangle pattern from 1.2555 is still intact and larger up trend remains in favor to resume later..
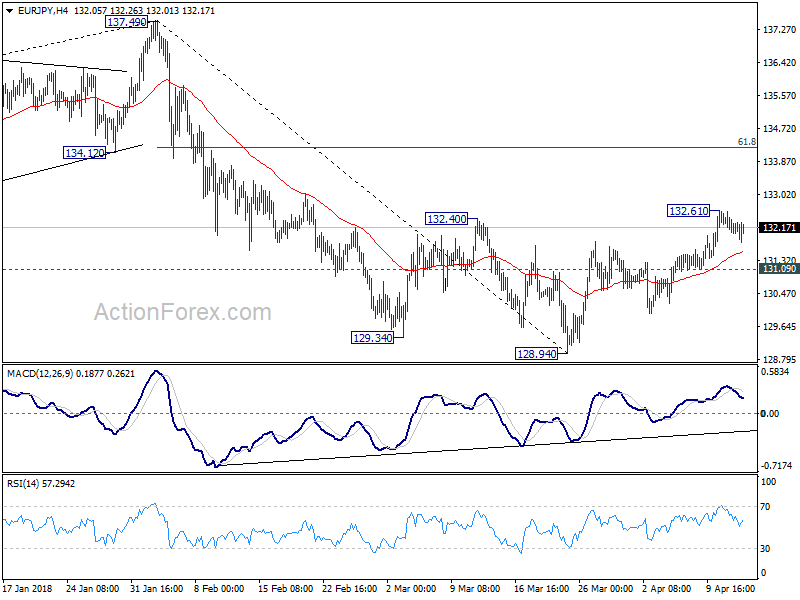
 EUR/JPY is staying in consolidation below 132.61 temporary top. But it's holding well above 131.09 minor support. Thus, the rebound from 128.94 is still expected to extend higher at a later stage to 61.8% retracement of 137.49 to 128.94 at 134.22 and above.
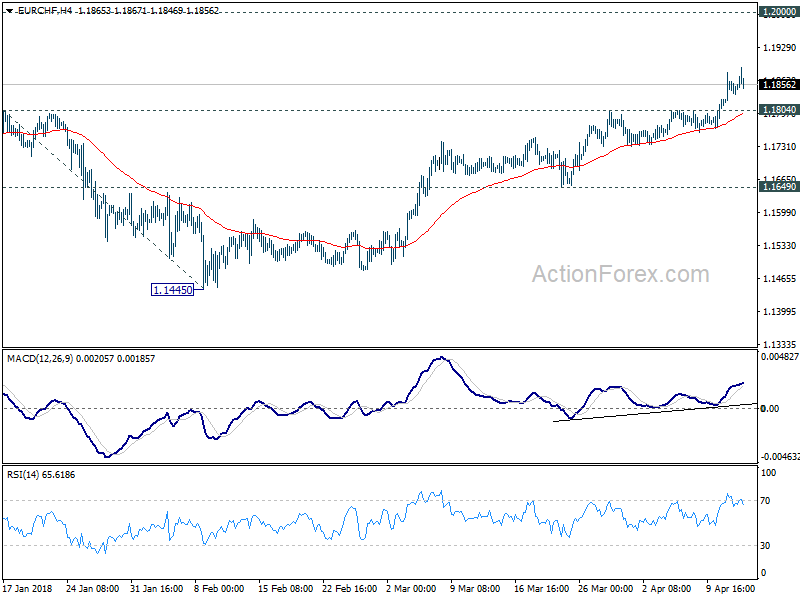
 EUR/CHF's rally continues today and reached as high as 1.1888 so far. Long term up trend has just resumed this week and is on track for 1.2 handle.
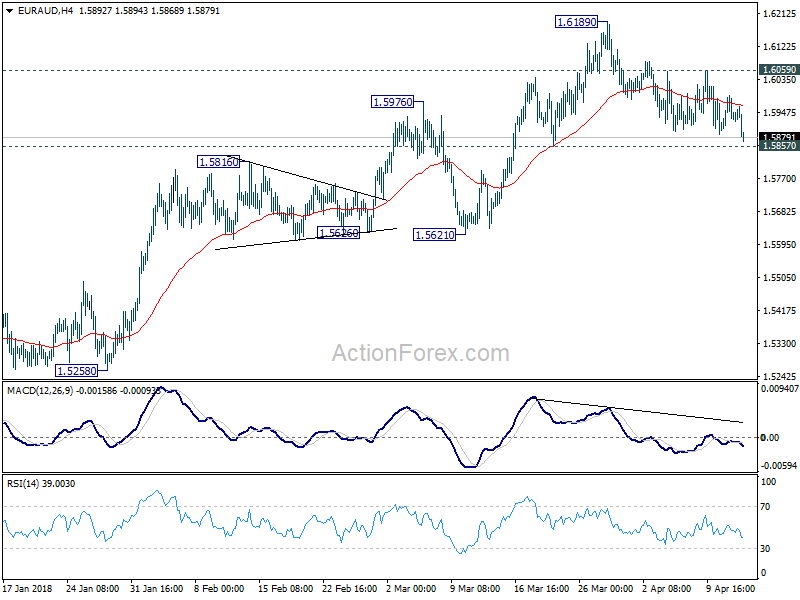
 EUR/AUD extended the choppy fall from 1.6189 t as low as 1.5868. But for now, it's staying above 1.5857 minors support. Hence, price actions from 1.6189 are viewed as a corrective move. Larger up trend is expected to resume at a later stage. Nonetheless, firm break of 1.5857 will be a sign of trend reversal and turn focus back to 1.5621 key support.
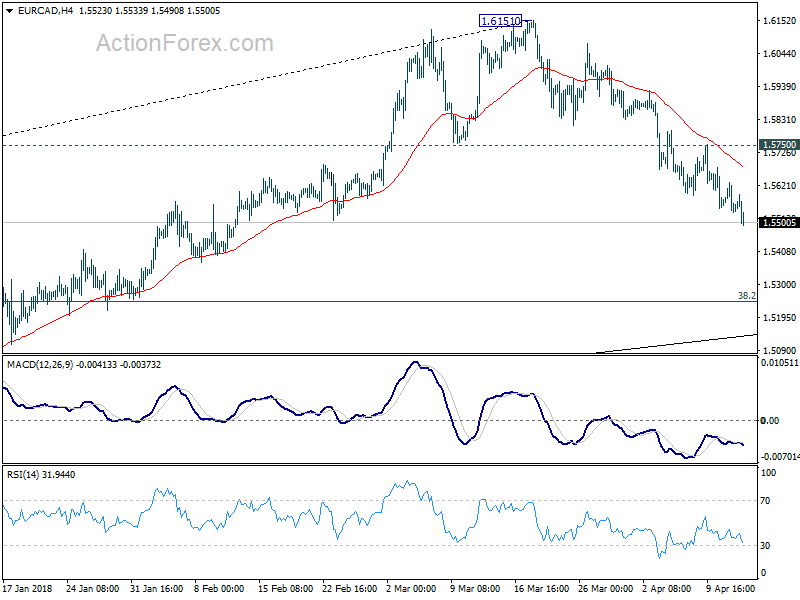
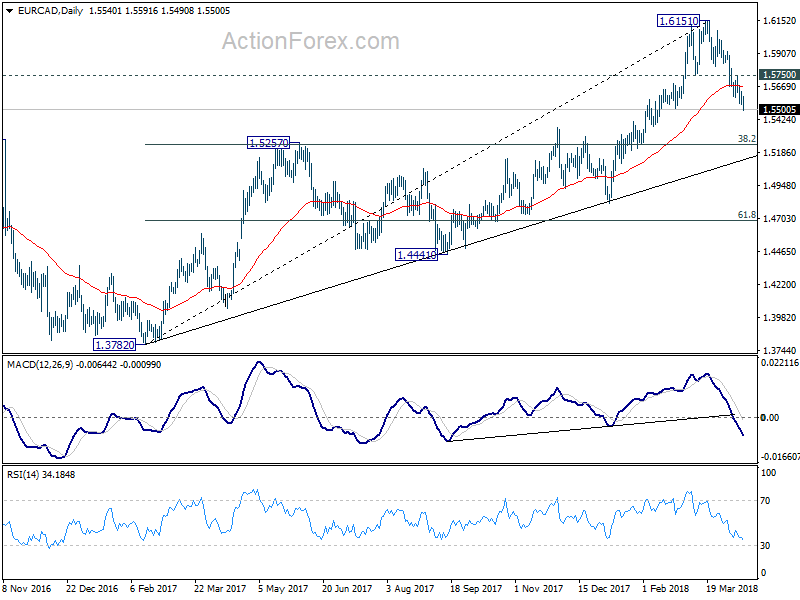
 EUR/CAD's decline from 1.6151 extends today and reaches as low as 1.5490. The cross is on track for 38.2% retracement of 1.3782 (2016 low) to 1.6151 at 1.5246.
 EUR/GBP's downside breakout today now confirms resumption of medium term decline from 0.9305. Next target will be 61.8% projection of 0.9305 to 0.8745 from 0.8967 at 0.8621. But based on current momentum, it will likely extend further to 100% projection at 0.8407.
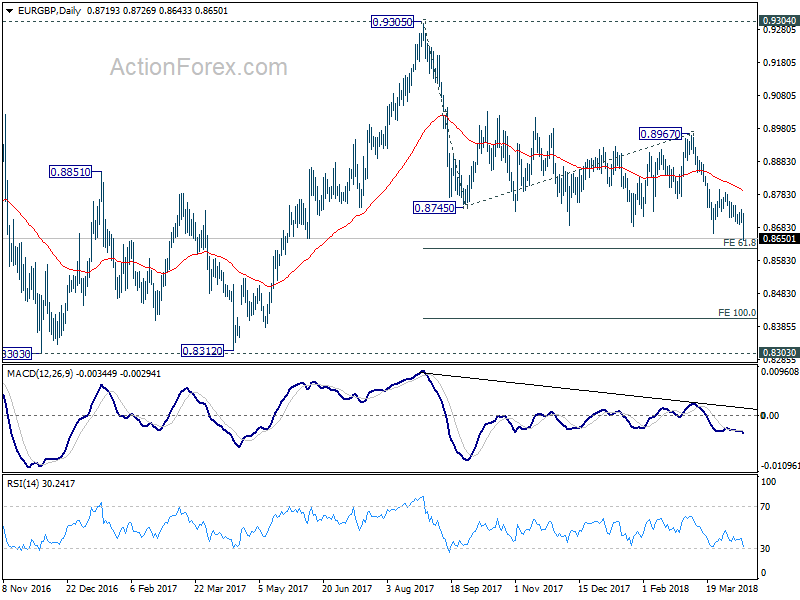
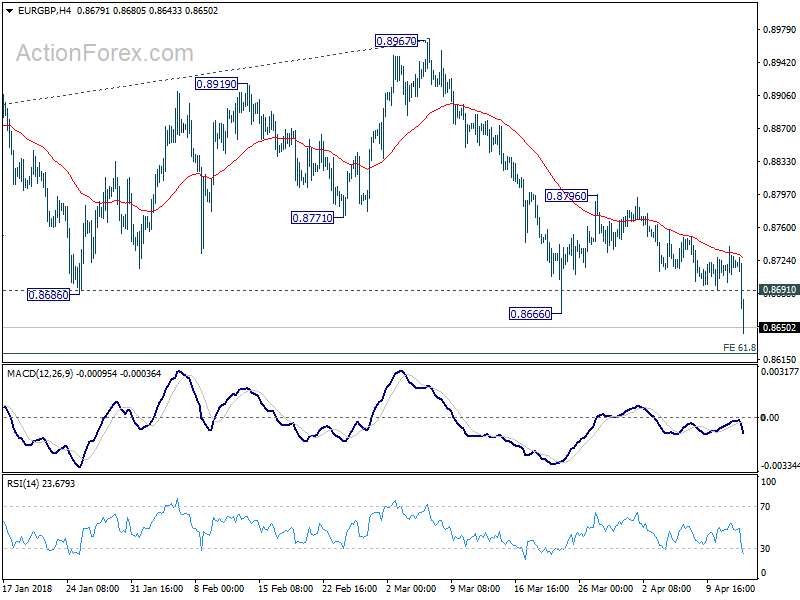 After all, we'd like to point out that outlook in Euro is indeed not that bearish in spite of today's selloff. There is no doubt that EUR/CAD and EUR/GBP are in near term down trend. But there is not clear bearishness in EUR/USD and EUR/AUD yet. EUR/JPY is still likely to extend recent rebound. And EUR/CHF is making new high. So, Euro is overall, mixed only.
Japanese Yen Dips as US Jobless Claims Improve
USD/JPY has posted considerable gains on Thursday, erasing the losses which marked the Wednesday session. In North American trade, USD/JPY is trading at 107.32, up 0.49% on the day. On the release front, there are no Japanese events on the schedule. In the US, unemployment claims dropped to 233 thousand, very close to the estimate of 231 thousand. On Friday, the US releases the UoM Consumer Sentiment report.
Tensions in the Middle East are growing by the hour, but investors haven’t thrown in the towel and snapped up the safe-haven Japanese yen, at least just yet. However, the markets are casting a worried eye on Syria, which is bracing for a US strike. US President Trump has promised to punish the Syrian regime for an alleged chemical attack by government forces last weekend. For its part, Russia has countered that it will respond to any US move against Syria. Relations between the US and Russia could deteriorate if Trump makes good on his promise, and investor risk appetite could sink and boost the Japanese currency.
The Federal Reserve minutes had a generally hawkish tone and this helped support the US dollar. All of the Fed policymakers indicated that the US economy would continue to improve and that inflation would rise in the next few months. At the March meeting, the Fed unanimously voted to raise rates by a quarter-point, bringing the benchmark rate to a range between 1.50% and 1.75%. The Fed projection for rate policy in 2018 remains at three hikes, although there is speculation that the Fed could revise the forecast to four rate hikes. Last week, Fed Chair Jerome Powell said that the Fed would likely continue to raise rates in order to keep a lid on inflation, but added that the rate moves would be gradual. A new headache for the Fed is the escalating trade battle between the US and China, which could hurt the economy and raise consumer prices. As for the next two rate meetings, the markets expect Powell & Co. to sit tight in May and raise rates at the June meeting.