Sample Category Title
UK Manufacturing And Industrial Production Disappoint In February
UK manufacturing and industrial production disappoint in February
Under Brexit pressure to split by December 2020 and uncertainty about the Irish border, the UK economy is in turmoil in Q1 2018. February month-to-month industrial and manufacturing production output was weak at +0.10% and -0.20% (prior: +1.30% and 0%). February’s trade deficit of GBP -965 million (prior: GBP 2.95 billion), due to lower imports caused by mid-February snow storms, decreased the likelihood of money tightening. March inflation data (to release on 18 April) will give a better view as to whether the Bank of England will hit its target of 2.40%.
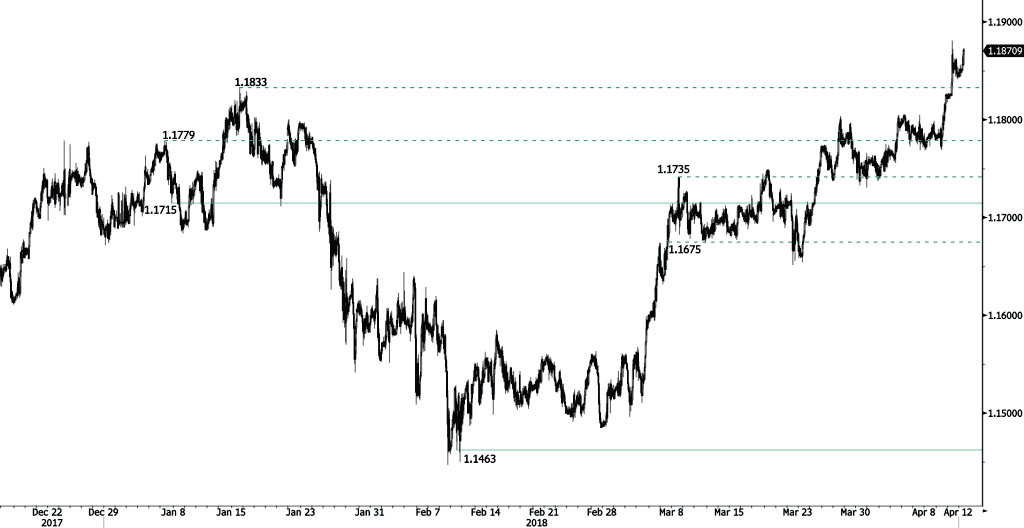
Strengthening since the beginning of the year, GBP/USD currently trades at 1.4187 (+5.07% year to date) and is approaching its 2-year high, heading to 1.4195 short-term.
ECB Dances
When will the European Central Bank tighten money? Austrian Ewald Nowotny, one of its governors, said yesterday to Reuters that the ECB should get on with it now: hike interest rates and stop buying bonds. The ECB then disowned the remarks. A spokesperson for the bank said Nowotny spoke only for himself.
The ECB is attempting a complex dance to get hawkish without out spooking FX traders and driving the Euro higher, possibly even derailing the European economic recovery. Current popular thought is that the ECB will reveal its plans for rates and bonds in June-July. We anticipate (with relative confidence) the bank will reduction bond buying to zero in September. However, even marginal slowing in European economies could delay action.
ECB governors must envy the US Federal Reserve, which with quasi-stealth unwound its own, massive Quantitative Easing and raised interest rates without spiking the USD. Former Fed Chair Janet Yellen’s near-magical abilities teased the prospect of rising interest rates without strengthening the USD. The ECB should take a page from the Fed. Talk down economic quality (not difficult, considering negative surprises in Eurozone) while moving toward the exits. The EUR/USD pair corrected from a two-week high of 1.2396, primarily due to fears of US-Russia war over Syria. This is an opportunity to reload EUR/USD longs.
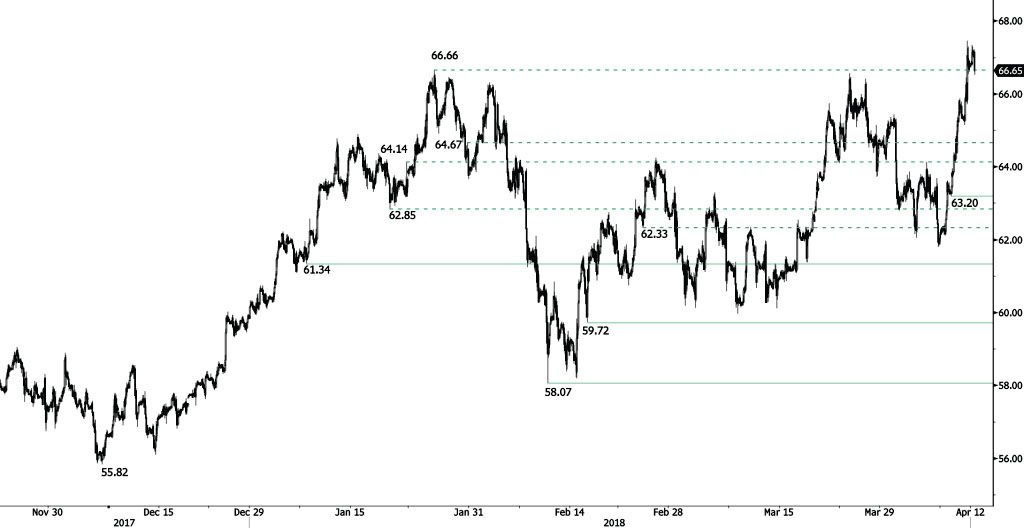
CRUDE OIL Slight Decline
Crude oil is decreasing slightly following recent rise at 67.45 and breaking hourly resistance at 66.66 (25/01/2018), heading along the 66.55 range. Crude Oil is trading at its December 2014 high. The bullish pattern started in November 2017 is confirmed. Hourly support at 63.20 (10/04/2018 low) is distanced. The technical structure suggests short-term decrease.
In the long-term, crude oil has recovered after its sharp decline last year. However, we consider that further weakness is very likely. For the time being, the pair lies in an upside trend since June 2017. Support lies at 42.20 (16/11/2016) while resistance is located at 77.83 (20/11/2014). Crude oil is trading above its 200 DMA.
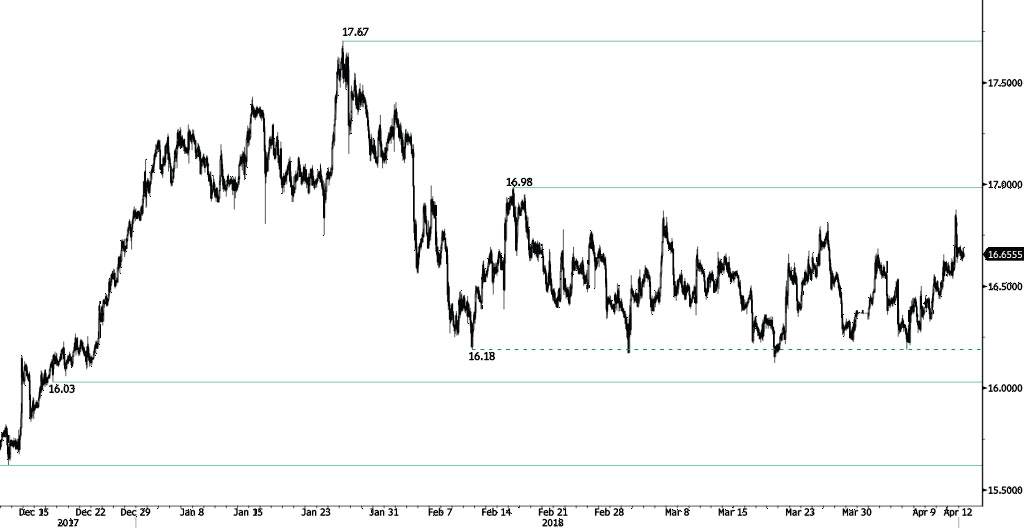
SILVER Edging Lower
Silver is weakening further, heading along the 16.60 range. Silver is contained between hourly support and resistance given at 16.03 (18/12/2017 low) and 16.98 (15/02/2018 high). The short-term technical structure suggests further short-term downward moves.
In the long-term, the trend remains negative/ sideways. Further downside is very likely. The pair is trading below its 200 DMA. Resistance is located at 21.58 (10/07/2014 high). Strong support can be found at 11.75 (20/04/2009).
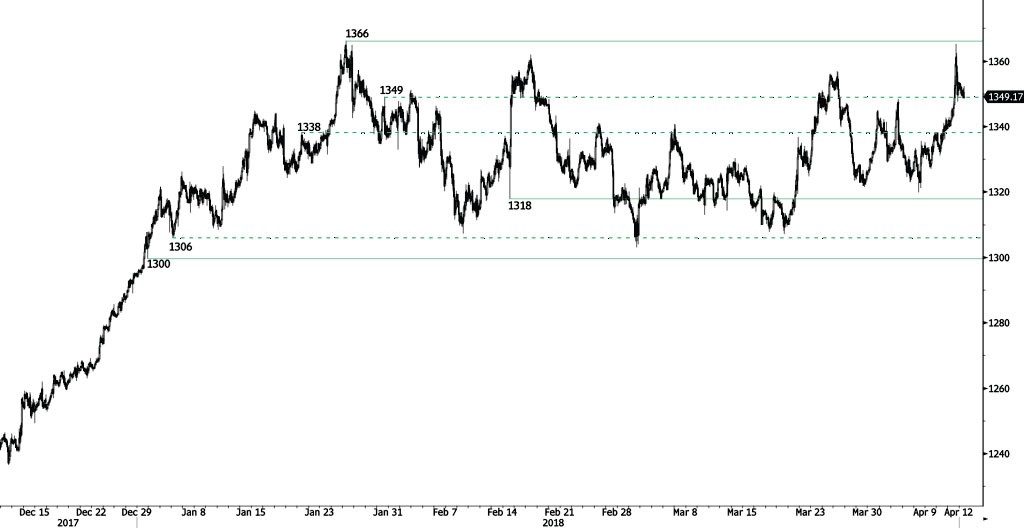
GOLD Decreasing After Breaking Resistance At 1349
Gold is trading lower after breaking resistance at 1349 (30/01/2018), heading along the 1345 range. Hourly support and resistance are now at 1318 (14/02/2018 low) and 1366 (25/01/2018 high). The technical structure suggests shortterm decrease.
In the long-term, the technical structure suggests that there is a growing upside momentum. A break of 1'392 (17/03/2014) is required to confirm it. A major support can be found at 1'045 (05/02/2010 low).
EUR/CHF Continued Strength
EUR/CHF bullish momentum continues, currently trading above 1.1870 and heading along the 1.1875 range. Strong resistance at 1.20 (level before the unpeg) remains. Hourly support is given at 1.1715 (07/01/2018 low). The shortterm technical structure suggests further shortterm increase.
In the longer term, the technical structure has reversed. Strong resistance is given at 1.20 (level before the unpeg). Yet, the ECB's slowing QE program is likely to cause buying pressures on the euro, which should weigh in favour of the EUR/CHF. Support can be found at 1.0624 (24/06/2016 low).
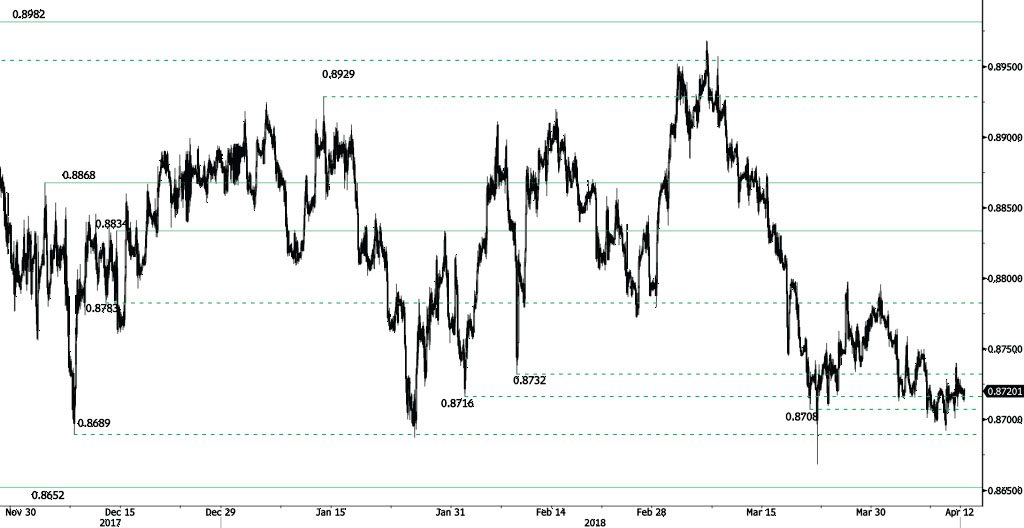
EUR/GBP Bullish Consolidation
EUR/GBP is trading sideways at the 0.8720 range following recent rise from 0.87005 low. EUR/GBP bearish pattern started in March is maintained. Hourly support and resistance are given at 0.8652 (08/06/2017 low) and 0.8834 (14/12/2017 high). The technical structure suggests short-term sideways trading moves.
In the long-term, the pair has largely recovered from 2015 lows. The technical structure suggests further upside pressure. Strong resistance can be found at 0.9500 (psychological level) while support remains at 0.8304 (05/12/2016 low). The pair is trading below its 200 DMA.
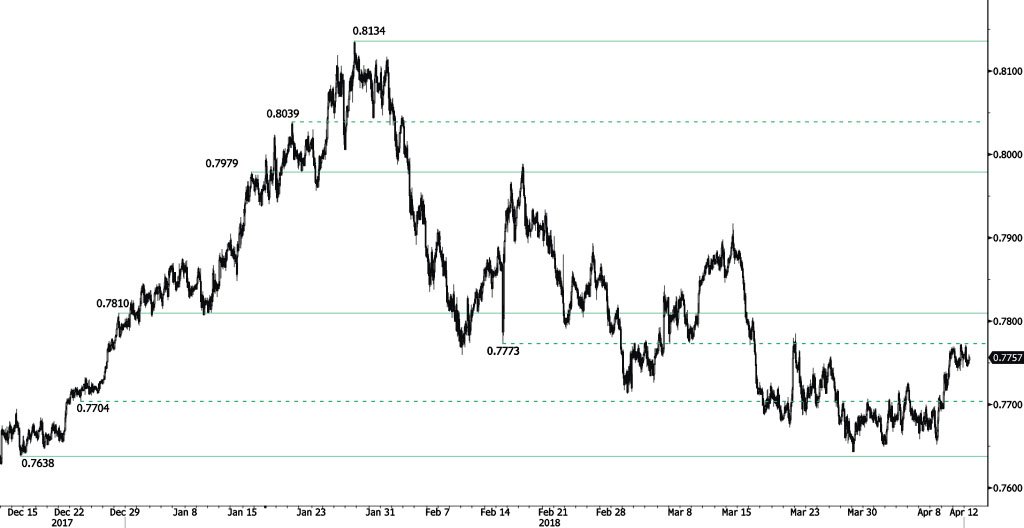
AUD/USD Neutral
AUD/USD is stabilized at 0.7757 following recent rise. The bearish pattern started in mid- February 2018 is maintained. Hourly support and resistance are given at 0.7638 (15/12/2017 low) and 0.7810 (28/12/2017). The technical structure suggests short-term downward moves.
In the long-term, the upward trend slows down after failing to reach key resistance at 0.8164 (14/05/2015 low). Key support stands at 0.6009 (31/10/2008 low). A break of the key resistance at 0.8164 (14/05/2015 high) is needed to invalidate our long-term bearish view.
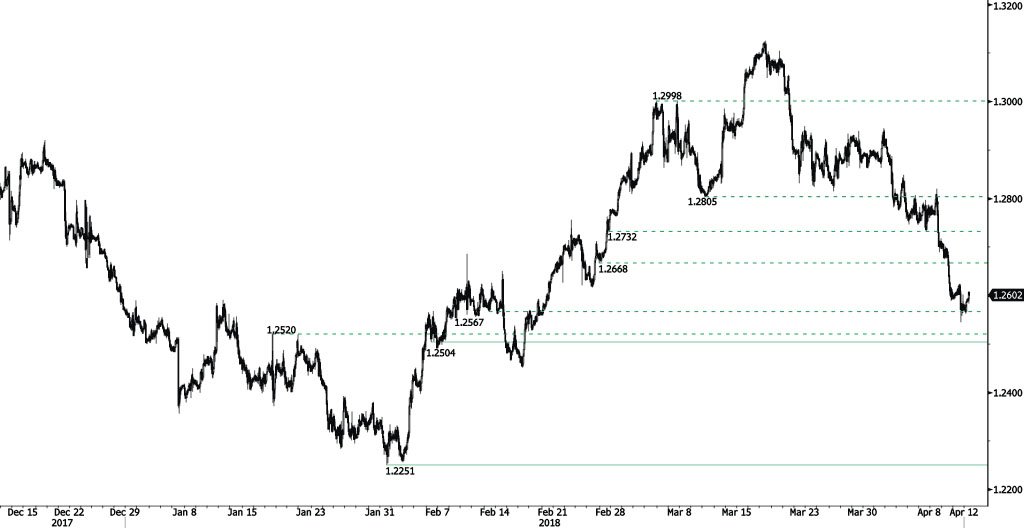
USD/CAD Approaching 1.26
USD/CAD recovery phase continues following recent downturn at 1.2589, heading along the 1.2610 range. Hourly support and resistance are given at 1.2567 (13/02/2018 low) and 1.3308 (23/06/2017 high). The short-term technical structure suggests further short-term upward moves.
In the longer term, the pair is trading between resistance point at 1.3805 (05/05/2017 high) and support at 1.2128 (18/06/2015 low). Strong resistance is given at 1.4690 (22/01/2016 high). The pair is likely to head lower. The pair is trading below its 200 DMA
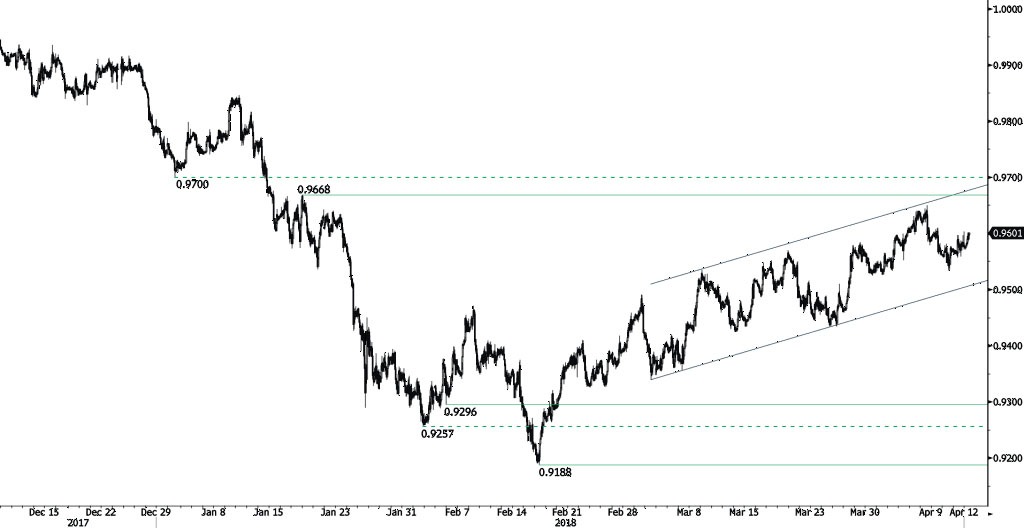
USD/CHF Heading Higher
USD/CHF is rising, currently trading above 0.96 and heading along the 0.9605 range. The bullish pattern started from 0.9188 (16/02/2018 low) continues. The pair is contained between hourly support and resistance given at 0.9296 (05/02/2018 low) and 0.9668 (17/01/2018 high). The technical structure suggests further shortterm increase.
In the long-term, the pair is still trading in range since 2011 despite some turmoil when the SNB unpegged the CHF. Key support lies at 0.9072 (07/05/2015 low) while resistance at 1.0344 (15/12/2016 high) is distanced. The technical structure favours a long term bullish bias since the unpeg in January 2015.
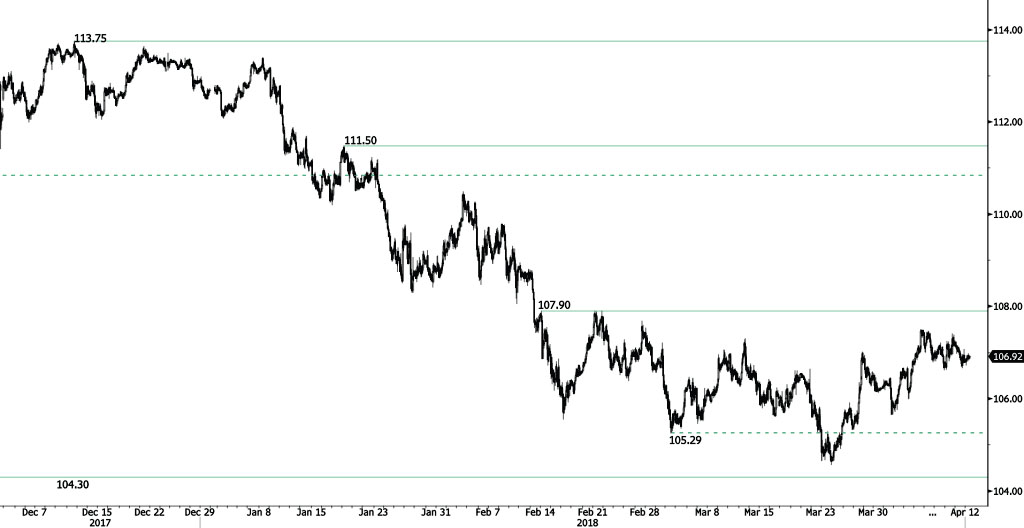
USD/JPY Slight Increase
USD/JPY is bouncing off from 106.65 low, heading along the 107 range. The bearish pattern started in January 2018 is maintained. Hourly support and resistance are given at 104.30 (08/11/2016 low) and 107.90 (14/02/2018 high). The short-term technical structure suggests short-term upward moves.
We favor a long-term bearish bias. Support remains at 101.20 (09/11/2016 low). A gradual rise toward the major resistance at 125.86 (05/06/2015 high) seems unlikely. Expected to decline further support at 101.20 (09/11/2016 low). The pair trades largely below its 200 DMA.