
Sample Category Title
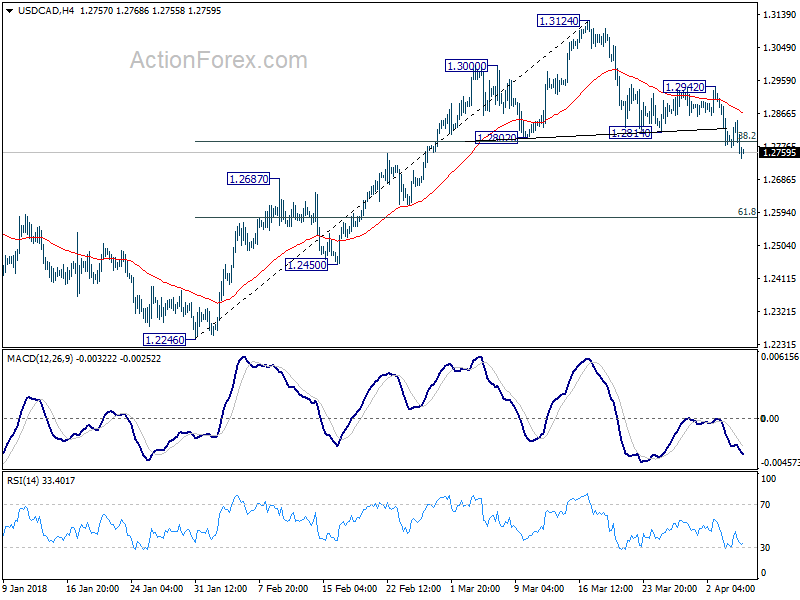
USDCAD broke 1.3065 fib level on good NAFTA progress
Canadian Dollar once again surged overnight on positive NAFTA news. And it's now trading as the strongest one for the week, maintaining gains for the day.
 Canadian Foreign Minister Chrystia Freeland said yesterday that "we're making good progress on NAFTA ... having said that, we're not there yet." And that's seen by the markets as positive comments. She will meet with US Trade Representative Robert Lighthizer today.
White House top economic advisor Larry Kudlow also said that there would be "some positive news on NAFTA ... and I think the stock market is going to love that."
It's also reported that in the latest US proposal regarding car, parts are grouped into five categories. And some of which could have a lower requirement for North American contents or none at all.
It's been reported repeated that Trump is pushing to have a draft NAFTA agreement by next week. For now, there are so many outstanding issues that it's impossible to have a full agreement that soon. But there is a chance of a "symbolic agreement" signalling some consensus, as soon as next week.
Technically, the rally in CAD now sent USD/CAD through 38.2% retracement of 1.4689 to 1.2061 at 1.3065. Also, note the head and shoulder top pattern (ls: 1.3000; h: 1.3124; rs: 1.2942) too. It's now heading to 61.8% retracement at 1.2581 and below.
Market Morning Briefing: Euro Again Saw A Low Near 1.225
STOCKS
Most indices are likely to be on a recovery mode and could be trading higher in the next couple of sessions.
Dow (24264.30, +0.96%) saw huge intra-day volatility yesterday. It first fell to a low of 23523.16, but recovered steadily to close higher for the day. This has been the fourth test of Support at 23500 since February. The long lower wicks on the 3-day and Weekly Candles suggest strong buying interest near 23500. So far, our near-term range of 23500-24500 has held well. Now we have to see whether the Dow manages to break/ rise past 24500. The outlook will become very bullish if it so manages.
Dax (11957.90, -0.37%) is currently holding above the weekly horizontal support near 11800-11700 levels while there is scope to test 11600 on the 3day candles in the medium term. After bouncing back sharply from 11800 yesterday, Dax may move up towards 12200-12300 in the next few sessions.
Nikkei (21668.34, +1.64%) has been moving down slowly and steadily as visible on the 3-day chart. While immediate weekly resistance near 21500 holds, Nikkei looks bearish for the coming sessions. A fall towards 20500-20000 is possible by next week.
Shanghai (3131.11, -0.18%) could spend another week in the 3100-3200 region as both are immediate support and resistance levels as send on the weekly candles. Thereafter, if support at 3100 manages to hold strong, a bounce back towards 3300-3350 is possible, triggering a medium term upmove. Else a fall below 3100, if seen could be vulnerable for a sharp fall in the longer run.
Although Nifty (10128.40, -1.14%) fell from 10279.85 yesterday to close lower at 10128.40, it trades higher at 10277 on the SGX today morning, suggesting a possible recovery of all of yesterday's losses. It has been stuck in the 10000-10300 region for the past 4-5 weeks and a break on either side is possible within the next week to decide further directional movement for the near to medium term.
COMMODITIES
Brent (68.33) and Nymex WTI (63.67) bounced sharply from 3-day support levels near 67 and 62 respectively. While these levels hold, the crude prices could move up in the coming sessions. Near to medium term looks bullish while immediate supports hold.
Gold (1333.90) could trade in the broad 1360-1300 region for the coming sessions. A rejection from 1356 seen on Tuesday could take it lower towards 1320 before another attempt to test 1360. Longer term charts look bearish towards 1300. A rise above 1360 is difficult for Gold in the near term.
Copper (3.0260) faced a sharp rejection from 3.0750. While that holds, a re-test of 3.00 is possible. Near to medium term trade could be seen in the 3.0750-2.9500 region.
FOREX
Dollar index (90.16) has stayed above the earlier resistance line (near 90.10) in the downward channel (daily candles) and is looking likely to move towards higher resistance (seen on daily line chart, weekly line chart and 3 day candles) near 90.5-91.0 (earlier mentioned as 91). The test of 90.5-91.0 could possibly happen next week.
Euro (1.2279) again saw a low near 1.225 (1.2257) yesterday and is currently trading near 1.228. There is strong support seen at 1.225 on 3 day candles, weekly candles and daily line chart. However, on the daily candles, there still seems to be some scope for a downmove towards lower support near 1.2225. In either case, the Euro could bounce from 1.2250-1.2225 towards 1.24 again. A break of 1.2250-1.2225 would however lead to medium term bearishness.
Dollar Yen (106.97) as we predicted yesterday again moved up to test resistance near 106.9 in the downward channel on daily candles but is now looking like it might also breach this resistance. On 3 day candles, weekly candles and daily line chart, it has already breached immediate resistances. Could this be an indicator that Dollar Yen would be bullish in the medium term? We would have to wait and watch.
Euro Yen (131.35) didn't dip from immediate resistance on daily candles at 131 but is now testing slightly higher resistance near 131.5 (on daily candles) and should see a dip from here. However, if the Yen continues to weaken against the Dollar beyond 107, we could see this resistance being breached as well.
Pound (1.4077) is moving up from support near 1.4010 on interim trendline on daily candles. It could either move up further towards resistance near 1.42 on 3 day candles or drop to crucial support near 1.395 (seen on daily and 3 day candles). Let's wait and watch.
Dollar Rupee (65.15) – Dollar Rupee is likely to trade sideways in the 64.80-65.30 region. Rupee is likely to weaken against Yen and Euro in the coming sessions.
INTEREST RATES
US long term yields as we predicted yesterday have bounced from supports on short term charts towards channel resistances. However, US yields seem to be moving in a downward channel which might imply that a slow and gradual decline could take place through Apr-May.
US 10 Yr Yield (2.81%), 30 Yr (3.04%), 5 Yr (2.63%), 2 Yr (2.30%) :
The 10 Year yield rose from support near 2.75% on the short term chart and could now move up further towards 2.85%-2.86%, which could be a resistance level in the downward channel on short term charts.
The 30 yr yield as per expectation rose to resistance in downward channel on short term chart near 3.04% and could now dip from here back towards 3%.
DOW staged 700 pts comeback as trade war cards digested
DOW's initial dive to 23523.16 overnight proved to be temporary and the rebound from there extended without looking back. DOW ended the day up 230.94 pts or 0.96% at 24264.30. That's a massive 700 pt come back and was the strongest in nearly two months.
23360.29 is proving to be a solid support that help fuel the rebound. Also, the cards of the first battle of US-China trade war are now unveiled. At this stage, they're words only as no implementation dates were given by neither side. US will have to wait until completion of the period of public input on May 22 before finalizing the section 301 tariff list. And China certainly won't have any further action before the US starts the next move. So between now and May 22, we should have already seen the worst. Beyond that? Who knows?
For now, a base should be established at 23344.52/23360.29. And the question is how far the rebound would go. 24314.30 resistance should be taken out easily and the first real hurdle is on trend line resistance at around 24900. The next key hurdle is in 25449.15/25800.25 zone. While a breach of the first one could be seen, we don't anticipate a break of the second.
GBP/USD Turned Bearish Below 1.4100?
Key Highlights
- The British Pound traded lower recently and broke the 1.4100 support against the US Dollar.
- There was a break below a major bullish trend line with support at 1.4060 on the 4-hours chart of GBP/USD.
- The US ADP Employment Change in March 2018 posted a rise of 241K, more than the forecast of 205K.
- Today, the UK Services PMI for March 2018 will be released, which is forecasted to decrease from 54.5 to 54.0.
GBPUSD Technical Analysis
After a decent upside move above the 1.4200 level, the British Pound formed a short-term top at 1.4246 against the US Dollar. The GBP/USD pair started a downside move and traded below 1.4100.
The pair declined and broke the 38.2% Fib retracement level of the last wave from the 1.3889 low to 1.4246 high. More importantly, there was a break below a major bullish trend line with support at 1.4060 on the 4-hours.
The downside move was protected by the 100 (red) simple moving averages (4-hours) at 1.4030. However, the pair remains at a risk of more losses as long as it is below 1.4080.
If sellers push the pair below 1.4030 and the 61.8% Fib retracement level of the last wave from the 1.3889 low to 1.4246 high, there could be more losses.
On the upside, the 1.4080 and 1.4100 levels are important hurdles for a fresh upside wave. A close above 1.4100 may perhaps push the pair towards the 1.4200 level.
Recently in the US, the ADP Employment Change for March 2018 was released by the Automatic Data Processing, Inc. The market was positioned for rise of 205K jobs compared with the last 235K.
However, the result was better since there was a rise of 241K. Commenting on the same, the vice president and co-head of the ADP Research Institute, Ahu Yildirmaz, stated:
We saw impressive momentum in the first quarter of 2018 with more jobs added per month on average than in 2017. Midsized businesses added nearly half of all jobs this month, the best growth this segment has seen since the fall of 2014.
Overall, the US Dollar may continue to gain versus its peers such as the Euro, Pound, and others in the near term.
Economic Releases to Watch Today
- Germany’s Services PMI for March 2018 – Forecast 54.2, versus 54.2 previous.
- UK Services PMI for March 2018 – Forecast 54.0, versus 54.5 previous.
- Euro Zone Services PMI for March 2018 – Forecast 55.0, versus 55.0 previous.
- US Initial Jobless Claims – Forecast 225K, versus 215K previous.
- US Trade Balance Feb 2018 – Forecast $-56.8B, versus $-56.6B previous.
Two Scenarios for the US-China Trade Conflict
Key points
- We are entering a crucial phase in the US-China trade conflict.
- We see two possible scenarios: (1) negotiations and a 'grand bargain' and (2) Donald Trump strikes back again and we enter a trade war.
- Scenario 1 is the most likely in our view, which should eventually lead to relief in financial markets
'Phase two' of the US-China trade conflict is now over and we are starting to enter more uncharted waters. Both 'Phase one', with tariffs on steel and aluminium, and 'Phase two', with the latest round of Donald Trump tariffs in defence of US technology – and China's retaliation, have been running according to the script that has been laid out by Trump and China over the past seven to eight months. We generally knew from Trump's communication that both these two salves of tariffs were going to come and we also knew from China's messages that there would be retaliation.
The uncertainty is what happens next. The well-signalled plans end here and it is time for the two countries to work their way forward without a script. This also means that we are entering the most crucial phase of the trade conflict, where it is uncertain what happens next. What we know is that there will be a hearing period in the US of at least 30 days and that China has not said when the new measures will be effective. In general, we see two possible scenarios unfolding from here.
Scenario 1: Negotiation and a 'grand bargain': US Commerce Secretary Wilbur Ross has signalled for some time that the measures are part of a negotiation and said on Wednesday that 'even shooting stars end with negotiations'. He refrained from naming any timing of talks, though. Trump's new top economic adviser Larry Kudlow said on Wednesday that it is possible the tariffs will not be implemented ant that it was primarily aimed at sending a 'message' to the Chinese. Over the coming month, there will be a hearing period in the US and plenty of internal pressure from the agriculture lobby and other US companies that are very worried about the risk of getting a competitive disadvantage on the fastest growing market in the world in many areas. Americans For Farmers & Families said in a statement that 'Just as members of President Trump's own cabinet have warned, America's food and agriculture industries are now taking a direct hit - and our farmers and families will pay the price'.
Trump is currently playing all his cards to put pressure on China. The tariffs have happened alongside a much tougher stance on Taiwan, as a law has just passed Congress encouraging diplomatic relations with Taiwan, which China has deemed a clear break with the One- China policy. It is likely Trump is seeing Taiwan relations as a bargaining chip in the negotiations. Trump's aim may very well be to put maximum pressure going into a negotiation to get as many concessions from China as possible. We have seen this many times before in his tactics on making deals.
So, a possible scenario is that behind the scenes the US and China make a 'grand bargain' over coming months that involves the US backing down from the Taiwan issue and reducing the amount of tariffs on Chinese goods in exchange for better access for US companies in China and a rising effort in China to protect intellectual property rights and stop requiring transfer of technology in joint ventures. China's premier Li Keqian recently signalled this was already on the way (see Bloomberg).
Scenario 2: Trump strikes back again and we enter a trade war: Another scenario is that Trump strikes back in a tit-for-tat move that leads to further Chinese retaliation and the whole thing escalates into a real trade war. So far, the amount of USD50bn is only 0.3% of US GDP. As highlighted by Wilbur Ross on Wednesday, this is hardly something that will give a big hit to the US economy. However, if it spins out of control in a continuous escalation, we will have a trade war with no winners, which could lead to a hit to the global economy and further sell-off in equity markets. So far, we have not seen any comments from the US administration that signal it will strike even harder following the Chinese tariffs. However, it is probably still too early to say.
So, which scenario is it going to be? We believe scenario 1 is the most likely. Whether we call it a 'a grand bargain', or simply just that things stop escalating and we end up with lower amounts and/or tariffs, the result should be that the big fear of a trade war will soon start to fade. In this scenario, we should see equity markets recover on a decline in risk premium that has gone up lately due to the rise in uncertainty.
The main argument in favour of scenario 1 is that neither of the countries has any interest in a trade war that could do significant damage to both economies and have no winners. In addition, both countries have strong cards in their hands, so neither one can really trump the other.
Who has the strongest hand? No one really
China's biggest trump card is probably that it is the fastest growing market in the world and is likely to be so over the next 10 years as well. General Motors sold around four million cars in China in 2017 and it has topped GM's car sales in the US, as it sells 39% of its units in China versus 30% in the US. Even a mild consumer boycott in China on US brands could be detrimental for GM, as well as for other US brands such as Apple, Nike and Coca-Cola. China's middle class is set to grow from around 300 million people to 600 million over the next decade and this is not a market on which anyone wants to miss out.
The strongest card the US has on its hand is that it is China's biggest export market, with around 20% of exports out of China. A strong hit to these would clearly be felt in the Chinese economy and could for a while derail the ambition to increase the quality of growth as China might have to resort to another boost to infrastructure spending to close the demand gap from lower exports. This is a path that entails more lending and a risk of overinvestment - a development from which China is struggling to get away.
We now have to wait for the hearing period in the US to evolve and see whether US tariffs will actually be implemented, whether the amount increases or goes down and how Trump reacts to the Chinese retaliation. We may be in a bit of waiting period for now. However, it is not impossible that we have seen the worst on the trade front for now.
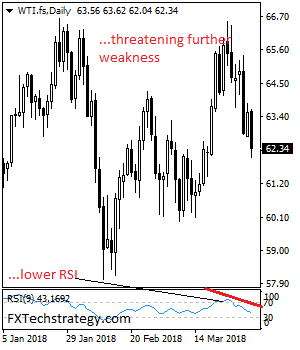
CRUDE OIL – Weakens, Remains Vulnerable
CRUDE OIL - The commodity remains vulnerable to the downside with more weakness envisaged. On the downside, support resides at the 62.00 level where a break will expose the 61.50 level. A cut through here will set the stage for a run at the 61.00 level. Further down, support resides at the 60.50 level. On the upside, resistance resides at the 63.00 level. Further out, resistance comes in at the 63.50 level. A break above here will aim at the 64.00 level and then the 64.50 level followed by the 65.00 level. All in all, CRUDE OIL remains biased to the downside on pullback.
Trade Wars Or A War Of Words
Trade Wars or a War of Words
Incredibly S&P futures were down over 2.0% down at the NY open only to rumble higher to close 1.1 % up on the day after investors dissected a sundry of Chinese and US trade statements and are now holding out for modus vivendi hoping that brewing trade wars turn into little more than a war of words.
Emboldened investor went on a bargain-hunting spree encouraged that neither country has established a tariff implementation itinerary, so hope remains alive with both parties still at the bargaining table.
Let's face it,President Trump continues to walk back the most bombastic elements of his rhetoric, he has softened NAFTA stance, it happened with Amazon, and it could very well occur with China trade negotiations.
But volatility remains exceptionally elevated in stocks. However essential near-term support levels were tested and held. Provided the market stays clear of 2532, the February low on the S&P, equity markets remain out of the danger zone. The markets base case scenario is for no escalation of trade wars, but with investors running on emotion rather than logic, we're only a headline or two away from the next meltdown.
And while the tariff narrative is a real attention grabber, it's turning into a wild goose chase for currency traders The fast reverting price action, especially on USDJPY, is oh so reminiscent of the Korean peninsula risk off swings, which ended up being little more than a red herring as opposed to anything else.
Oil Markets
Oil prices were boosted by another more significant than expected inventories draw. But fresh in traders minds is yesterday's Bloomberg survey which indicated that the unstoppable drop in Venezuelan production is thought to have tanked OPEC overall production to a 12-month low.
While analysts prediction has been notoriously off, in a market consumed by headlines these days a few prices negative numbers flashing across the screen have a surprisingly strong impact on sentiment especially with positions so heavily skewed long.
But the uptick in equity market can't be ignored as the fear of a full-out trade wars decreases once again and gives rise to positive global growth narrative.
Gold Markets
After peaking near $ 1348, gold prices tumbled lower as Wall Street's three major indexes staged a remarkable reversal to close around 1 percent higher on Wednesday as investors turned less jittery after top economic adviser Larry Kudlow said the administration was involved in a “negotiation” with China rather than a trade war. Investors took this to mean President Trump's bark is worse than his bite when it comes to an escalation of trade wars.
Gold is holding above significant support in 1330 area as we make the turn for the key wages component of NFP. While Gold prices will remain hypersensitive to headline risk, the proximity of NFP suggest the market will hold current ranges
Currency Markets
Probably the biggest take away from all the Trade War noise is the lack of impact on currency markets other than the apparent new go to haven, the New Zealand Dollar
The Japanese Yen
USDJPY remains remarkably buoyant despite recent “risk of flux ” and talk of BOJ discussing an exit from QE. Everyone owns a few Yen, so it seems, and with “risk sentiment” bordering on overly bearish, Traders were looking to take some short dollars off the book heading into Friday's NFP. But there remains more reason to like the Yen that not as BoJ in the early stages of policy debate and risk aversion isn't leaving anytime soon. But with central bank reserve managers increasing Yen holdings, perhaps there is nothing really to fear on this crowded trade.
Making the turn towards Friday's NFP it's not inconceivable the USDJPY will trade like a beach ball underwater as the buoyant forces of physics take over.
The New Zealand Dollar
The Kiwi remains relatively insulated from all the trade war kerfuffle and immune from the slide in industrial commodities which are causing concerns on the Australian dollar front. G-10 dealers favourite play is long NZDJPY which seems to be working quite well as the risk sentiment has gotten far too bearish on trade war again.
The Malaysian Ringgit
The tariff narrative continues to frame regional risk sentiment. And with trade war concerns easing once again, this should benefit the local. Also with OIL prices firming overnight, we should see the USDMYR gravitate towards the lower end of this week very tight trading band. However, two-way flow and positions adjustments will hold the Ringgit in a close range as the market veers towards Friday's key US NFP
Eco Data 4/5/18
[php_everywhere instance="1"]
Elliott Wave Analysis: CADJPY and AUDJPY Approaching Reversal Zones!
Hello traders. Today, let's take a look at AUDJPY and CADJPY and their correlations and intra-day views.
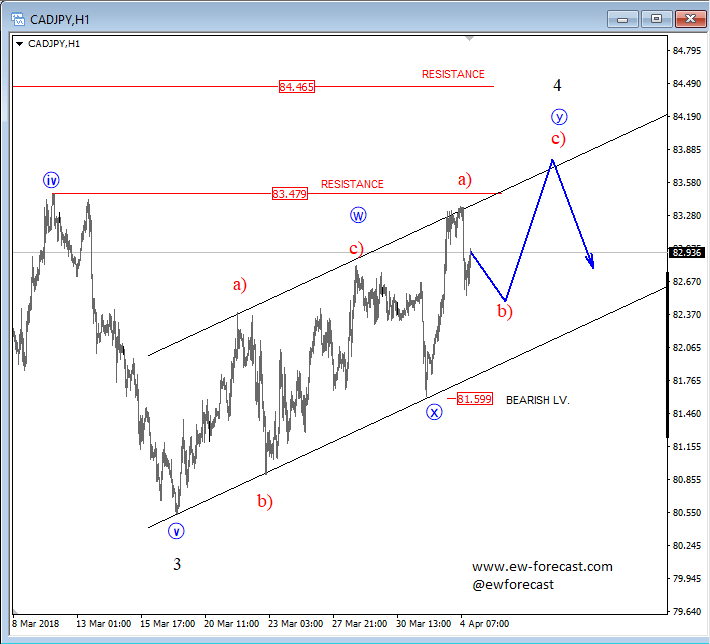
CADJPY, as you can see, is trading in a somewhat complex corrective rise away from March lows, which we labelled as a possible W-X-Y in the making. We believe this corrective rally can be part of a bigger degree wave 4, which can see resistance and a turn lower around the 83.48-84.20 region. There former swing high of former wave fours and also the upper corrective channel line can slow price down. That said, once we get a new impuslive drop from the highs, and through the 81.6 level, that is when a new bearish continuation can be in progress.
CADJPY, 1h
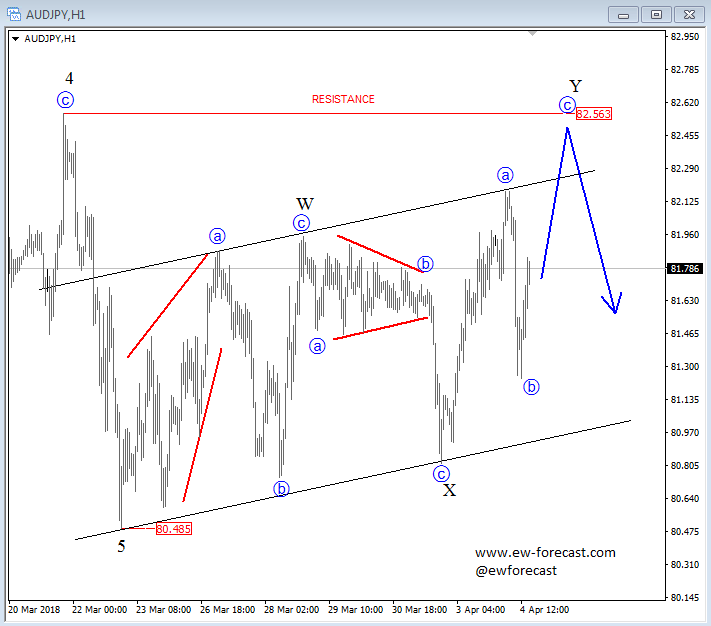
 AUDJPY also looks corrective with a complex W-X-Y structure and seems like wave c of Y is still missing and that resistance at previous wave 4 around 82.56 level can be tested before a new continuation lower comes into play.
AUDJPY, 1h
US: Non-Manufacturing Activity Continued to Expand at a Strong but Slightly Slower Pace in March
The Institute for Supply Management's (ISM) non-manufacturing index continued to ease off from its January cycle high, falling by 0.7 points to 58.8 in March, after declining 0.4 points in the month prior. The headline print came in a hair below expectations.
The underlying details of the report were mixed, with business activity (-2.2 to 60.6) and new orders (-5.3 to 59.5) giving back roughly half of the robust gains made in the prior two months.
The employment sub-index, which has seen large swings since the start of the year, improved on the month, rising 1.6 points to 56.6. The supplier deliveries index also rose 3 points to 58.5 – surpassing the previous cycle high in the aftermath of hurricanes Harvey and Irma, and rising to the highest level since 2005.
Among the remaining subcomponents, prices (61.5) and the backlog of orders (56.5) gained half a point apiece, with the latter extending the gains to three months.
The vast majority of industries reported growth on the month, with educational services and information being the only exceptions. In addition, comments from survey respondents remained upbeat with respect to business conditions.
Key Implications
The slight declines in the ISM non-manufacturing index over the past two months are certainly nothing to write home about. Nonetheless, the most important point to highlight here is the fact that the index remains near historical highs, which indicates that sectoral activity continues to expand at a very healthy pace. This narrative is further supported by broadly positive survey comments and the fact that the vast majority of industries continue to expand.
Another important element worth highlighting from today's survey is the supplier deliveries sub-index, which is now at the highest level since 2005 – indicating slower deliveries. Given that supply chain disruptions caused by hurricanes Harvey and Irma have largely eased off by now, the recent uptick in the sub-index appears to be related to stronger demand – a narrative corroborated by upbeat business activity and new orders on a trend basis.
Although concerns on the trade front have centered on the potential impact on the U.S. manufacturing sector, the non-manufacturing sector is also likely to face challenges. For instance, sectors such as transportation & warehousing and wholesale, would be indirectly affected by disruptions to manufacturing activity. At the same time, the agriculture and livestock sector would be directly impacted if China's proposed tariffs on American food products come into effect. All told, while the outlook for non-manufacturing activity remains upbeat, the proposed tariffs and retaliatory threats from trade partners pose a material downside risk to our economic outlook more broadly.