Sample Category Title
ADP Payrolls Rise More Than Expected
The British pound came under selling pressure as the construction PMI report showed a contraction as the index fell to 47.0 in March. This was below estimates of 50.9 and lower than February's 51.4. Data from the Eurozone's flash inflation estimates showed that headline consumer prices rose 1.4% on the year while core CPI was seen rising only 1.0%, less than forecasts.
In the U.S. trading session, the ADP payrolls report showed that the U.S. economy added 241k jobs in the private sector for March. February's print was also revised higher to show 246k jobs being added. The ISM's non-manufacturing PMI was a bit weaker at 58.8 just below estimates of 59.0.
Looking ahead, the economic calendar today will see the release of the services PMI data from the Eurozone and the UK. The Eurozone services sector is expected to remain steady at 55.0, unchanged from the previous month. The services sector in the UK is expected to show a decline to 53.9, down from 54.5 that was seen previously.
Currency Traders Unshaken By Equity Volatility
'We are not in a trade war with China, that war was lost many years ago by the foolish, or incompetent, people who represented the U.S. Now we have a Trade Deficit of $500 Billion a year, with Intellectual Property Theft of another $300 Billion. We cannot let this continue!' – Donald Trump.
It was an ugly start to the U.S. trading session on Wednesday. The Dow Jones dropped 379 points lower at the open and losses reached 510 points in the first minute of trading, after China threatened to impose tariffs of 25% on $50 billion of U.S. goods in response to Trump's proposed tariffs on China. Larry Kudlow, the new National Economic Council Director, told investors to not 'overreact'; he indicated that tariffs could be a negotiating tactic that might not be implemented after all. Kudlow seemed to have convinced investors that what's going on is a war of words and not a serious threat of trade war. At the end of the U.S. trading session the Dow Jones, S&P 500 and Nasdaq were up 0.96%, 1.16% and 1.45% respectively.
I still believe that the world's two largest economies will find a middle ground. Although China may feel more pain if tariffs are to be applied, Trump's political base will be severely damaged if Beijing imposed 25% tariffs on soybeans. Farmers gave Trump their votes, and he cannot pay them back by hitting their biggest importer.
Foreign exchange traders seem to be the wise guys. Despite all the tension and volatility in equities, currencies remain in a state of calm. The dollar index has been trading in a range of 89.82-90.27 for the past six days. Currency traders are focusing more on the macro picture and so far, there doesn't seem to be any significant shifts in inflation trends, growth, jobs, and thus monetary policy. It looks like currencies are fairly priced at the moment.
If I am proved wrong, and trade tensions escalated further, the Japanese Yen will be my best bet. The safe haven currency has the potential to move 5-10% higher from current levels, if the U.S. and China delivered on the recent tariffs proposals.
Friday's U.S. non-farms payrolls report would likely steal the spotlight from the trade tensions. Private companies added 241,000 jobs in March - 36,000 above average estimate. Meanwhile, the employment components of the ISM Manufacturing Index and service indices have also showed a slight improvement. These leading indicators assume the NFP report will likely surprise to the upside. However, for the U.S. dollar to see a significant move to the upside, wages should grow by 2.8% or more, which will lead to a repricing of interest rates hikes for 2018.
EUR/USD Daily Outlook
Daily Pivots: (S1) 1.2236; (P) 1.2285 (R1) 1.2318; More....
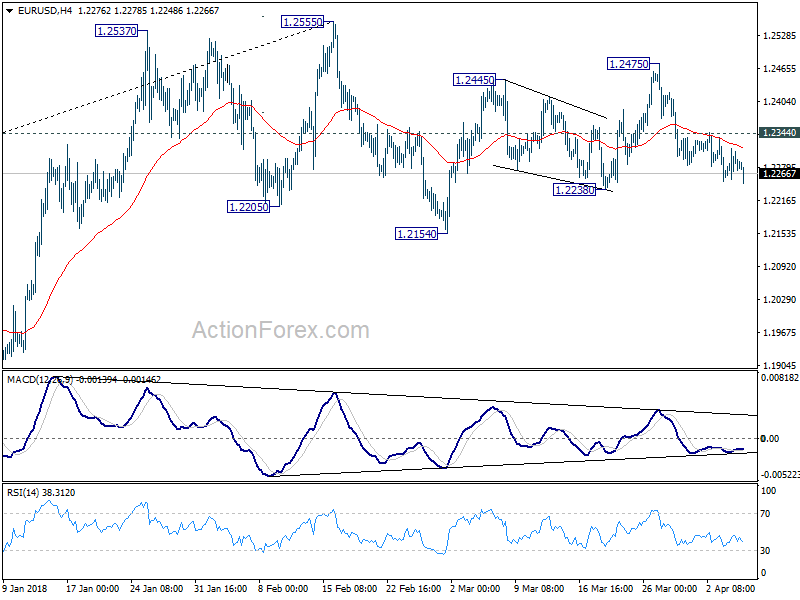
Intraday bias in EUR/USD stays on the downside for 1.2238 support first. Break will target 1.2154 support and below. Such development would confirm the rejection by 1.2516 key fibonacci resistance and pave the way to 38.2% retracement of 1.0339 to 1.2555 at 1.1708. However, break of 1.2344 minor resistance will dampen this bearish case and turn bias back to the upside for 1.2475 resistance instead.
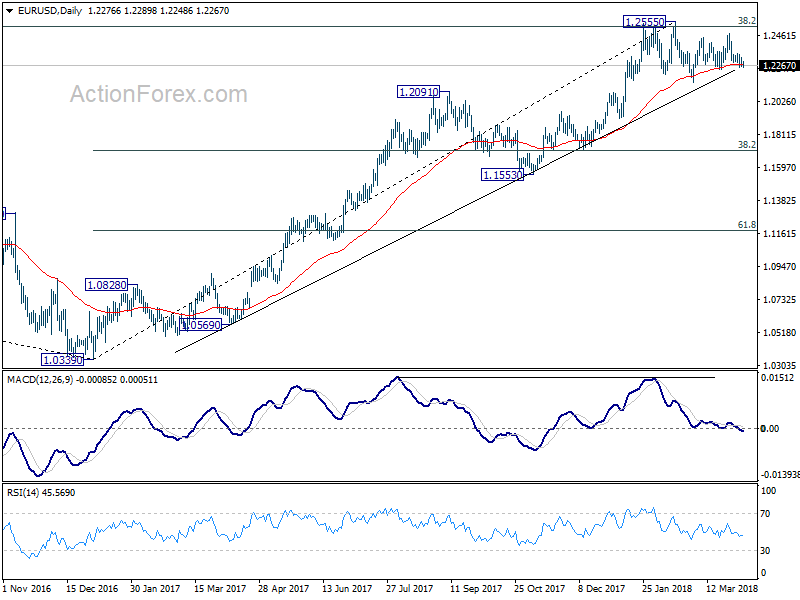
In the bigger picture, key fibonacci level at 38.2% retracement of 1.6039 (2008 high) to 1.0339 (2017 low) at 1.2516 remains intact despite attempts to break. Hence, rise from 1.0339 medium term bottom is still seen as a corrective move for the moment. Rejection from 1.2516 will maintain long term bearish outlook and keep the case for retesting 1.0039 alive. Firm break of 1.1553 support will add more medium term bearishness. However, sustained break of 1.2516 will carry larger bullish implication and target 61.8% retracement of 1.6039 to 1.0339 at 1.3862 in medium term.
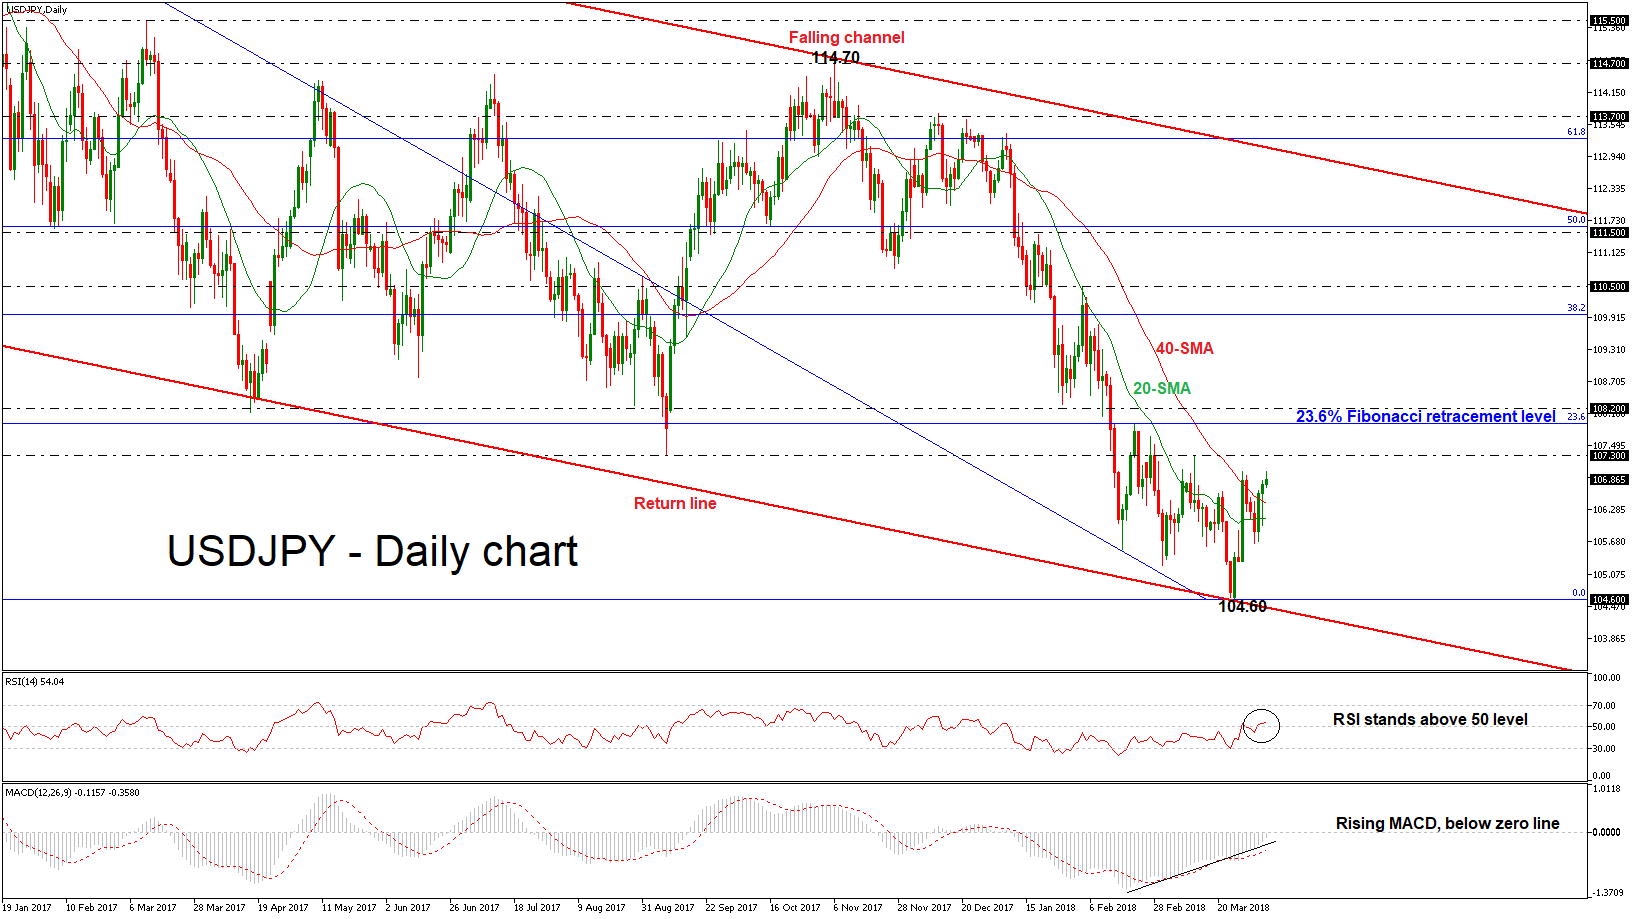
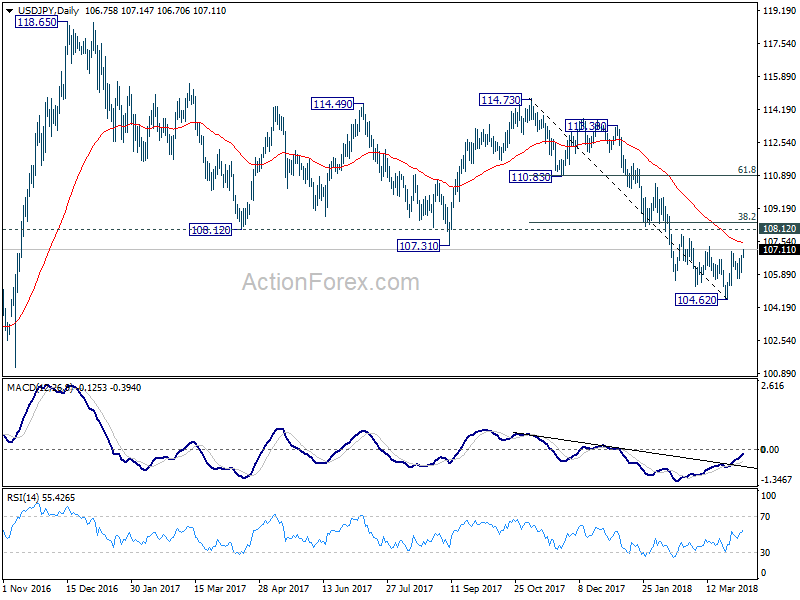
USDJPY Moves Higher After Touching Return Line Of Falling Channel
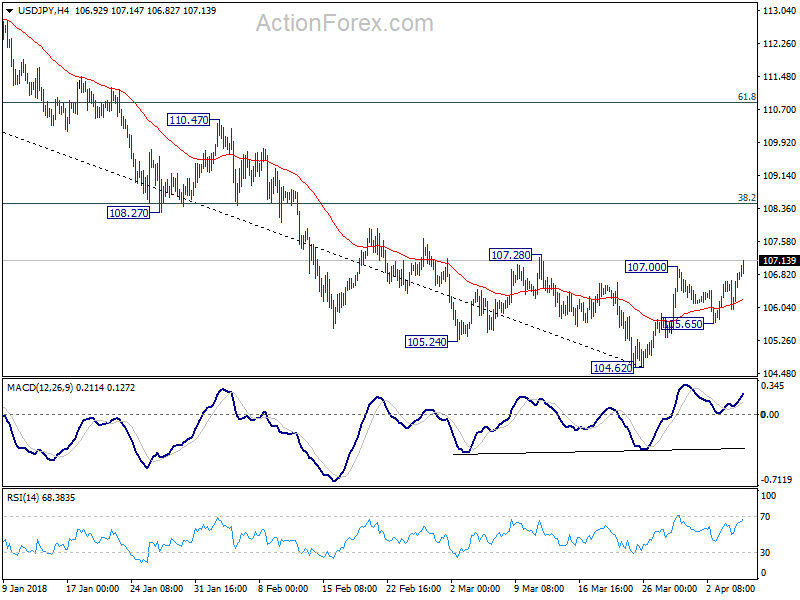
USDJPY has been overperforming in the past two days, jumping above the 20- and 40-day simple moving averages in the short-term. When looking at the bigger picture the pair has been developing within a downward sloping channel since December 2016.
During the previous week, the price found a strong support obstacle from the return line of the channel and posted a 16-month low near the 104.60 price level.
In the daily timeframe, the near-term technical indicators are bullish and point to more strength in the market. The RSI indicator surpassed the threshold of 50 and is sloping slightly to the upside, while the MACD oscillator is rising in the negative territory and is finally flirting with the zero line. As a side note, the MACD is moving well above its trigger line, indicating further gains in price.
If price action remains above the two SMAs, there is an important resistance zone near 107.30, taken from the high on March 13. Rising above this area, an immediate major barrier to the upside is the 23.6% Fibonacci retracement level of 107.90 of the downleg from 118.60 to 104.60. Breaking this level could see a re-test of 108.20.
Conversely, if the pair attempts to fall below the 20- and 40-day SMAs, then the focus would shift to the downside again towards the 16-month low. If this level is breached and the price drops below the return line, then an aggressive bearish run is expected until the 101.00 low.
GBP/USD Daily Outlook
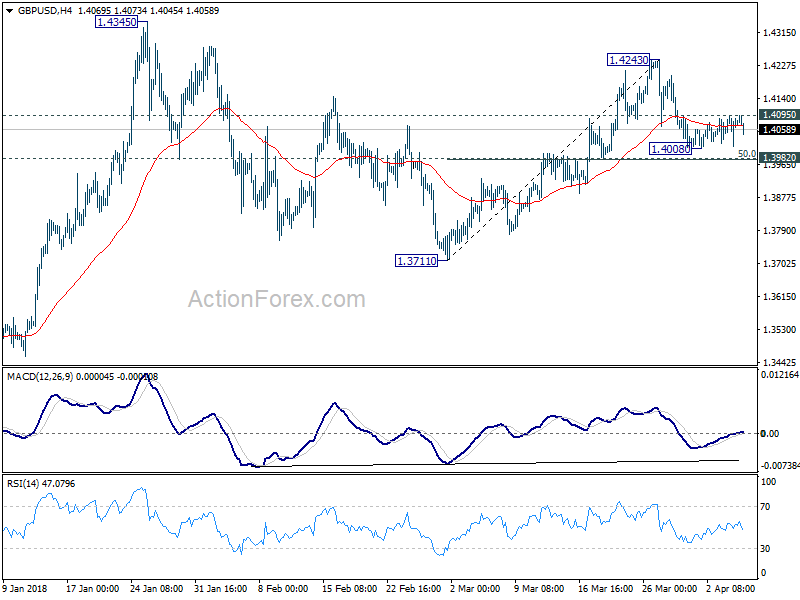
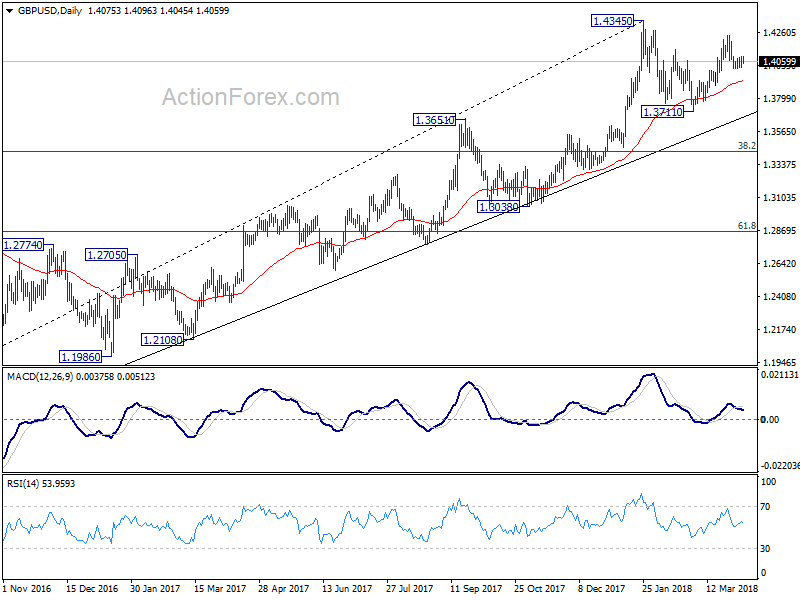
Daily Pivots: (S1) 1.4029; (P) 1.4062; (R1) 1.4112; More....
Intraday bias in GBP./USD is staying neutral as it's bounded in sideway trading above 1.4008 temporary low. On the downside, firm break of 1.3982 support will indicate completion of the rise from 1.3711. In that case, intraday bias will be turned back to the downside for retesting 1.3711. Nonetheless, strong rebound from 1.3982, followed by break of 1.4095 minor resistance will turn bias to the upside for 1.4243. Break will resume the rally from 1.3711 for 1.4345 high first.
In the bigger picture, as long as 1.3038 support holds, medium term outlook in GBP/USD will remains bullish. Rise from 1.1946 is at least correcting the long term down from 2007 high at 2.1161. Further rally would be seen back to 38.2% retracement of 2.1161 (2007 high) to 1.1946 (2016 low) at 1.5466. However, GBP/USD fails to sustain above 55 month EMA (now at 1.4259) so far. Break of 1.3038 support, will suggest that rise from 1.1946 has completed and will turn outlook bearish for retesting this low.
USD/CHF Daily Outlook
Daily Pivots: (S1) 0.9568; (P) 0.9590; (R1) 0.9628; More...
USD/CHF's rebound from 0.9186 extends today and reaches as high as 0.9629 so far. It's now pressing 0.9626 key fibonacci level. For now, we's still seeing the rebound as a corrective move. Hence, strong resistance should be seen at 0.9262 to bring reversal. On the downside, break of 0.9521 will turn bias back to the downside for 0.9432 support. Break there will indicate near term reversal and completion of rebound from 0.9186. However, sustained break of 0.9626 will be another evidence of larger reversal. In this case, further rise would be seen to next fibonacci level at 0.9900.
In the bigger picture, fall from 1.0342 is seen as a medium term down trend. Main focus is on 38.2% retracement of 1.0342 (2016 high) to 0.9186 (2018 low) at 0.9626. Sustained break there will add to the case of trend reversal and target 61.8% retracement at 0.9900 and above). However, rejection from 0.9626 will maintain medium term bearishness for another low below 0.9186.
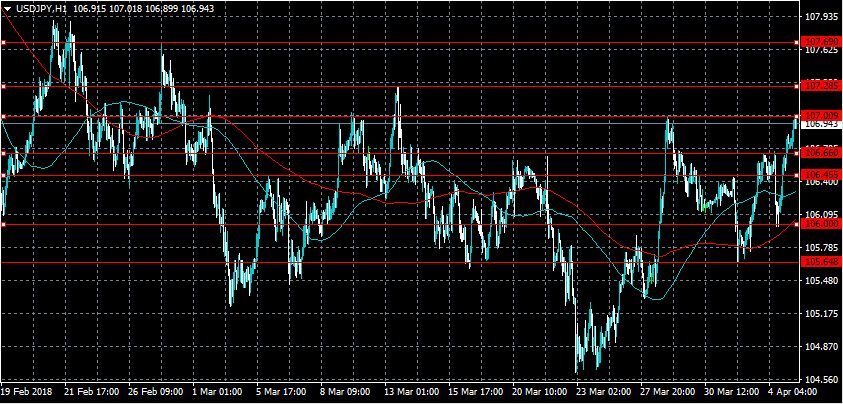
USDJPY Pair Intraday Bullish Above 106.60
The U.S dollar continues to move higher against the Japanese yen currency, following better than expected U.S jobs data and a rebound in global equity markets. The USDJPY pair currently trades close to the 107.00 level, after finding strong dip-buying demand from then 106.00 support level on Wednesday. Traders now look to key break-out resistance at the 107.28 level, while stronger global equity markets may support a move into riskier asset classes.
If the USDJPY pair retains its bullish bias while trading above the 106.60 level, key technical resistance is then found at the 107.28 and 107.69 levels.
A move below the 106.60 level may support downside pressures on the USDJPY pair, with sellers pushing price-action back towards the 106.45 and 106.30 levels.
USD/JPY Daily Outlook
Daily Pivots: (S1) 106.22; (P) 106.53; (R1) 107.08; More...
USD/JPY rises to as high as 107.14 so far today. break of 107.00 indicates resumption of rebound from 104.62. Intraday bias is back on the upside for 38.2% retracement of 114.73 to 104.62 at 108.48. At this point, there is no confirmation of trend reversal yet. Hence, we'll look at the reaction from 108.48 (which is close to 108.12 too) to assess the chance. On the downside, below 105.65 support will indicate that the rebound is completed and turn bias back to the downside for 104.62 and below.
In the bigger picture, medium term down trend from 118.65 (2016 high) is still in progress and extending. Build up in downside momentum argues that it might be extending the whole corrective pattern from 125.85 (2015 high). 100% projection of 118.65 to 108.12 from 114.73 at 104.20 will be a key level to watch as firm break there could bring downside acceleration. And in that case, 98.97 key support level (2016 low) would at least be breached. This bearish case will now be favored as long as 108.12 support turned resistance holds.
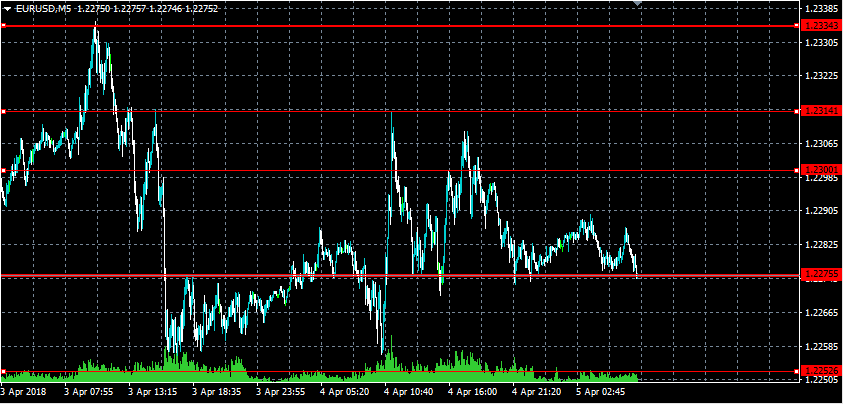
EURUSD Losses Likely Below Key Support
The euro remains under selling pressure against the greenback in early Thursday trading, following better than expected U.S economic data and continued strength in the U.S dollar index. The EURUSD pair currently sits around the 1.2275 support level, with intraday buying interest in the single currency currently muted. Traders now look towards the release of March Manufacturing and Retail Sales data from the Eurozone economy.
The EURUSD pair is strongly bearish whilst trading below the 1.2275 level, short-term support is currently located at the 1.2252 and 1.2239 levels.
If the EURUSD pair holds above the 1.2275 level, buyers will likely test towards the 1.2300 and 1.2314 resistance levels.
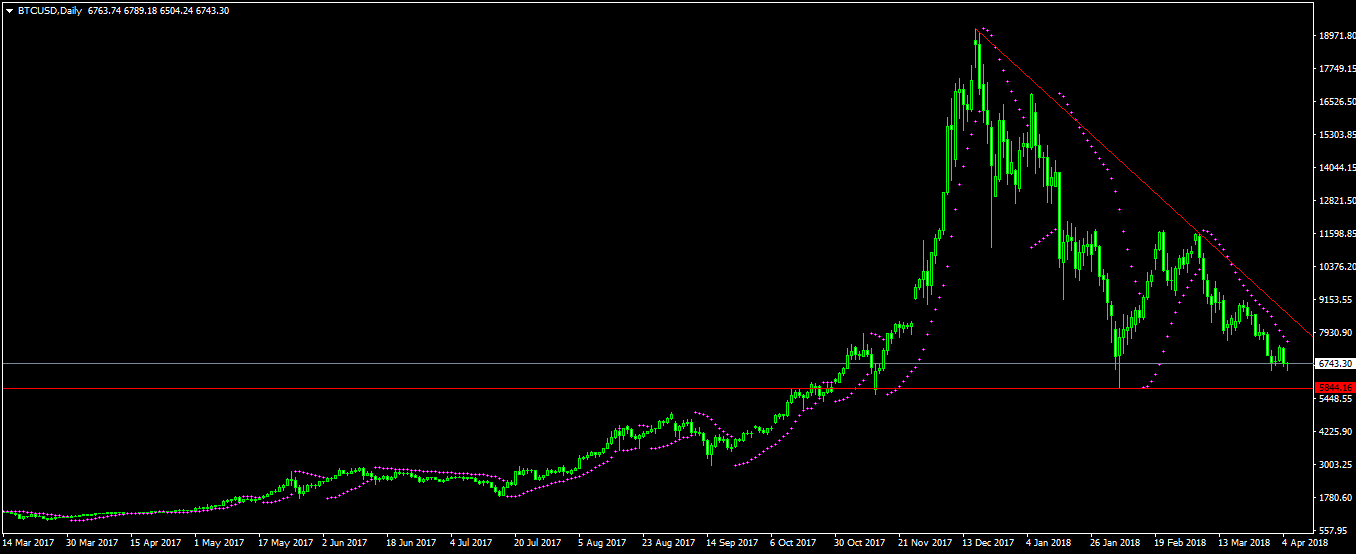
Bitcoin Continues To Slide As Media Updates Continue
Bitcoin is currently trading below the $7,000, which is the lowest level since last week. This price, which is 65% lower than its December highs could continue to deteriorate.
How did we get here? It all started early last quarter when South Korea announced that it would crack down on bitcoin exchanges. Then came the bankruptcies of key exchanges like YouBit, and the problems with Coindesk. Regulators from other countries too like China, Japan, and United States announced that they would place regulations in the industry.
Then came Facebook. In February, the company announced that it would ban all cryptocurrency related ads. Google and Twitter followed. Without these platforms, blockchain developers had no way of marketing their products because the three companies control more than 90% of all online marketing.
Financial services companies like Visa, MasterCard, and PayPal too entered the scene and made it difficult for people to buy and sell cryptocurrencies.
Finally, in the community, it became clear that bitcoin did not do what it had been envisioned to do. The whitepaper that gave us bitcoin promised to lower the costs of transactions, increase the speed, and increase anonymity. All these facts were debunked in the quarter when even a bitcoin conference stopped accepting payments in bitcoin.
As such, bitcoin’s bearish moves continue. As shown below, bitcoin is closing in on $5,844, which is the lowest level since February this year. A move below this point could see it continue to slide as longs exit their positions.