Sample Category Title
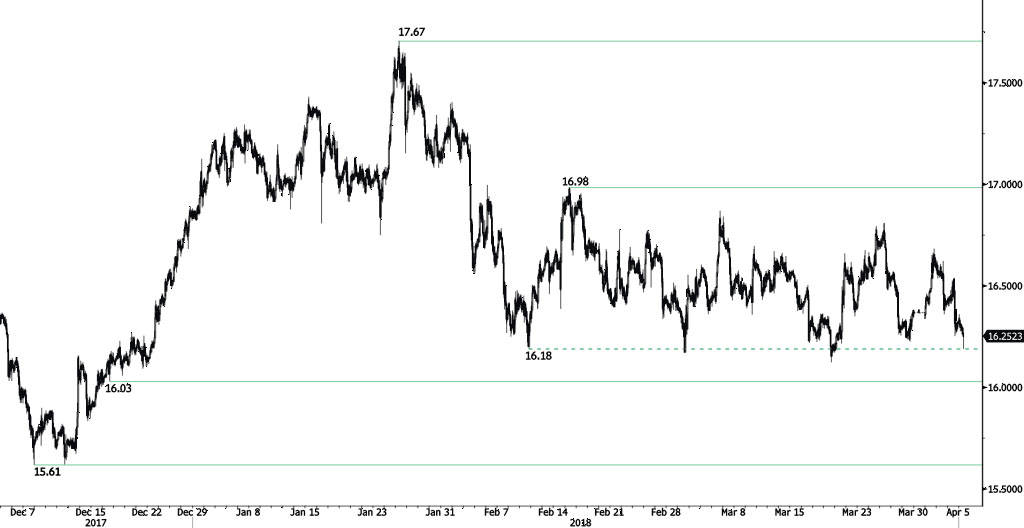
SILVER Decline
Silver rising momentum stopped, the pair is now testing 16.20 following recent rise at 16.54. Silver is currently contained between hourly support and resistance given at 16.03 (18/12/2017 low) and 16.98 (15/02/2018 high). The short-term technical structure suggests downward moves.
In the long-term, the trend remains negative/ sideways. Further downside is very likely. The pair is trading below its 200 DMA. Resistance is located at 21.58 (10/07/2014 high). Strong support can be found at 11.75 (20/04/2009).
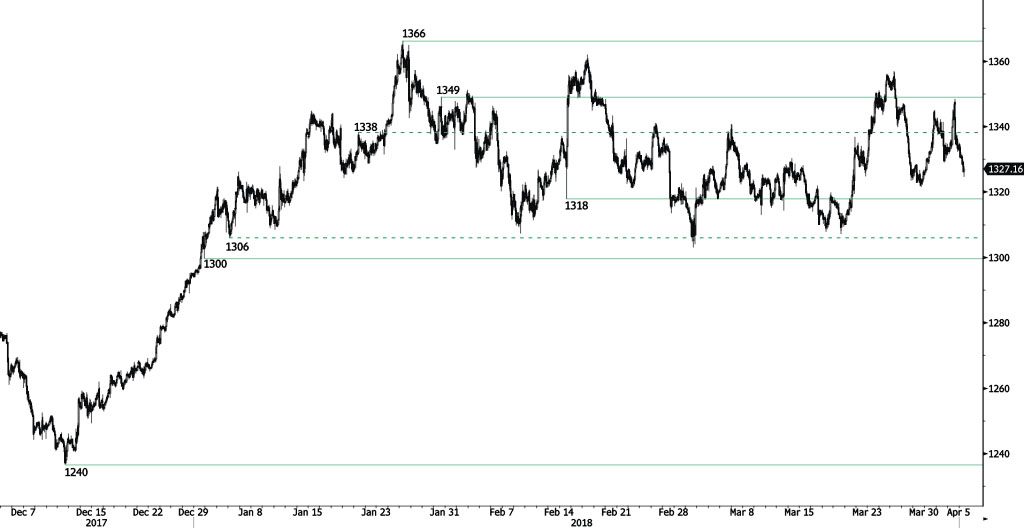
GOLD Descent After Failing To Reach Resistance At 1349
Gold strong selling pressures push the precious metal pair below 1330, approaching 1321 low (30/03/2018). Gold is expected to head along the 1325 range. Hourly support and resistance are given at 1318 (14/02/2018 low) and 1349 (30/01/2018 high) The technical structure suggests short-term decrease.
In the long-term, the technical structure suggests that there is a growing upside momentum. A break of 1'392 (17/03/2014) is required to confirm it. A major support can be found at 1'045 (05/02/2010 low).
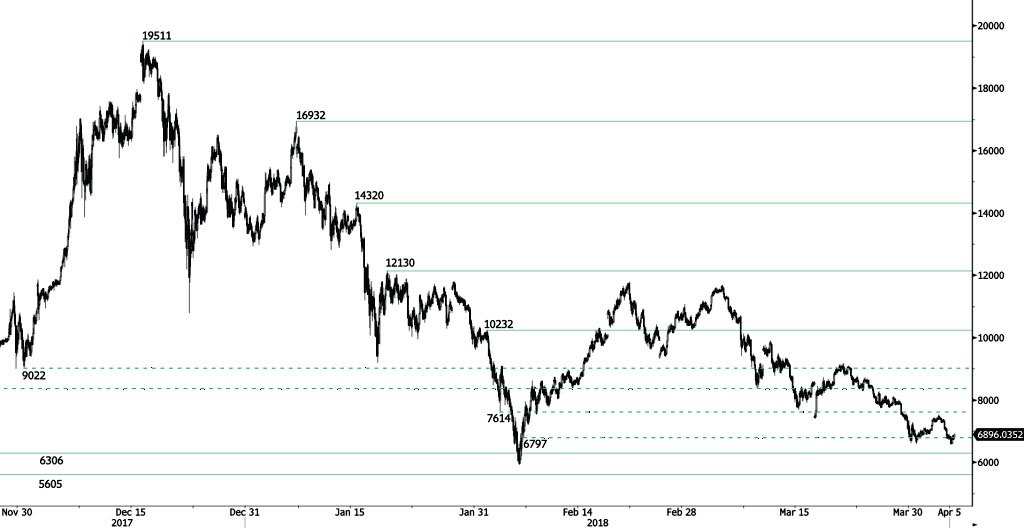
BITCOIN Testing The 7000 Range
Bitcoin is trying to bounce from 6579 low, approaching the 7000 range. Bitcoin bearish pattern started in March 2018 continues. The pair is contained between hourly support and resistance given at 6306 (13/11/2017 low) and 10232 (01/02/2018 high). The technical structure suggests short-term sideways trading moves.
In the long-term, the digital currency has had an exponential growth but also presented important downturns. There is decent likelihood that the currency could stabilize between 7'000 - 12'000 in 2018. Bitcoin is trading below its 200 DMA (7500 range).
EUR/CHF Bearish Consolidation
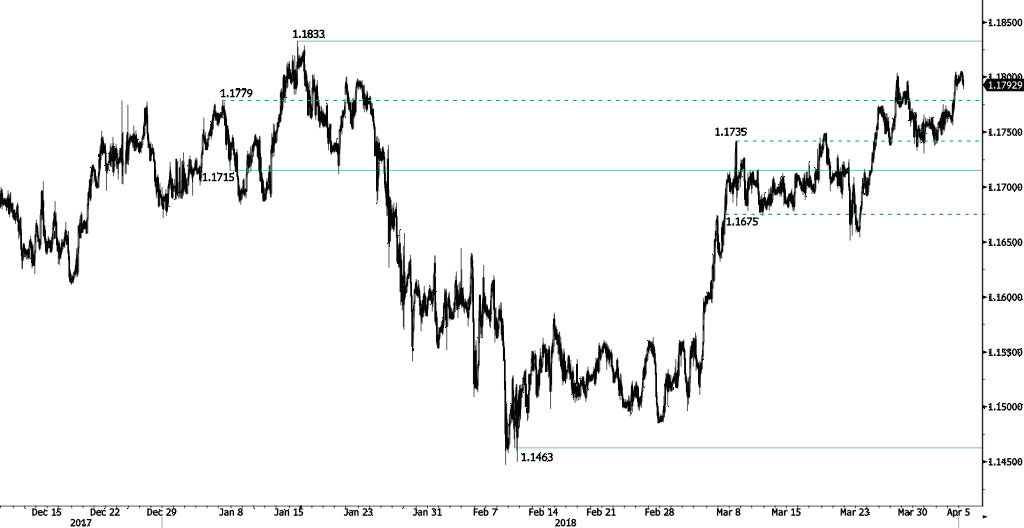
EUR/CHF consolidation phase continues, trading at the edge of 1.18 and expected to head along the 1.1792 range. Hourly support and resistance are given at 1.1715 (07/01/2018 low) and 1.1833 (15/01/2018 high). The shortterm technical structure suggests further shortterm sideways trading moves.
In the longer term, the technical structure has reversed. Strong resistance is given at 1.20 (level before the unpeg). Yet, the ECB's slowing QE program is likely to cause buying pressures on the euro, which should weigh in favour of the EUR/CHF. Support can be found at 1.0234 (20/04/2015 low).
EUR/GBP Increasing
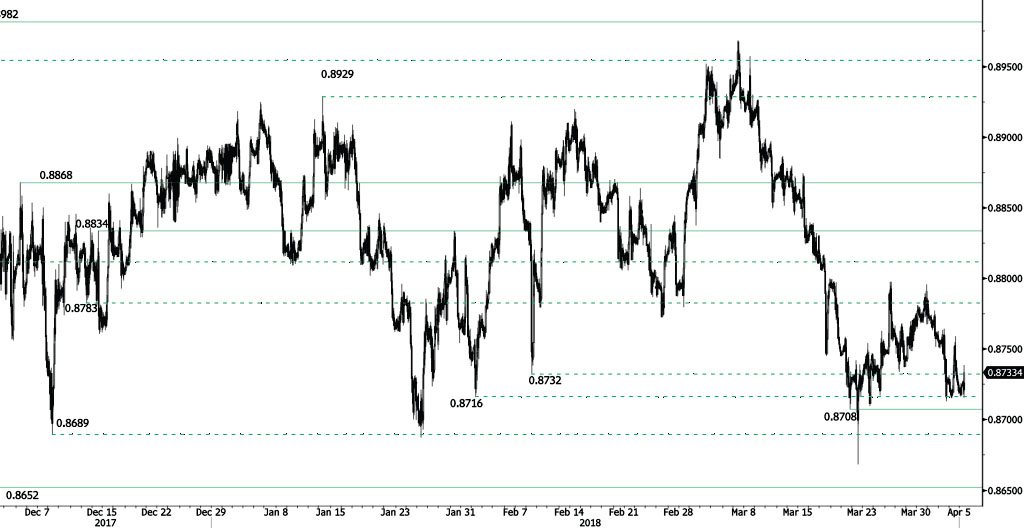
EUR/GBP is bouncing off from 0.8716 low, trading above 0.8730 and heading along the 0.8740 range. EUR/GBP bearish pattern started in March is maintained. Hourly support and resistance are now given at 0.8708 (21/03/2018 low) and 0.8834 (14/12/2017 high). The technical structure suggests short-term increase.
In the long-term, the pair has largely recovered from 2015 lows. The technical structure suggests further upside pressure. Strong resistance can be found at 0.9500 (psychological level) while support remains at 0.8304 (05/12/2016 low). The pair is trading below its 200 DMA.
China Announced Tariff on US Soybean Exports. What Next?
US-China trade friction aggravated as China on April 4 announced the second round of retaliation, immediately after US revelation of a list of about US$ 50B worth of made-in-China products that are subject to 25% tariffs. The first round of the retaliatory tariff, involving US$ 3B worth of US exports to China (including pork, fruits, and wine), took into effect earlier this week. Now, products involved in China’s latest round, including soybean, aircraft, and autos, appear more important to US exports. Statistics show that soybean, autos and aircrafts account for about 11%, 8% and 7%, respectively, of US exports to China in 2017. As we mentioned in the previous report, China regards tariff on US soy exports as a “super bomb” as about 60% of US exports of which goes to China. However, China also puts its own industries at risk US soybeans take up about one-third of Chinese soybean imports. The tariff would inevitably raise the cost of some Chinese producers. For instance, prices of pork, for which soybean is a key input, would likely increase. Therefore, this is an internecine scenario. We notice that the Chinese government has not specified the effective day of the tariffs due to the potentially adversary impacts on its domestic producers. As far as the recent developments are concerned, we continue to view the threats from both sides as bargaining chips for upcoming trade negotiations.
Announcement of soybean tariff came earlier than we, as well as the majority of market participants, had anticipated. What else can China do after this weapon has already been used? Some suggest that China can shift from tariff to financial markets, e,g.: to deliberately depreciate renminibi and reduce purchase of US government bonds.
Renminbi Depreciation
For decades, the US has been dissatisfied with depreciation of renminbi. Indeed, Donald Trump in his election campaign vowed to label China a currency manipulator after he has got elected. However, the President has not failed from doing so since he has taken office.
The US Treasury Department decades ago lain down three criteria for a country to be classified as a currency manipulator: 1) it has a significant bilateral trade surplus with the US (over US$ 20B), 2. It has a current account surplus of more than 3% of GDP, and 3. It buys foreign assets of 2% of output to weaken currency. With China registering a record trade surplus of US$ 375B with the US last year, the first criterion is met. Managed appreciation in renminbi has shrunk china’s current account surplus to consistently below 3% of GDP since 2016. Meanwhile, the one-off devaluation of renminbi in 2015 has triggered capital outflow from China. The authority needed to aggressively sell foreign reserve and implement various capital control measures in support of renminbi’s valuation. These actions have only eased over the past two years as renminbi stabilized. These suggest that both the second and third criteria are not met and the US is unwarranted to label China a currency manipulator under the current environment. Nonetheless, the US remains wary of relative weakness of renminbi, deeming it a key reason for cheap Chinese exports and thus US massive trade deficit. As such, threatening to devalue renminbi might be another bargaining chip for China.
We think that this move might hurt China as much as, if not more than, it hurts the US. Since the abrupt announcement of a one-off, 2% renminbi devaluation in August 2015, domestic and international market has lost confidence over the currency and the government’s policy stance. The consequential severe selloff renminbi caused the PBOC to aggressively sell foreign reserve in support of renminbi. The chart below shows that the country’s FX reserve contracted an aggregate of US$830B in 2015 and 2016, coincidental to the 12% depreciation of renminbi, Meanwhile, the government also implemented a number of capital control measures. For instance, some banks forbid customers from buying foreign currency for property, securities and life insurance, banks are requested to report any overseas transfers by individuals of US$10 000 or more, banks are required to buy back renminbi worth of CNY 100 if they allow customer to remit CNY 100 overseas. Only since last year has renminbi shown stabilization and we expect the government to be vigilant against the movement of its currency and avoid triggering a fresh round of capital outflow.
Reduction in US Bonds Purchase
As the biggest foreign holders of US Treasury, China has for a number of times revealed the intention to reduce US bond buying. However, we believe this is impractical. Criticism about the credibility of the US dollar has persisted since the breakdown of the Bretton Woods system in 1970s, only to intensify as former Fed Chair Ben Bernanke began QE, virtually printing money, to support US economy after the global financial crisis. Nonetheless, US dollar’s status as the world’s dominant reserve currency has remained unchallenged, although its composition in global FX reserve has decreased to 63% last year from over 70% in the beginning of this century. China, no different from other countries, is obliged to accumulate US dollar, with the most convenient channel being purchases of US Treasuries, for various kinds of financial transactions. China’s unilateral boycott of US Treasury would not be effective in countering the US.
As tensions between the world’s two biggest trading partners continue to evolve, the Office of the United States Trade Representative has scheduled a public hearing on the tariff issues on May 15 as US companies might raise their post-hearing rebuttal comments in the week after. Meanwhile, China’s Xi Jinping will deliver a speech at the opening ceremony of the annual Boao Forum hosted in Hainan on April 10. Xi would likely take this opportunity to complain about US trade protectionism as well as to reveal more measures to open its domestic markets to other trading partners.
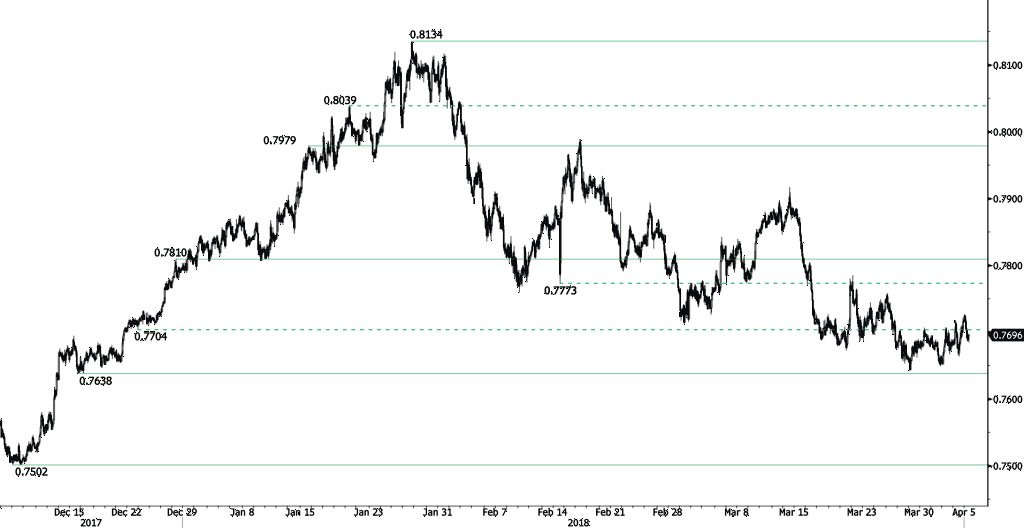
AUD/USD Edging Lower
AUD/USD bouncing move stops, decreasing from 0.7727 high and heading along the 0.7685 range. Hourly support and resistance are given at 0.7638 (15/12/2017 low) and 0.7810 (28/12/2017 high). The technical structure suggests short-term decrease.
In the long-term, the upward trend slows down after failing to reach key resistance at 0.8164 (14/05/2015 low). Key support stands at 0.6009 (31/10/2008 low). A break of the key resistance at 0.8164 (14/05/2015 high) is needed to invalidate our long-term bearish view.
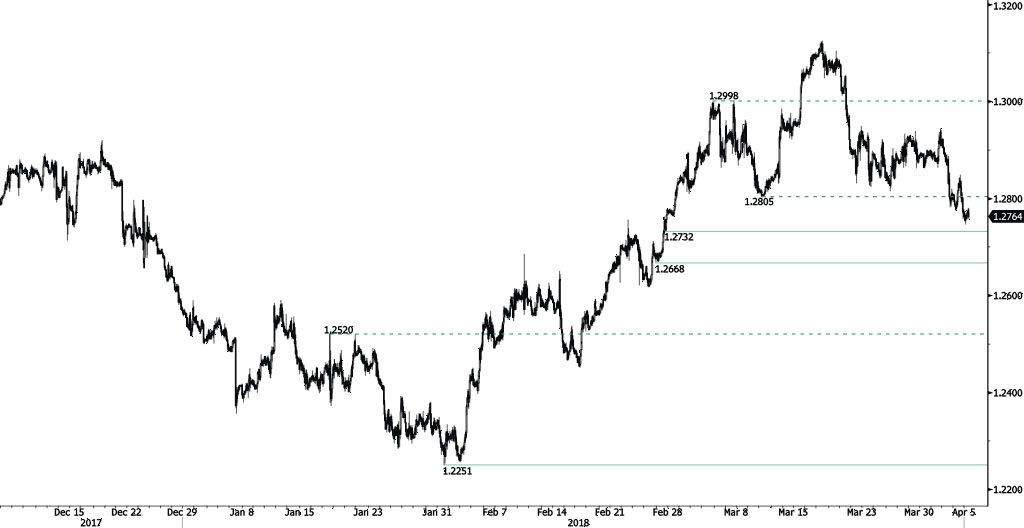
USD/CAD Sideways Price Action Above Hourly Support At 1.2732
USD/CAD sideways trading continues, currently trading at the 1.2770 range. Hourly support and resistance remain at 1.2732 (27/02/2018 low) and 1.3308 (23/06/2017 high). The short-term technical structure suggests further short-term sideways trading moves.
In the longer term, the pair is trading between resistance point at 1.3805 (05/05/2017 high) and support at 1.2128 (18/06/2015 low). Strong resistance is given at 1.4690 (22/01/2016 high). The pair is likely to head lower. The pair is trading above its 200 DMA.
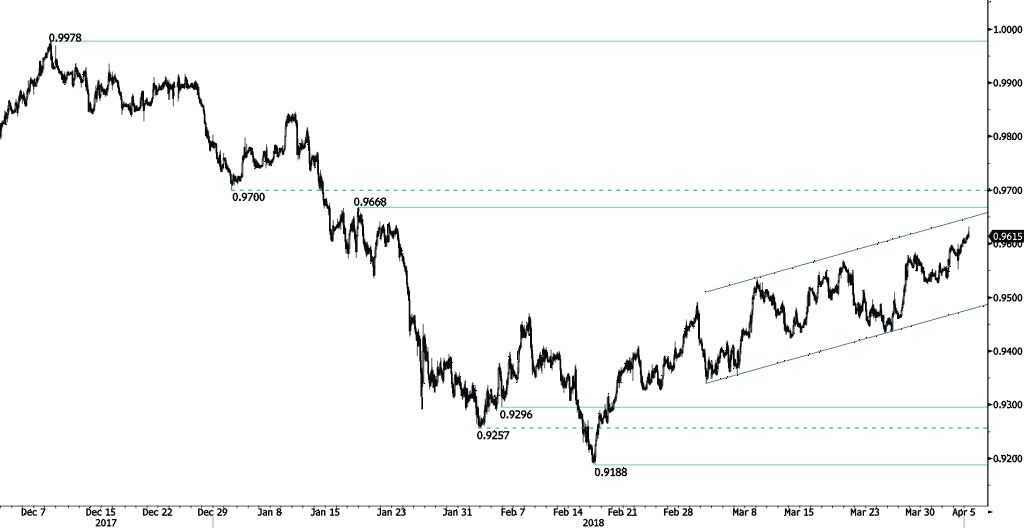
USD/CHF Continued Rise
USD/CHF rise continues, approaching the upper bound of the upward trend channel and currently trading above the 0.96 range. Expected to head along the 0.9625 range. The bullish pattern started from 0.9188 (16/02/2018 low) continues. The pair is contained between hourly support and resistance given at 0.9296 (05/02/2018 low) and 0.9668 (17/01/2018 high). The technical structure suggests short-term downward moves.
In the long-term, the pair is still trading in range since 2011 despite some turmoil when the SNB unpegged the CHF. Key support lies at 0.9072 (07/05/2015 low) while resistance at 1.0344 (15/12/2016 high) is distanced. The technical structure favours a long term bullish bias since the unpeg in January 2015.
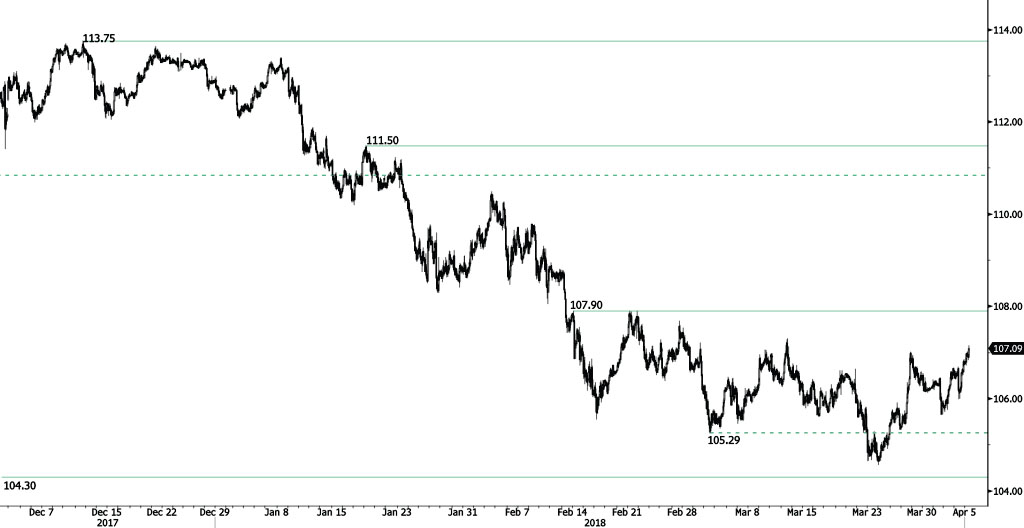
USD/JPY Trading Above 107
USD/JPY bullish momentum continues after reaching 107. approaching hourly resistance at 107.90 (14/02/2018 high). Expected to head along the 107.30 range. The bearish pattern started in January 2018 is maintained. The shortterm technical structure suggests short-term increase.
We favor a long-term bearish bias. Support remains at 101.20 (09/11/2016 low). A gradual rise toward the major resistance at 125.86 (05/06/2015 high) seems unlikely. Expected to decline further support at 101.20 (09/11/2016 low). The pair trades largely below its 200 DMA.