Sample Category Title
USD/JPY Returns To Three-Week High
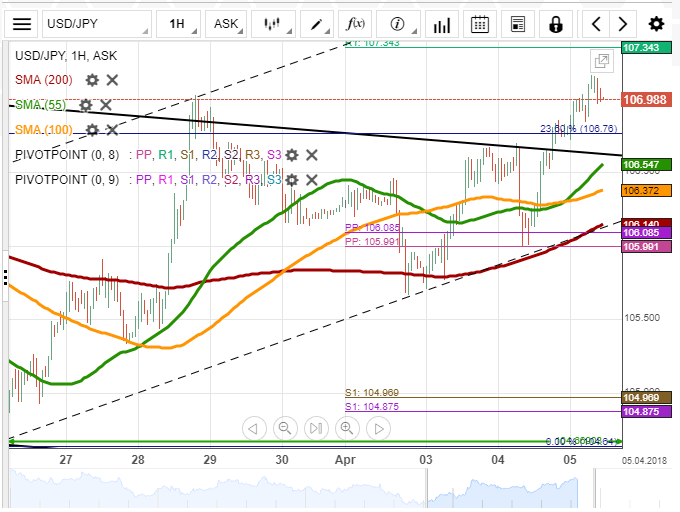
The US Dollar continues moving in a narrow ascending channel against the Yen. The pair's movement during this time has been supported by the 55-, 100– and 200-hour SMAs. The pair even breached the prevailing two-month channel down and reached its three-week high of 107.00 by early Thursday.
It is likely that the Greenback tries edging higher during the following hours, setting the weekly and monthly R1s circa 107.50 as a possible upside target. However, it seems that bulls might soon exhaust their pressure and therefore allow the bearish sentiment to take over the market once again.
In line with this scenario, the rate should return near the support of the 55– and 100-hour SMAs or, in case this level is breached, the weekly and monthly PPs and the 200-hour moving average near 106.00.
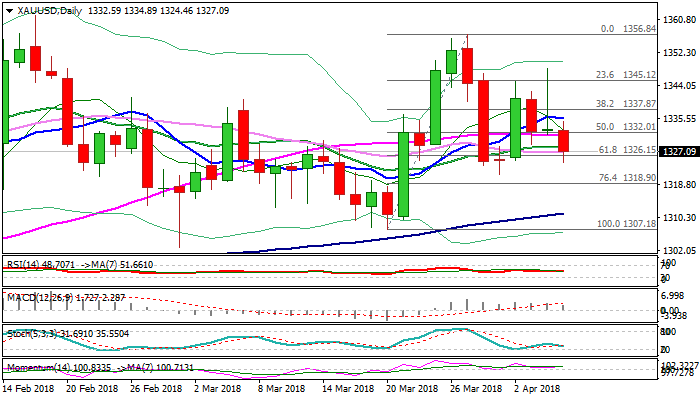
XAU/USD Returns To Senior Channel
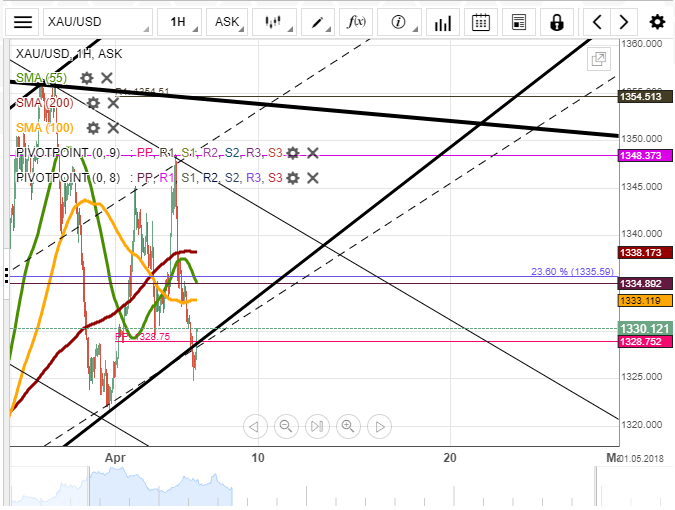
The first part of Wednesday's trading session was spent in a calm manner, as the yellow metal was moving along the 55-hour SMA.
A strong surge mid-session pushed the pair 0.94% higher towards its one-week high of 1,348.00. These gains, however, failed to remain for long, as the prevalence of strong downside risks resulted in a plunge back down to the monthly PP and the senior channel at 1,330.00.
Technical indicators demonstrate that this bearish sentiment could allay during the following hours, thus allowing for a slight recovery. Gains are likely to be limited due to the massive resistance cluster formed by the 55-, 100– and 200-hour SMAs and the 23.60% Fibo located near 1,337.00. This area might eventually be breached during the remaining part of this trading week.
Forex Analysis: EURGBP And AUDJPY
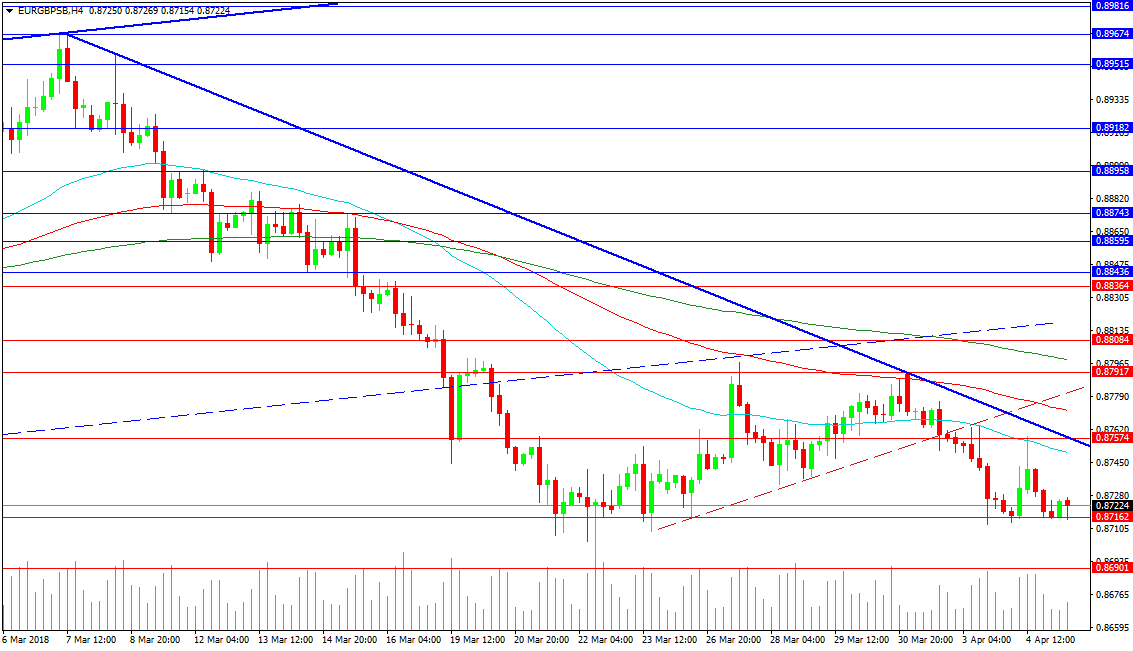
EURGBP is remaining in a down trend in the 4-hour time frame. The trend line is intact after its 3rd test last week and is currently forming resistance at 0.87574. The Moving averages are falling in line with the trend line, with the 50 MA at 0.87500 and the 100 MA at 0.87718. A previous trend line, in red, broke earlier this week, leading to a push lower to 0.87100 and this broken trend line is now acting as resistance at 0.87805. The 200 MA is sandwiched between 0.87917 and 0.88084 at 0.87973. There is a longer-term trend line at 0.88174, shown here as the broken blue line. A move above this line targets 0.89000 and 0.89674.
While the price remains in a down trend below the Blue trend line the immediate support level at 0.87162 remains in focus. A loss of this level targets 0.86901, with the low from March at 0.86665. A loss of this low would create a lower low and open the way to 0.85000.
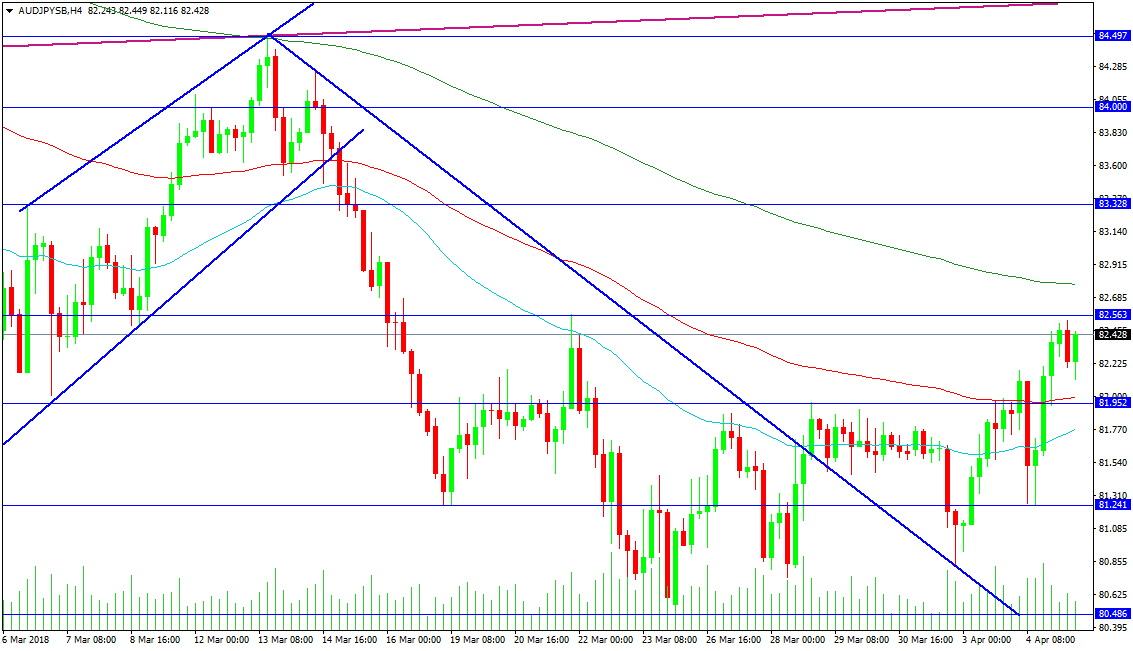
AUDJPY
The pair has run in to retest trend line resistance at 84.497 after breaking under the line in February. This failed move higher resumed the trend lower, with the last week of trading partially retracing some of this move. The minor down trend broke on the 28th of March, with a retest on the 2nd of April that offered an excellent counter-trend move from 80.850 up to the current level of 82.428. Resistance is found at 82.563, followed by 82.775. The 6th of March high is found at 83.328, with the 84.000 level standing on the path to 85.000 and a retest of the trend line at 84.700.
Support comes with the 100 MA at 81.990 and the 81.952 level. The 50-period MA is at 81.770 currently, with the 81.240 level tested twice over the last three weeks. Below this level, a retest of support at 80.486 is on the cards. This can open the way to 80.000 with the 79.162 level below.
US Futures Build On Wednesday’s Impressive Bounce
- Wall Street Seen Adding to Wednesday’s Rebound;
- US Trade Data of Interest Given Current Environment;
- Weaker European Services Surveys Nothing To Be Concerned About.
'Investors are expressing confidence that a solution will be found before a full blown trade war erupts'
After staging a strong recovery on Wednesday, US equity markets are poised to open in the green once again on Thursday as investors temporarily shrug off trade war fears.
The bounce on Wednesday was really quite impressive, especially as there was not much of a catalyst for the turnaround given that neither the US or China is backing down on tariffs and negotiations were always going to take place in the background. Perhaps the fact that indices were once testing levels that had previously been bought on a few occasions over the last couple of months had something to do with the sudden desire to jump back in.
The reality is that a trade war remains a real possibility. US President Donald Trump is looking to pick a fight with the world’s second largest economy, a fight he believes is easy to win, and China is willing to go toe to toe with the US even if it means inflicting harm at home. It’s hard to see how anyone wins in this but investors currently, despite the declines we’ve seen, are expressing confidence that a solution will be found before a full blown trade war erupts.
'Given the strength of the surveys previously, I don’t think this is anything to be concerned about though and this has been reflected by the muted reaction to the releases in the markets'
Thursday is shaping up to be one of the quieter days of the week from a US perspective, possibly the calm before the storm that is the US jobs report. The trade balance data really stands out for the US today, more so from a headline perspective than something that will likely be particularly market moving. Jobless claims is the only other notable release although we will also hear from Raphael Bostic, a voting member on the FOMC this year who supports gradual rate hikes and a move back to the neutral rate.
There’s been plenty of economic data already from the Europe this morning, with services PMIs from across the region for March being released, as well as retail sales figures for the euro area. As was to be expected, we did see a slowdown in the surveys driven by a number of factors, most notably bad weather and supply side constraints.
Given the strength of the surveys previously, I don’t think this is anything to be concerned about though and this has been reflected by the muted reaction to the releases in the markets. The euro is off only slightly on the day while the pound is down around 0.2% against the dollar. Still, they’re both not far from their recent highs against the dollar, which has done better the last couple of weeks but is struggling to break significantly off its lows.
Forex Technical Analysis: EUR/USD, USD/JPY, GBP/USD
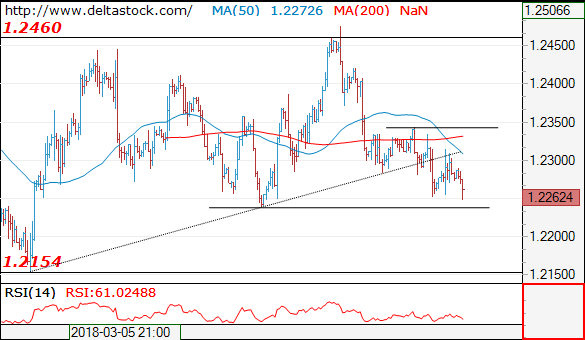
EUR/USD
Current level - 1.2262
Expect a break through 1.2240 to challenge 1.2160 area. Crucial on the upside is 1.2340 high.
| Resistance | Support | ||
| intraday | intraweek | intraday | intraweek |
| 1.2340 | 1.2560 | 1.2240 | 1.2160 |
| 1.2340 | 1.2560 | 1.2160 | 1.2090 |
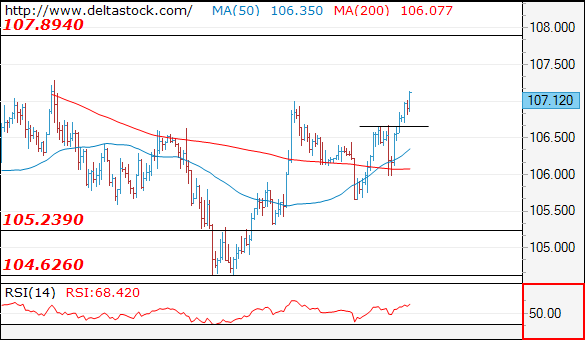
 USD/JPY
Current level - 107.12
The uptrend is intact, heading towards 107.90 hurdle. Initial minor support lies at 106.60 and crucial is 106.00 low.
| Resistance | Support | ||
| intraday | intraweek | intraday | intraweek |
| 107.90 | 108.30 | 106.60 | 105.20 |
| 108.30 | 110.40 | 105.60 | 104.60 |
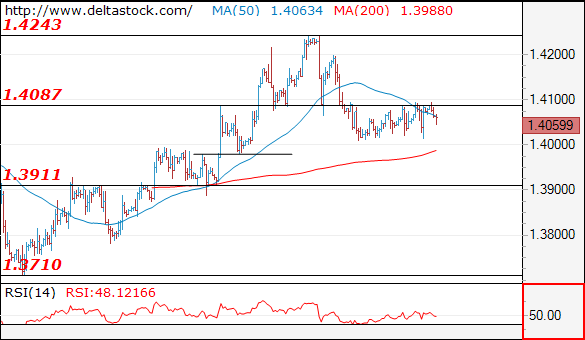
 GBP/USD
Current level - 1..4060
Nothing new here, as the overall outlook is still bearish below 1.4090, for a slide towards 1.3910 area.
| Resistance | Support | ||
| intraday | intraweek | intraday | intraweek |
| 1.4090 | 1.4280 | 1.4020 | 1.3710 |
| 1.4240 | 1.4340 | 1.3910 | 1.3620 |
Dollar Looks To Jobs Data & Fed Chair Powell’s Speech For Direction
Friday is almost guaranteed to bring fresh volatility to the US dollar, which has been trending sideways since the middle of January. Not only will the US release its all-important employment data for March at 1230 GMT, but a few hours later at 1730 GMT, Fed Chairman Jerome Powell will deliver remarks on the economic outlook, and investors will be hanging on his lips for any fresh policy signals.
In March, nonfarm payrolls are forecast to have risen by 195k, after a surprisingly strong 313k in February. The unemployment rate is projected to have ticked down to 4.0% from 4.1% previously, bringing it to a low last seen in 2000. Meanwhile, average hourly earnings are expected to have accelerated to 2.7% year-on-year, from 2.6% in the previous month.
As has been the case with recent US jobs reports, investors are likely to focus predominantly on the earnings numbers – assuming of course that there are no major surprises in nonfarm payrolls or the unemployment rate. Recall that back in early February, a surprising acceleration in wages was among the factors that triggered the turmoil in financial markets – resulting in a sharp selloff in stocks and a modest recovery in the dollar, which up until that point was plunging.
Wage growth is one of the most important indicators, for central bankers at least, because it is considered a precursor to inflation. Economic theory proposes that in a tight labor market, as is the case with the US now, companies will encounter difficulties finding skilled workers, and will need to raise the salaries they offer to attract new talent. In turn, those firms that are now faced with higher labor costs will have to raise the prices on their products to compensate, generating higher inflation, or see their profits fall. Thus, accelerating wages are broadly seen as a sign of higher inflation down the road.
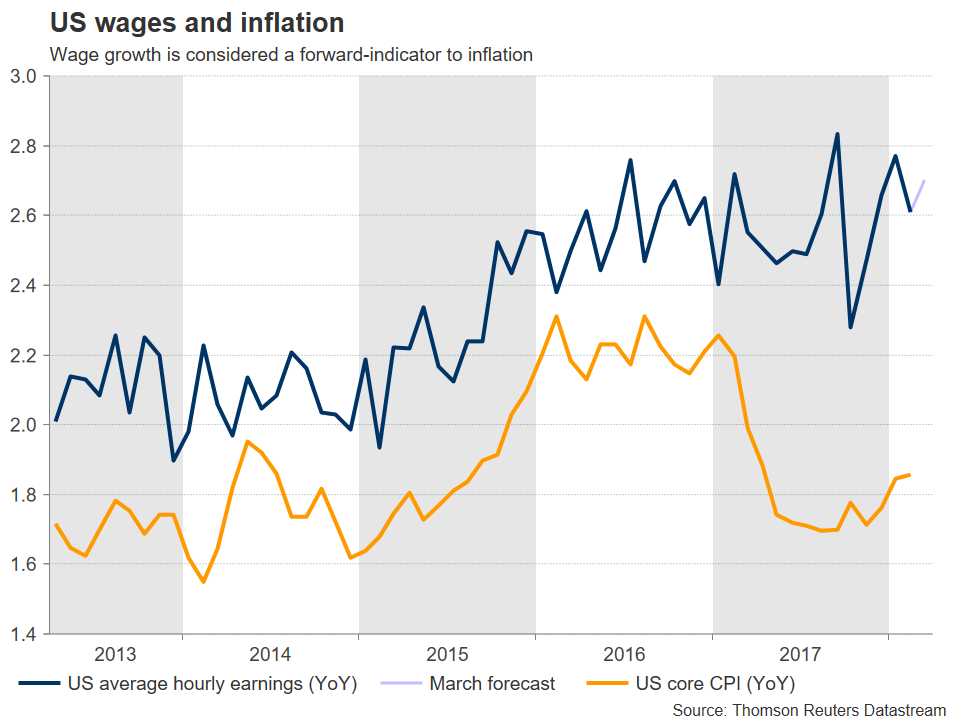
Linking this theory to real life, since it's the Fed's job to keep inflation stable around 2%, any sign that inflation is set to accelerate leads to speculation the central bank will have to respond by raising interest rates more aggressively. Such expectations usually support the dollar, but hurt equity indices. Conversely, anything pointing to inflation remaining subdued typically weighs on the dollar and boosts stocks, on speculation that rates will remain lower for longer.
Turning to Powell, he will be speaking on the US economic outlook, so comments on policy are all but certain. Nonetheless, considering the lack of major developments since investors last heard from him a couple of weeks ago, he is somewhat unlikely to say anything groundbreaking. Economic data are treading water, with the labor market being strong but inflationary pressures still largely absent, while recent trade uncertainties present downside risks, all factors arguing for another neutral policy message by the Fed chief that does not tip the scale in either direction too much.
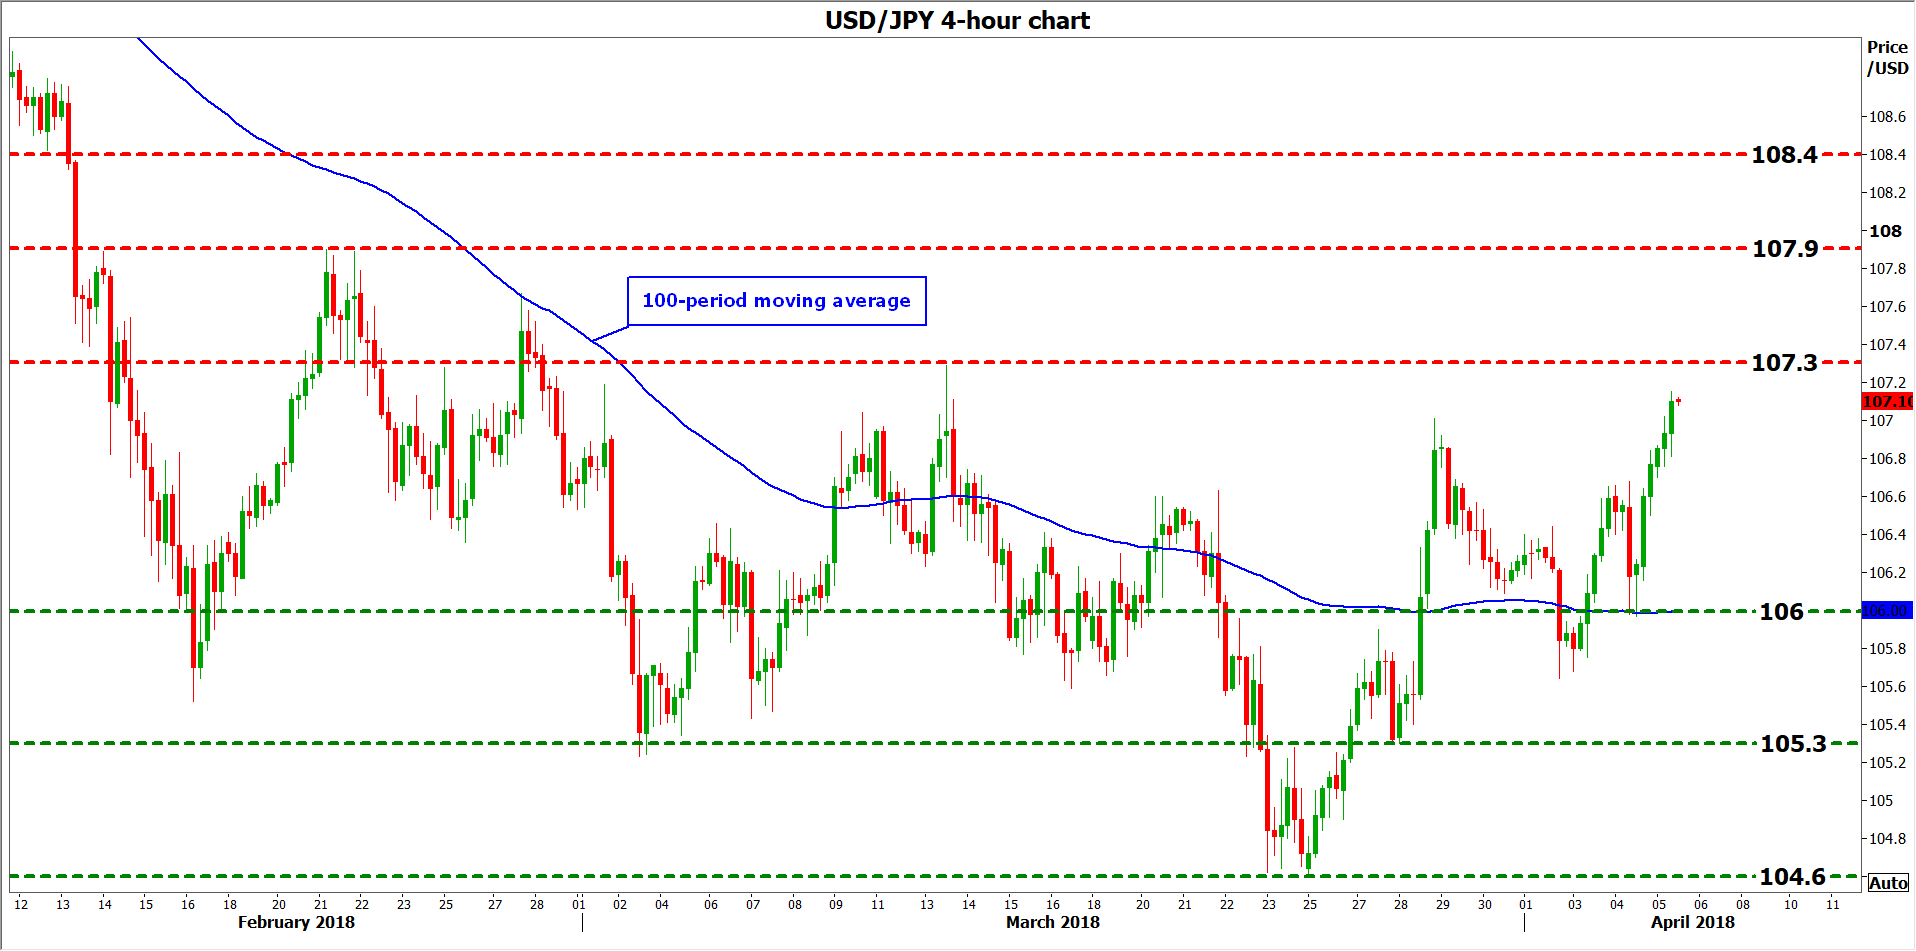
Looking at what is priced into the markets, investors have fully discounted another 25bps Fed rate hike by the end of the year, and they also see an 80% probability for a second one according to the Fed funds futures. Any upside surprise in the employment data, especially in the earnings figures, or a generally optimistic tone by Chairman Powell could cement expectations that the Fed will raise rates twice more this year and thereby, help the dollar recover. Dollar/yen could break above the 107.30 barrier, identified by the peaks of March 13, and head for a test of the 107.90 zone, marked by the February 21 peaks. Further bullish advances could bring into play the 108.40 territory, defined by the lows of February 12.
On the downside, in case of a disappointment in the data or a cautious stance by Chair Powell that pushes back rate-hike expectations, dollar/yen could edge lower for another test of the 106.00 round figure, which also coincides with the 100-period moving average on the 4-hour chart. A downside violation of that level would turn the focus initially to 105.30, the March 27 trough, and subsequently to the pair's recent lows, at 104.60.
Canadian Employment Report Due With Possibility For A NAFTA Deal Soon
The Canadian employment report for the month of March will be made public on Friday at 1230 GMT. The Canadian dollar will be in focus as the data are released. The currency managed to post some gains versus its US counterpart as of late on the back of optimism around an imminent NAFTA deal, though it continues to perform poorly year-to-date, trading lower by 1.5%.
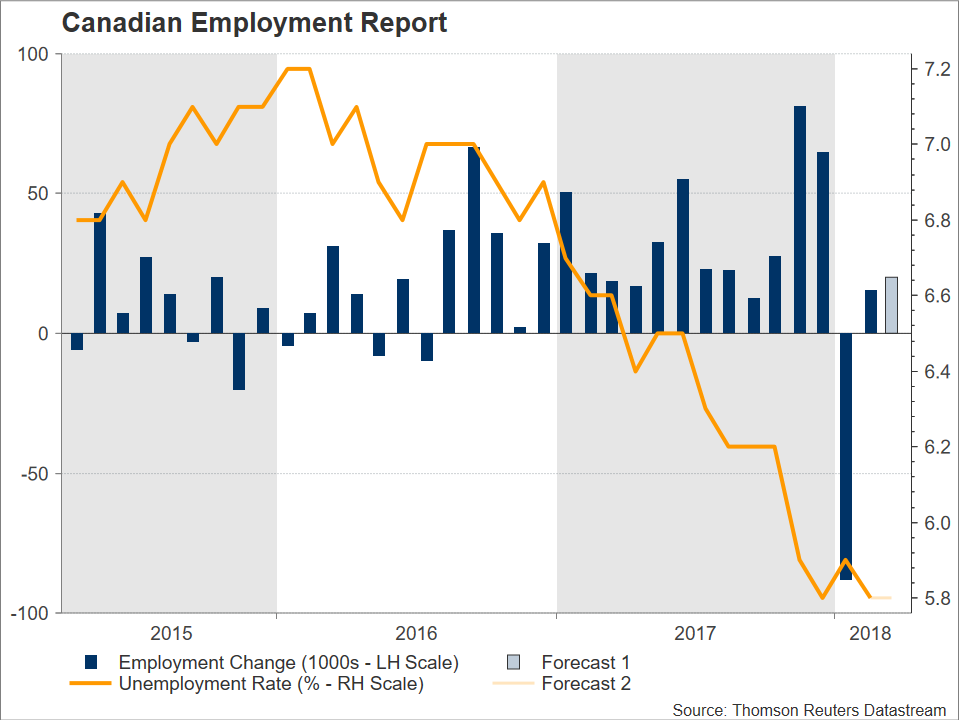
Canada's economy is expected to have added 20k positions in the month of March. This compares to February's 15.4k that followed a big loss in January. The unemployment rate is projected to remain at 5.8%, its lowest since the 1970s.
The Bank of Canada has delivered three quarter percentage point interest rate hikes since July. The Bank's next rate decision is due on April 18, with market participants currently not anticipating a rate increase on that date; Canadian overnight index swaps assign a probability of around 80% for rates to remain on hold. However, markets see a higher chance for a 25bps rate hike during the BoC's July meeting, with such an outcome being priced in by 71% at the moment.
February's jobs report, despite reflecting somewhat of a recovery in the number of positions added to the economy, was tainted by the fact that gains were all in the part-time sector – full-time positions actually fell – while wage growth softened relative to January. On balance, the readings prompted analysts to predict that the BoC will proceed with a more gradual pace of policy normalization. Should the upcoming prints lead markets to scale back in time their expectations for additional tightening by the Bank, then the loonie is anticipated to come under pressure; the opposite holds true as well.
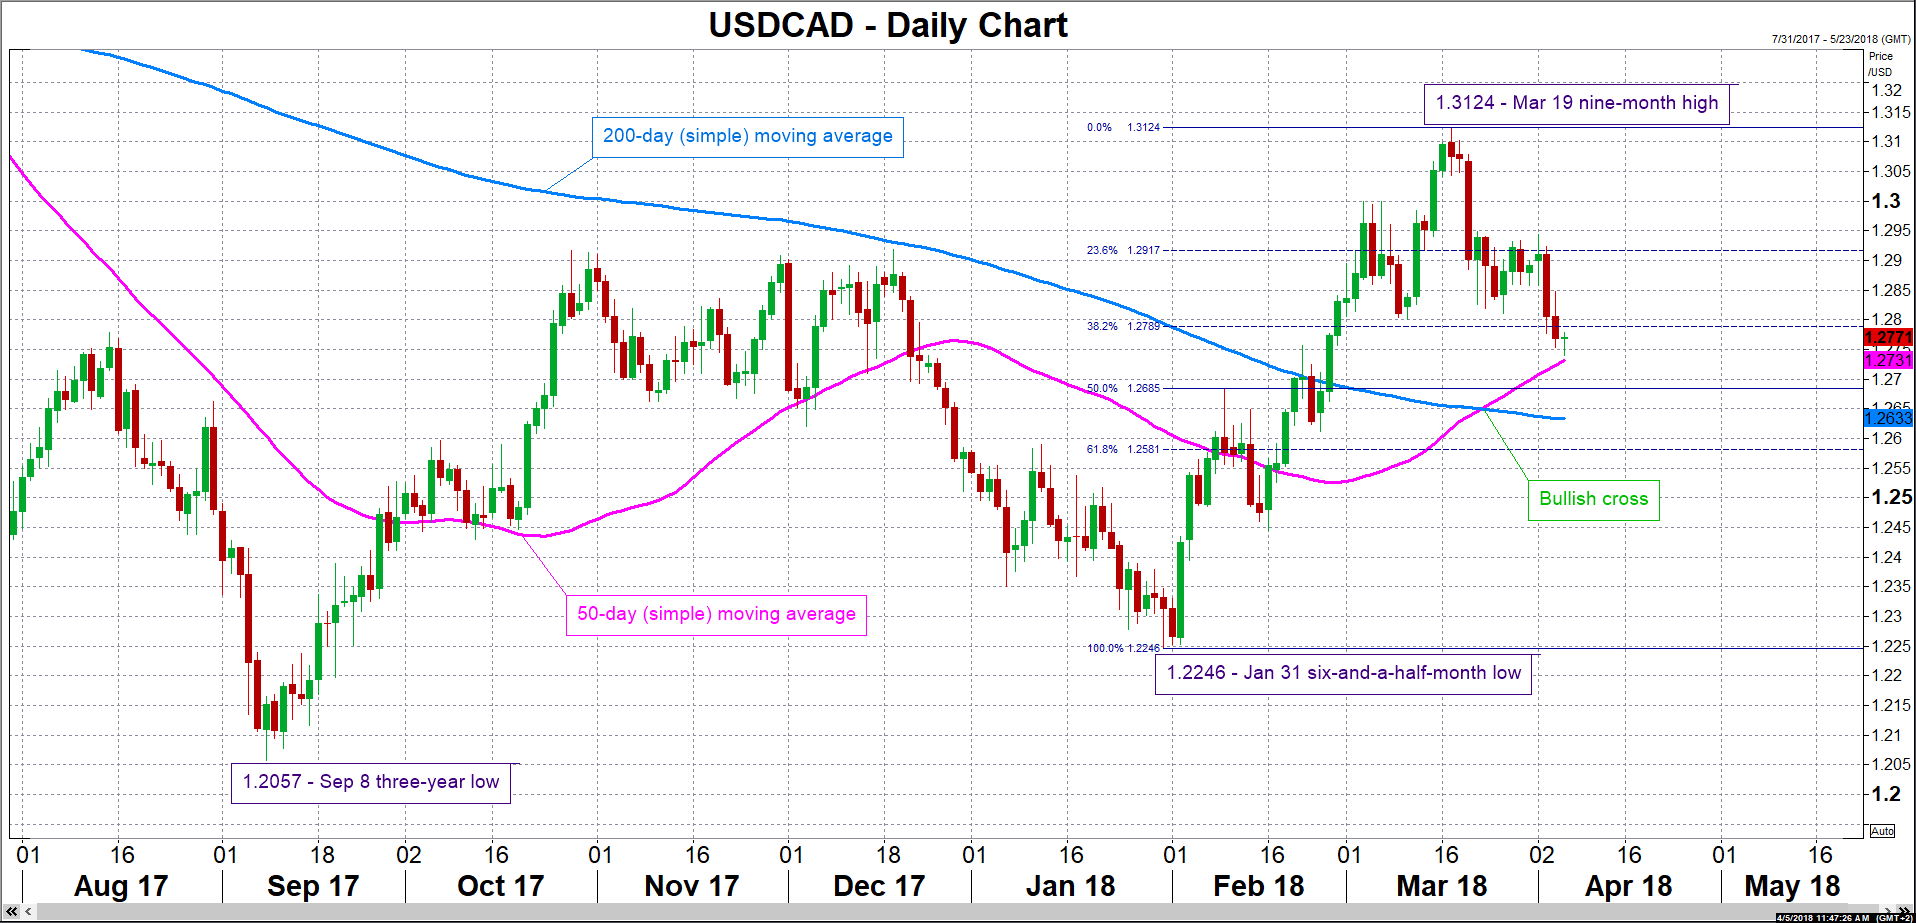
Upbeat data out of Canada are expected to boost the local dollar, exerting downward pressure on the dollar/loonie pair. Support in case of a declining dollar/loonie might come from the range around the current level of the 50-day moving average at 1.2731 and the 50% Fibonacci retracement level of the January 31 to March 19 upleg at 1.2685. Notice that the area around these points was congested in previous months, as well as that the 200-day MA lies not far below this area at 1.2633.
Conversely, disappointing numbers have the capacity to lift the pair. Resistance to advances could be taking place at the moment around the 38.2% Fibonacci mark at 1.2789, including the 1.28 round figure that may hold psychological significance. Stronger bullish movement would turn the attention to the 23.6% Fibonacci level at 1.2917, with the range around it encapsulating the 1.29 handle and a few tops from the recent past.
It is important to keep in mind though that reaction in dollar/loonie would not be solely dictated by the Canadian employment report, as at the same time on Friday the US will see the release of its own jobs report for March.
Lastly, any analysis on Canada and the loonie cannot omit reference to NAFTA negotiations, as the currency appeared highly sensitive to developments on this front over the last number of months. A “no deal” outcome is likely to see the dollar/loonie pair surge as Canada is seen as losing much more than the US under this scenario. However, the latest “chapter” in the negotiations story has been loonie-supportive, with the parties involved appearing closer to a deal. Particularly, it seems that an agreement is desired before July's Mexican presidential elections, as things might further complicate thereafter. Despite this though, there are mixed signals as well with Trump not too long ago – on Sunday – threatening to leave the NAFTA talks. This though, might have merely been a negotiating tactic by the US president rather than reflect his administration's true intentions on the future of NAFTA.
Spot Gold Remains Under Strong Pressure On Fresh Risk On Mode As Trade War Fears Ease
Gold price extends steep fall on Thursday and dipped to session low at $1324, to nearly fully retrace recovery leg from $1321 which stalled at $1348 on Wednesday. The yellow metal fell sharply on fresh risk appetite as strong fears about trade war eased. Wednesday's trading ended in Doji candle with very long upper shadow, which signaled strong upside rejection and driven further down on growing negative sentiment. Daily MA's returned to bearish setup and maintain pressure along with weak momentum studies. Fresh bears probe again through strong support at $1326 (Fibo 61.8% of $1307/$1356 rally) and eye pivot at $1321 (29 Mar trough), violation of which would open way towards key supports at $1309/07 (daily cloud base 20 Mar low). US data are eyed for fresh signals with focus on us jobs data on Friday.
Res: 1331, 1335, 1337, 1339
Sup: 1326, 1324, 1321, 1318
Equities Calm Down
Calm before US Payrolls
Trading has calmed. Gone are TV pundits screaming of trade wars and retaliation. US equities ended yesterday on firm footing after a negative opening. The Nikkei climbed 1.53% on news that China would postpone tariffs on US imports and opt for negotiations. Fears of a trade war are sidelined for now.
US treasuries fell, forcing yields steeper, especially at the long end. March's ADP report on private employment showed a 214 thousand increase, surprising to the upside. This sets the stage for a positive non-farm-payroll report: markets expect 185 thousand new jobs, driven by unseasonably warm weather at the start of the year. Spillover into the USD should be limited, but President Trump is always good for a market-shaking surprise. The USD is not cheap, so we would stay loose on long greenback positions.
Switzerland's richest bank
Shares of the Swiss National Bank continue to rally, closing yesterday at CHF 9,400. It's a crypto-style rise, because in mid-2017 the price was around CHF 2,000! However, despite large gains from foreign equity and foreign exchange holding, this does not equate to shareholder value, because the SNB pays out a large dividend.
Reasons for the rise are Switzerland's safe haven status, the SNB's current, negative interest rates and even speculation that the central bank will morph into a sovereign wealth fund similar to that in Norway. Investors can dream on, because SNB shareholder have no voting rights and no say in general matters. We believe the price spike is partly due to limited liquidity. Investors are scrambling to buy the few available shares.
RBI Monetary Policy set to remain stable
The Reserve Bank of India will update today on monetary policy. Investors will see if central bankers maintain the benchmark lending rate at 6% (fully priced-in scenario) or reduce it by 25 basis points (unexpected), due to a lower inflation rate (4.44% expected at the next release of 12 April). The RBI is committed to reducing inflation (which was at 11.51% in late 2013), despite crude oil price increases since June 2017 (30%).
As US equities recover from Monday's decline, investors are waiting for signs of trade war escalation and potential inflation. The Sensex remains solid following a January decline (-1.03% year to date) at 33'461 (+1.50% this week), supported by Consumer Discretionary (+3.46%), Consumer Staples (+1.39%) and Health Care (+1.15). 2-year, 10-year and 30-year treasuries are steady at 6.81%, 7.29% and 7.94%. The rupee remains behind most Asian currencies vs USD (USD/INR: +2.13%), currently at 65.05 and expected to increase toward the 65.25 range.
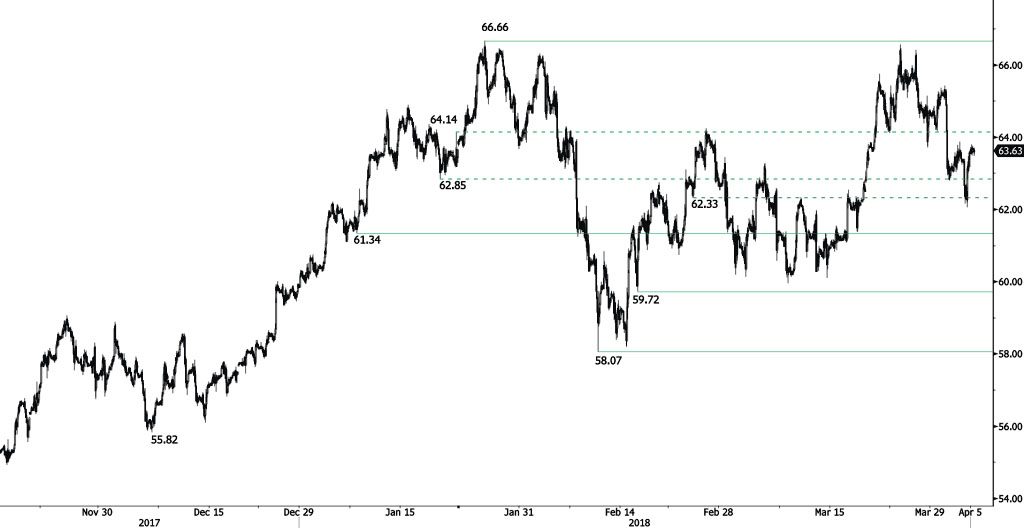
CRUDE OIL Strong Bounce After Breaking Support 62.33
Crude oil is bouncing off after breaking support at 62.33 (23/02/2018), heading along the 63.70 range. The bullish pattern started in November 2017 is weakened. Silver is now contained between hourly support and resistance at 61.34 (08/01/2018 low) and 66.66 (25/01/2018 high). The technical structure suggests short-term increase.
In the long-term, crude oil has recovered after its sharp decline last year. However, we consider that further weakness is very likely. For the time being, the pair lies in an upside trend since June 2017. Support lies at 42.20 (16/11/2016) while resistance is located at 77.83 (20/11/2014). Crude oil is trading above its 200 DMA.