
Sample Category Title
DOW heading to trend line resistance at 24835
DOW opens notably higher today and is trading up over 200 pts within the first 30mins. As we noted here, a based was formed at 23344.52/23360.29. 24314.30 is taken out with ease today. But again, the real hurdle is trend line resistance (now at around 24835). Failure to sustain above there will press recent price actions from 23360.29 into a triangle consolidation pattern. Meanwhile, firm break of the trend line will bring further rise to 25449.15/25800.35 resistance zone, as part of a rectangle pattern.
 Though, in either case, we're still expecting the correction from 26616.71 high to extend with another falling leg through 23351.24 at a later stage.
The Most Important Chapter in the Trade Saga is the Upcoming One
Following the latest round of retaliatory tariffs by China, uncertainty is high, and the next move by either side will determine whether all these actions were just “posturing” ahead of serious negotiations, or whether the situation is set to develop into something bigger, like an actual trade war.
On Wednesday, China unveiled its second round of tariffs on US goods, marking the most significant development in the Sino-American trade dispute so far. The Asian nation announced a list of countermeasures just hours after the US unveiled details of the tariffs it will impose on Chinese technology imports. China plans to set levies on 106 US goods, among which are soybeans and aircrafts.
While it may not sound like much, the fact that soybeans are included in this list is monumental. Note that China is the world’s largest importer of soybeans, and that soybeans are America’s largest agricultural export to China by far. The fact that the Chinese are willing to play the soybean card and hurt their own interests in the process is a testament to the gravitas of the situation, and sends the message to the US that the Asian nation will not shy away from a trade standoff.
What happens next is by far the most important chapter in the trade saga. The next move by either side will determine whether all these actions were just “posturing” ahead of serious negotiations, or whether the situation is set to develop into something bigger, like an actual trade war. In other words, will the US play the retaliation game and announce new countermeasures, or will the two sides head to the negotiating table and work out their differences?
Fresh US measures would likely reinforce concerns that the situation could rapidly grow out of control. In such a case, the market reaction that ensues will likely resemble what we saw in recent days: risky assets like equities could drop further, while safe havens such as the yen may come under renewed buying interest. Looking at the Dow Jones, further declines could encounter support near the 23,344 level, which is the index’s recent low, with the area around this hurdle also encapsulating the Dow’s 200-day moving average. A downside break of that zone would mark a lower low on the daily chart, and from a technical perspective would raise the likelihood for further declines, perhaps towards the 22,420 barrier that is defined by the September 21 highs.
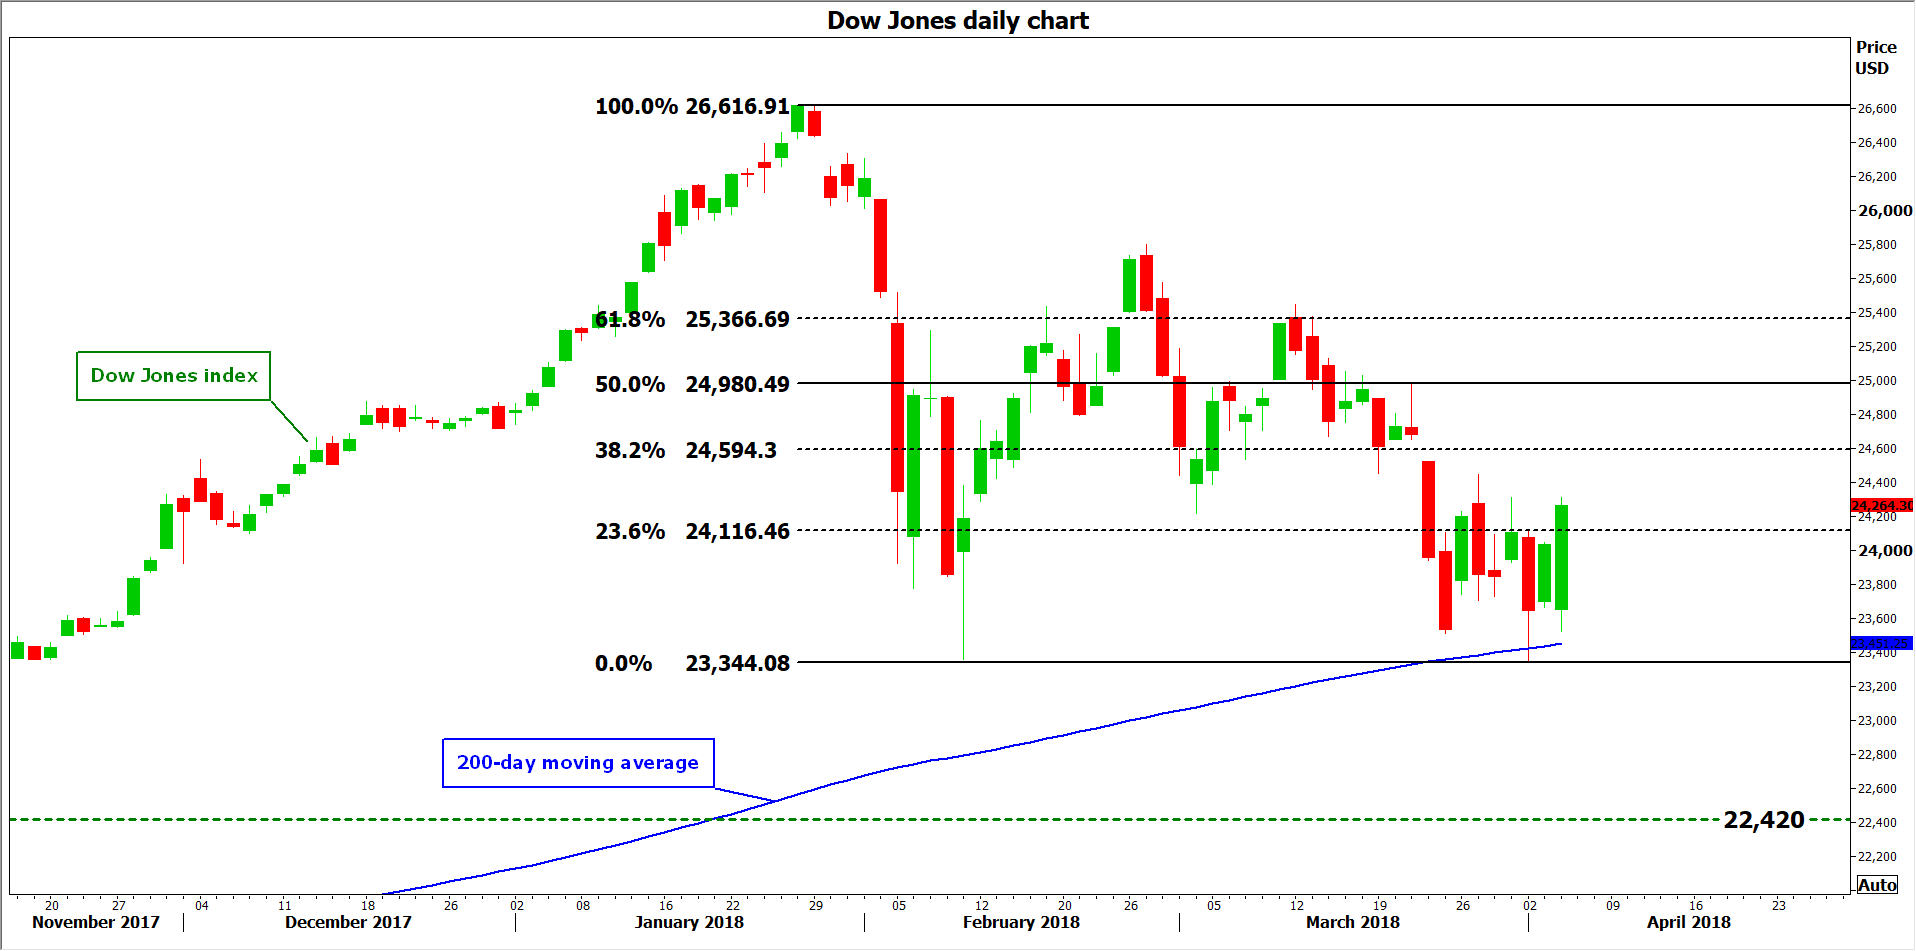 On the flip side, should the two sides come to the negotiating table, then the narrative that all these actions were simply a negotiating tactic ahead of serious talks would gain traction. Expectations that the situation may remain contained and not escalate any further could help risk sentiment to rebound, leading to a recovery in stock markets and a tumble in safe-haven assets as uncertainty fades. In this case, the Dow could edge higher and initially challenge the 24,594 level, which is the 38.2% Fibonacci retracement of the January 26 – April 2 downleg. Further advances could stall near the 24,980 level and subsequently, at 25,366, which are the respective 50.0% and 61.8% retracement levels of the aforementioned downleg.
What is more likely? On balance, the scenario for negotiations appears more realistic. Both sides want to avoid a real trade war, as it would be a lose-lose situation that harms both economies. Moreover, by this point, the US may have done enough posturing for China to make some compromises in their trading relationship, which in all likelihood, was all the US was trying to achieve in the first place. Lending credibility to this argument, is the fact that the new US National Economic Advisor, Larry Kudlow, said yesterday that there is a possibility the US tariffs may never go into effect, adding that he expects intense negotiations ahead. Of course, even if this assessment is correct, one should remain vigilant as trade negotiations are a complicated matter that could drag on for months, implying that more posturing and “trade war” headlines could show up before the situation calms down for good.
Canada’s Trade Deficit Widened in February
Canada's trade deficit widened to $2.7 billion in February (previously $1.9 billion), as the rise in imports (+1.9%) outpaced that in exports (+0.4%). In real terms, the picture was little changed, as imports were up 1.9% and exports rose 0.6%.
The gains in imports were fairly widespread, led by a 15% jump in energy products to the highest level since late-2014. Aircraft and other transportation equipment (+5.5%) and farm, fishing and intermediate food products (+4.7%) also posted decent gains, while metal ores and non-metallic minerals (-12%) provided some offset.
The rise in exports was led by a 20% rebound in the volatile aircraft industry and a 5% bounce back in motor vehicles and parts following plant closures in January. On the flipside, rail transportation issues in Western Canada resulted in a 17% drop in farm, fishing and intermediate food products during the month, with exports of wheat and canola each down by just over 40%.
Canada's trade surplus with the U.S. narrowed to $2.6 billion in February (from $2.9 billion) as the 1.9% increase in exports trailed the 3.3% jump in imports. Canada's trade deficit with the rest of the world widened to $5.3 billion (previously $4.9 billion) with exports down 4.2% and imports falling 0.6%.
Key Implications
Trade got off to a rocky start this year, with February's report confirming that net trade will likely weigh on growth in the first quarter. Still, overall economic growth is on track to advance by 1.4% annualized in Q1.
Going forward, an acceleration in economic activity south of the border and a loonie hovering below 80 US cents should help to improve Canada's trade picture. That said, NAFTA renegotiations and concerns of a global trade war stemming from protectionist rhetoric from the White House leaves a cloud of uncertainty over the outlook.
While a trade war would be negative for Canada, disputes between the U.S. and certain countries such as China could lead to increased demand for some Canadian-made goods as involved countries look to fulfill their demand with different sources.
With the Bank of Canada in data dependent mode, this morning's report is not going to do much to pull them off the sidelines. Indeed, given that economic growth in the first quarter is tracking well below the Bank's 2.5% forecast and that there is significant uncertainty at present, it is likely to remain on hold in the near term, with another hike unlikely to come before the summer.
GBPUSD Tested key 1.40 Support after Downbeat UK Data
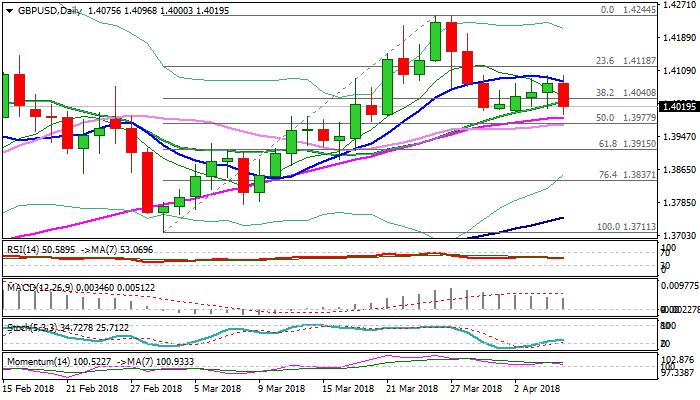
Cable came under increased pressure after UK Services PMI came in much weaker than expected figure in March (51.7 vs 53.9 f/c and 54.5 in Feb) and dipped to 1.40 support on subsequent bearish acceleration.
The sentiment soured after repeated failure to clear 10SMA and rejection at pivotal 1.4099 barrier ) Fibo 38.2% of 1.4243/1.4010 bear-leg), with downbeat data hurting pound further.
Bears faced strong headwinds at psychological 1.40 support (also daily cloud top), helped by weaker than expected US data (weekly jobless claims rose to 242K vs 225K f/c and downward-revised previous week’s figure to 218K, while US trade gap widened to $57.6B in Feb vs 56.9B f/c and 56.7 B gap in Jan) which pressured dollar and gave a breather to pound’s bears. Negative tone however remains in play, keeping the downside vulnerable, with break through 1.40 handle and 30SMA (1.3975) expected to generate strong bearish signal on completion of failure swing pattern on daily chart.
Meanwhile, the pair may hold in extended consolidation ahead of Friday’s release of US jobs data which could generate fresh direction signal.
South-turned 10SMA (currently at 1.4083) remains key near-term barrier and negative outlook will remain while the price remains capped here.
Res: 1.4032; 1.4069; 1.4083; 1.4099
Sup: 1.4000; 1.3975; 1.3915; 1.3889
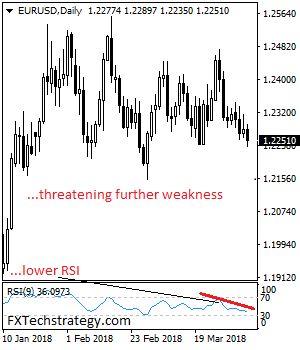
EURUSD: Weakens, Continues To Face Downside Pressure
EURUSD: The pair continues to target further downside pressure as more weakness is envisaged. On the upside, resistance comes in at 1.2300 level with a cut through here opening the door for more upside towards the 1.2350 level. Further up, resistance lies at the 1.2400 level where a break will expose the 1.2450 level. Conversely, support lies at the 1.2200 level where a violation will aim at the 1.2150 level. A break of here will aim at the 1.2100 level. Below here will open the door for more weakness towards the 1.2050. All in all, EURUSD faces further downside threats.
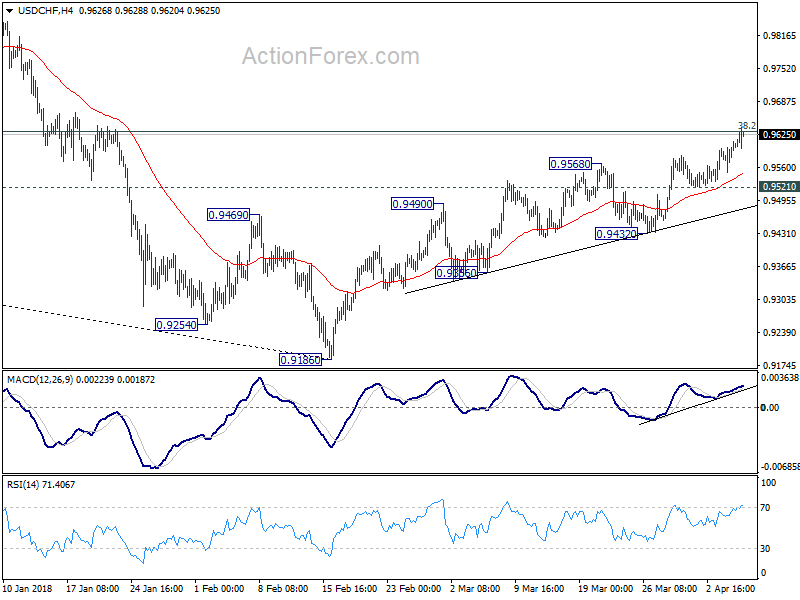
USD/CHF Mid-Day Outlook
Daily Pivots: (S1) 0.9568; (P) 0.9590; (R1) 0.9628; More...
USD/CHF breached 0.9626 key fibonacci level but there is no sustained trading above there yet. On the upside, sustained break of 0.9626 will be another evidence of larger reversal. In this case, further rise would be seen to next fibonacci level at 0.9900. However, rejection from 0.9262, followed by break of 0.9521 support, will turn bias back to the downside for 0.9432 support. Break there will indicate near term reversal and completion of rebound from 0.9186.
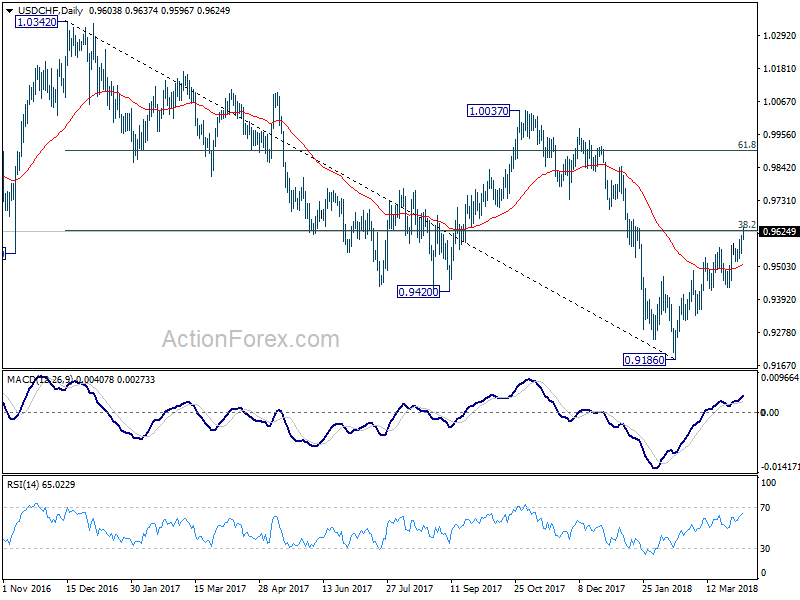
In the bigger picture, fall from 1.0342 is seen as a medium term down trend. Main focus is on 38.2% retracement of 1.0342 (2016 high) to 0.9186 (2018 low) at 0.9626. Sustained break there will add to the case of trend reversal and target 61.8% retracement at 0.9900 and above). However, rejection from 0.9626 will maintain medium term bearishness for another low below 0.9186.
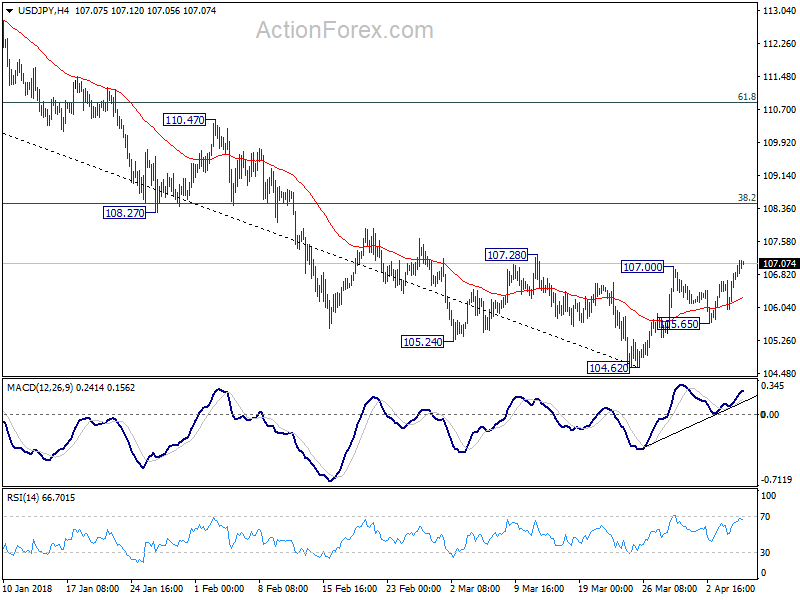
USD/JPY Mid-Day Outlook
Daily Pivots: (S1) 106.22; (P) 106.53; (R1) 107.08; More...
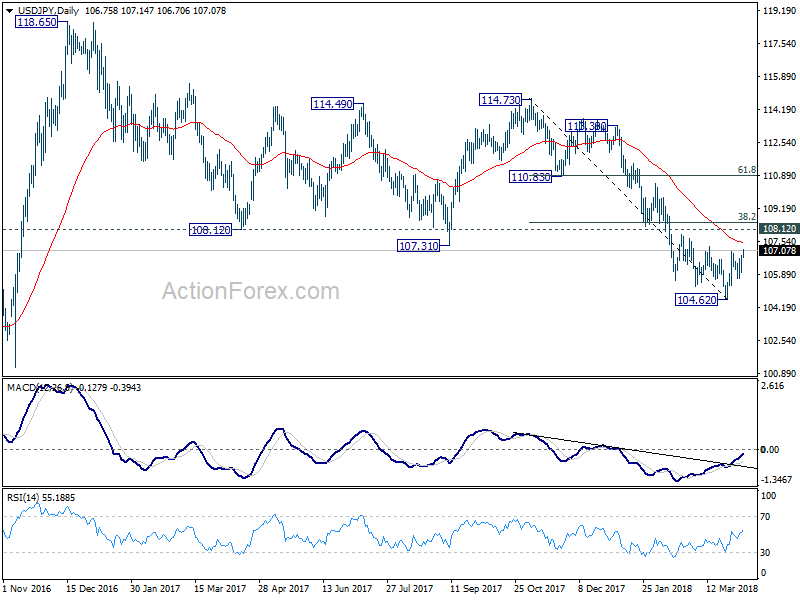
Intraday bias in USD/JPY remains on the upside. Current rebound from 104.62 would target 38.2% retracement of 114.73 to 104.62 at 108.48. At this point, there is no confirmation of trend reversal yet. Hence, we'll look at the reaction from 108.48 (which is close to 108.12 too) to assess the chance. On the downside, below 105.65 support will indicate that the rebound is completed and turn bias back to the downside for 104.62 and below.
In the bigger picture, medium term down trend from 118.65 (2016 high) is still in progress and extending. Build up in downside momentum argues that it might be extending the whole corrective pattern from 125.85 (2015 high). 100% projection of 118.65 to 108.12 from 114.73 at 104.20 will be a key level to watch as firm break there could bring downside acceleration. And in that case, 98.97 key support level (2016 low) would at least be breached. This bearish case will now be favored as long as 108.12 support turned resistance holds.
EUR/USD Mid-Day Outlook
Daily Pivots: (S1) 1.2236; (P) 1.2285 (R1) 1.2318; More....
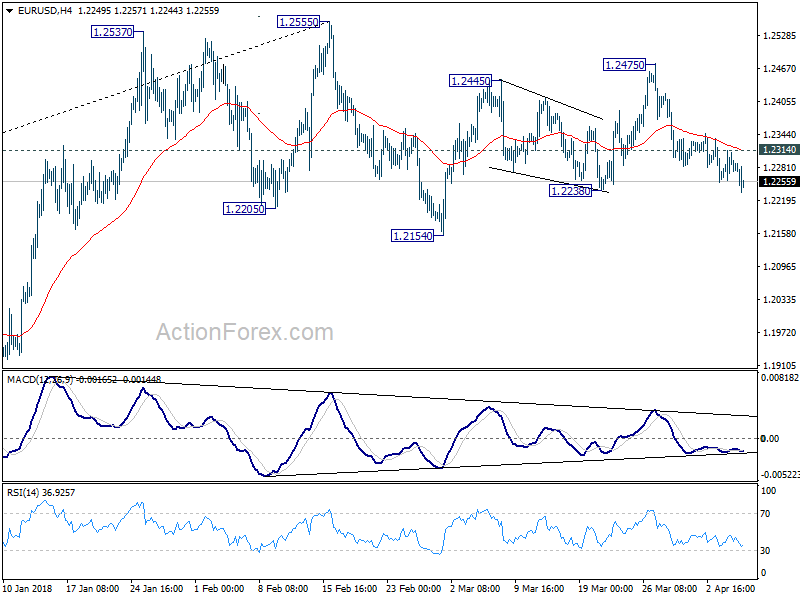
EUR/USD's decline continues today and breaches 1.2238 support. Intraday bias remains on the downside for 1.2154 support level. Decisive break there should confirm the rejection by 1.2516 key fibonacci resistance and pave the way to 38.2% retracement of 1.0339 to 1.2555 at 1.1708. On the upside, above 1.2314 minor resistance will mix up the outlook and turn intraday bias neutral first.
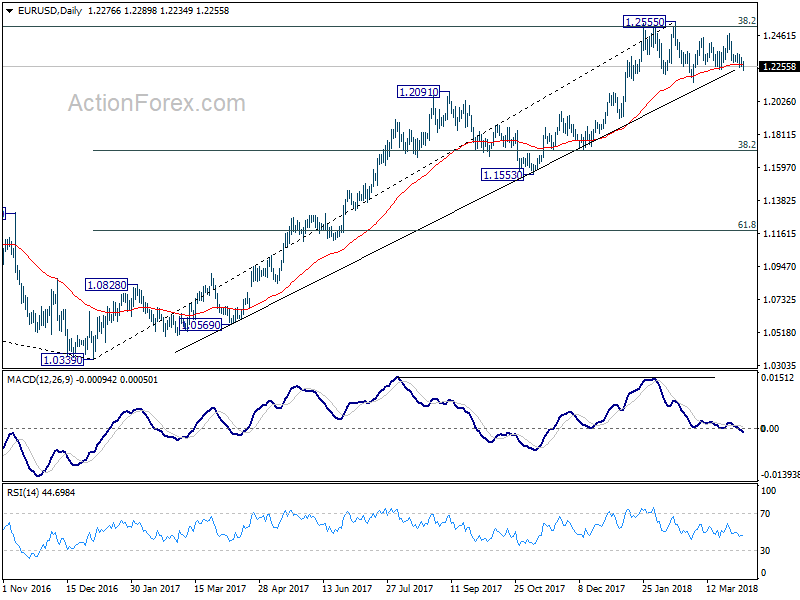
In the bigger picture, key fibonacci level at 38.2% retracement of 1.6039 (2008 high) to 1.0339 (2017 low) at 1.2516 remains intact despite attempts to break. Hence, rise from 1.0339 medium term bottom is still seen as a corrective move for the moment. Rejection from 1.2516 will maintain long term bearish outlook and keep the case for retesting 1.0039 alive. Firm break of 1.1553 support will add more medium term bearishness. However, sustained break of 1.2516 will carry larger bullish implication and target 61.8% retracement of 1.6039 to 1.0339 at 1.3862 in medium term.
GBP/USD Mid-Day Outlook
Daily Pivots: (S1) 1.4029; (P) 1.4062; (R1) 1.4112; More....
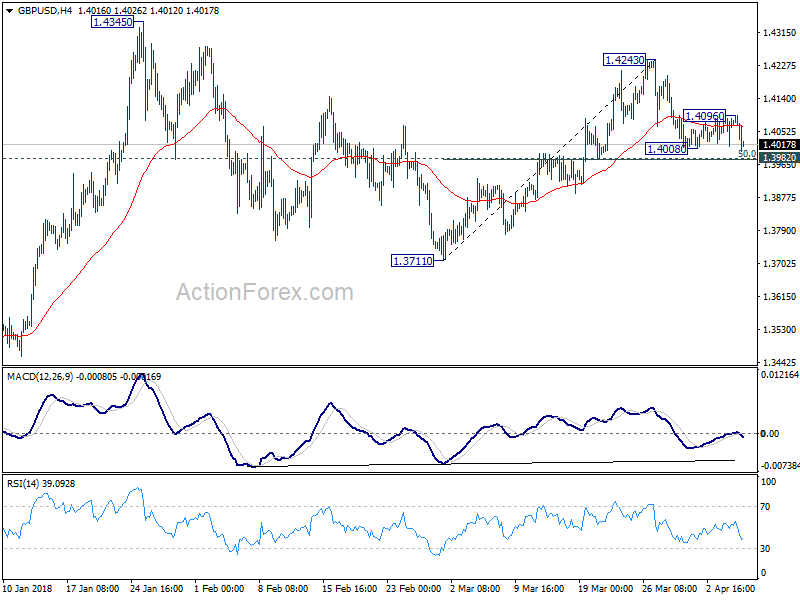
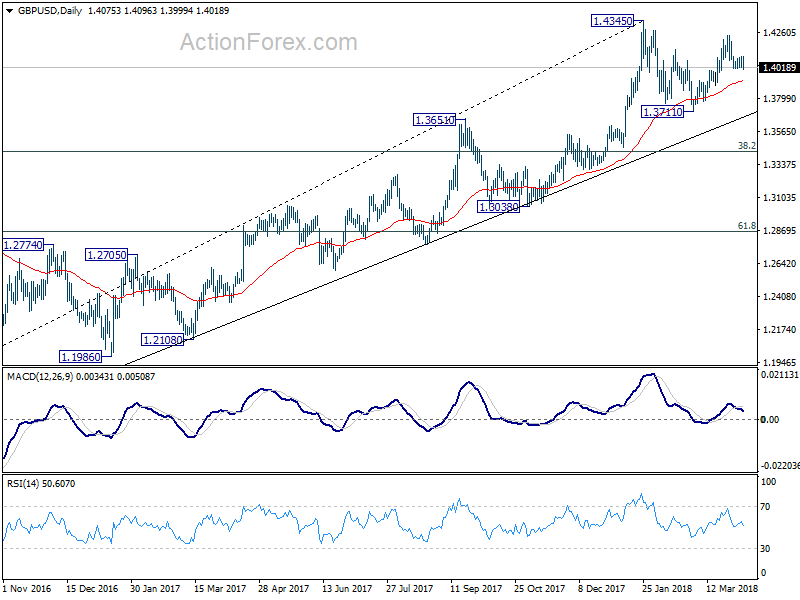
GBP/USD drops to as low as 1.3999 today and breaches 1.4008 temporary low. Focus is now on 1.3982 support. Decisive break there will indicate completion of the rise from 1.3711. In that case, intraday bias will be turned back to the downside for retesting 1.3711. Nonetheless, strong rebound from 1.3982, followed by break of 1.4096 minor resistance will turn bias to the upside for 1.4243. Break will resume the rally from 1.3711 for 1.4345 high first.
In the bigger picture, as long as 1.3038 support holds, medium term outlook in GBP/USD will remains bullish. Rise from 1.1946 is at least correcting the long term down from 2007 high at 2.1161. Further rally would be seen back to 38.2% retracement of 2.1161 (2007 high) to 1.1946 (2016 low) at 1.5466. However, GBP/USD fails to sustain above 55 month EMA (now at 1.4259) so far. Break of 1.3038 support, will suggest that rise from 1.1946 has completed and will turn outlook bearish for retesting this low.
Widening US Trade Deficit and Higher Jobless Claims Not Deterring Dollar Rebound
Global stock markets rebounded impressively today as traders looked past the first chapter of US-China trade war. Nikkei closed up 1.53% at 21645.42 earlier today. European indices are all trading up at the time of writing, with DAX gaining 2.44% being most impressive. CAC is up 2.07% while FTSE is up 1.68%. After the massive 700ps come back yesterday, DOW futures point to higher open and could have triple digit gain at open.
In the currency markets, Dollar is trading broadly higher for the day, followed by Kiwi. Swiss Franc is also trying to stage a come back after yesterday's selloff. Worst than expected trade and job data is having no impact on the greenback. EUR/USD has indeed breached 1.2238 support, suggesting that it's probably ready to head back to 1.22 handle. Sterling is trading as the weakest one today, after PMI services miss. In particular, GBP/USD breaches 1.4008 and is now having 1.3982 key near term support in radar.
What could China do after soybean weapon?
While stocks markets rebounded strongly today, the initial reaction to China's retaliation tariff announcement was admittedly astonishing. In particular, announcement of soybean tariff came earlier than we, as well as the majority of market participants, had anticipated. What else can China do after this weapon has already been used? Some suggest that China can shift from tariff to financial markets, e,g.: to deliberately depreciate renminibi and reduce purchase of US government bonds. Here is an articular detailing the two options - China Announced Tariff on US Soybean Exports. What Next?
US trade deficit widened to USD -57.6b
US trade deficit widened to USD -57.6b in February, up USD 0.9b from USD -56.7b in January. Exports rose USD 3b to USD 137.2b. Imports also rose USD 3.3b to 213.2b.
The February figures show surpluses, in billions of dollars, with South and Central America ($3.4), Hong Kong ($3.1), Brazil ($0.9), United Kingdom ($0.6), and Singapore ($0.5).
Deficits were recorded, in billions of dollars, with China ($34.7), European Union ($15.3), Germany ($6.7), Mexico ($6.6), Japan ($6.0), Italy ($2.8), OPEC ($2.3), India ($1.9), Taiwan ($1.5), France ($1.4), South Korea ($1.1), Saudi Arabia ($0.4), and Canada ($0.4).
Initial claims rose 24k to 242k
US initial jobless claims rose 24k to 242k in the week ended March 31, well above expectation of 223k. But it's still at an ultra low level historically. Prior week's figure was revised up by 3k to 218k. The four week moving average was up 3k to 228.25k. Continuing claims dropped -64k to 1.81m, lowest since December 1973.
Canada trade deficit widened in March, trade surplus with US narrowed
Canada trade deficit widened to CAD -2.7b in February, from CAD -1.9b. Imports rose 1.9% mom, 3.5% yoy to CAD 48.6b, with energy products leading the way. On the other hand, exports rose 0.4% mom, 1.5% yoy to CAD 45.9b, primarily on higher exports of passenger cars and light trucks.
Canadian trade with the US rebounded after two months of decline. Imports from the US rose 3.3% mom to CAD 32.1b, mostly on aircraft. Exports to the US rose 1.9% mom to CAD 34.6b, mainly on passenger cars and light trucks. Canada's trade surplus with the US narrowed from CAD 2.9b in January to USD 2.6b in February.
UK PMI Services: Economy iced up in March
UK PMI services dropped sharply to 51.7 in March, down from 54.5 and missed expectation of 54.0. That's the lowest level in 20 months and it's "partly linked to snow disruption". Chris Williamson, Chief Business Economist at IHS Markit noted that the services sector suffered the ""weakest increase in business activity since the Brexit vote amid widespread disruptions caused by some of the heaviest snowfall in years. And as a result, Q1 growth will be "adversely affected". The PMI surveys pointed to Q1 growth as just under 0.3%, slowed from Q4's 0.4%. Markit also warned that inflationary pressures "picked up again in March".
Eurozone PMI Composite: Economy growing at 0.6% quarterly rate
Eurozone PMI services was revised down by -0.1 to 54.9 in March. Markit noted in the release that "the final PMI numbers showed the weakest rise in business activity since the start of last year, adding to signs that the growth spurt has peaked". PMI data indicates a 0.6% quarterly growth, still "impressive". Meanwhile, some of the factors for loss in momentum was due to temporary factors, such as "bad weather and short-term capacity constraints". April's PMI data will be "particularly important" in "ascertaining true underlying growth momentum and in providing a steer on the likely timing of any ECB policy changes."
Also from Eurozone, German factor orders rose 0.3% mom in February, below expectation of 1.5% mom. Germany PMI services was revised down from 54.2 to 53.9. France PMI services was revised up from 56.8 to 56.9. Italy PMI services dropped notably from 55.0 to 52.6 in March.
Swiss CPI rose 0.4% mom, 0.8% yoy in March
Swiss CPI rose 0.4% mom, 0.8% yoy in March, above expectation of 0.3% mom, 0.7% yoy. Annual rate also accelerated from February's 0.6% yoy. But it's way off the level that will trigger a change in SNB policy. Swiss Federal Statistical Office (FSO) noted that "various factors contributed to the 0.4% rise compared with the previous month, such as an increase in the price of international package holidays, air transport and hotel accommodation. However, prices fell for medicines and fuel."
GBP/USD Mid-Day Outlook
Daily Pivots: (S1) 1.4029; (P) 1.4062; (R1) 1.4112; More....
GBP/USD drops to as low as 1.3999 today and breaches 1.4008 temporary low. Focus is now on 1.3982 support. Decisive break there will indicate completion of the rise from 1.3711. In that case, intraday bias will be turned back to the downside for retesting 1.3711. Nonetheless, strong rebound from 1.3982, followed by break of 1.4096 minor resistance will turn bias to the upside for 1.4243. Break will resume the rally from 1.3711 for 1.4345 high first.
In the bigger picture, as long as 1.3038 support holds, medium term outlook in GBP/USD will remains bullish. Rise from 1.1946 is at least correcting the long term down from 2007 high at 2.1161. Further rally would be seen back to 38.2% retracement of 2.1161 (2007 high) to 1.1946 (2016 low) at 1.5466. However, GBP/USD fails to sustain above 55 month EMA (now at 1.4259) so far. Break of 1.3038 support, will suggest that rise from 1.1946 has completed and will turn outlook bearish for retesting this low.
Economic Indicators Update
| GMT | Ccy | Events | Actual | Forecast | Previous | Revised |
|---|---|---|---|---|---|---|
| 01:30 | AUD | Trade Balance (AUD) Feb | 0.83B | 0.72B | 1.06B | 0.95B |
| 06:00 | EUR | German Factory Orders M/M Feb | 0.30% | 1.50% | -3.90% | -3.50% |
| 07:15 | CHF | CPI M/M Mar | 0.40% | 0.30% | 0.40% | |
| 07:15 | CHF | CPI Y/Y Mar | 0.80% | 0.70% | 0.60% | |
| 07:45 | EUR | Italy Services PMI Mar | 52.6 | 53.9 | 55 | |
| 07:50 | EUR | France Services PMI Mar F | 56.9 | 56.8 | 56.8 | |
| 07:55 | EUR | Germany Services PMI Mar F | 53.9 | 54.2 | 54.2 | |
| 08:00 | EUR | Eurozone Services PMI Mar F | 54.9 | 55 | 55 | |
| 08:30 | GBP | Services PMI Mar | 51.7 | 54 | 54.5 | |
| 09:00 | EUR | Eurozone PPI M/M Feb | 0.10% | 0.00% | 0.40% | |
| 09:00 | EUR | Eurozone PPI Y/Y Feb | 1.60% | 1.50% | 1.50% | |
| 09:00 | EUR | Eurozone Retail Sales M/M Feb | 0.10% | 0.60% | -0.10% | -0.30% |
| 11:30 | USD | Challenger Job Cuts Y/Y Mar | 39.40% | -4.30% | ||
| 12:30 | CAD | International Merchandise Trade (CAD) Feb | -2.7B | -2.1B | -1.9B | |
| 12:30 | USD | Initial Jobless Claims (MAR 31) | 242K | 223K | 215K | 218K |
| 12:30 | USD | Trade Balance Feb | -57.6B | -56.5B | -56.6B | -56.7B |
| 14:30 | USD | Natural Gas Storage | -29B | -63B |