Sample Category Title
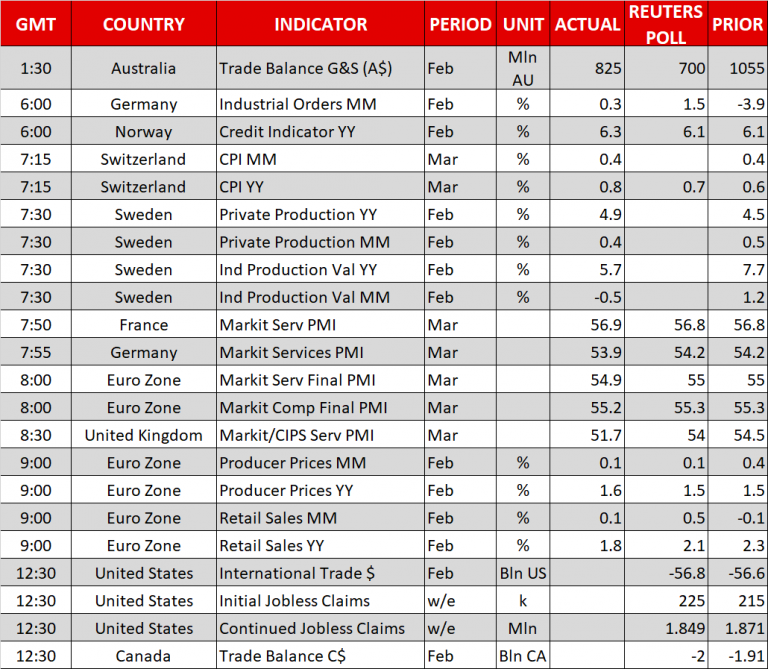
US trade deficit widened to USD 57.6b, initial jobless claims rose to 242k
US trade deficit widened to USD 57.6b in February, up USD 0.9b from USD 56.7b in January. Exports rose USD 3b to USD 137.2b. Imports also rose USD 3.3b to 213.2b.
The February figures show surpluses, in billions of dollars, with South and Central America ($3.4), Hong Kong ($3.1), Brazil ($0.9), United Kingdom ($0.6), and Singapore ($0.5).
Deficits were recorded, in billions of dollars, with China ($34.7), European Union ($15.3), Germany ($6.7), Mexico ($6.6), Japan ($6.0), Italy ($2.8), OPEC ($2.3), India ($1.9), Taiwan ($1.5), France ($1.4), South Korea ($1.1), Saudi Arabia ($0.4), and Canada ($0.4).
US initial jobless claims rose 24k to 242k in the week ended March 31, well above expectation of 223k. But it's still at an ultra low level historically. Prior week's figure was revised up by 3k to 218k. The four week moving average was up 3k to 228.25k. Continuing claims dropped -64k to 1.81m, lowest since December 1973.
US Crude Oil and Gasoline Inventories Declined, While Distillate Stockpile Rose Last Week
The report from the US Energy Information Administration (EIA) shows that total crude oil and petroleum products stocks fell -3.94 mmb to 1185.58 mmb in the week ended March 30. Crude oil inventory declined -4.62 mmb to 425.33 mmb, amidst decreases in 4 out of 5 PADDs. Stockpile in PADD 3 slumped -6.95 mmb for the week. Cushing stock rose +3.67 mmb to 34.89 mmb. Utilization rate increased +0.7% to 93%. Meanwhile, crude production increased +0.26M bpd to 10.46M bpd for the week.
For refined oil products, gasoline inventory fell -1.12 mmb to 238.48 mmb although demand dropped -0.05% to 9.2M bpd. Production dropped -1.84% to 10.12M bpd while imports jumped +11.1% to 0.76M bpd during the week. Distillate inventory gained +0.54 mmb to 129.49 mmb as demand plunged -11.15% to 3.89M bpd. Production added +3.55% to 5.01M bpd while imports tumbled -34% to 0.1M bpd during the week.
Canada trade deficit widened in March, trade surplus with US narrowed
Canada trade deficit widened to CAD -2.7b in February, from CAD -1.9b. Imports rose 1.9% mom, 3.5% yoy to CAD 48.6b, with energy products leading the way. On the other hand, exports rose 0.4% mom, 1.5% yoy to CAD 45.9b, primarily on higher exports of passenger cars and light trucks.
Canadian trade with the US rebounded after two months of decline. Imports from the US rose 3.3% mom to CAD 32.1b, mostly on aircraft. Exports to the US rose 1.9% mom to CAD 34.6b, mainly on passenger cars and light trucks. Canada's trade surplus with the US narrowed from CAD 2.9b in January to USD 2.6b in February.
Dollar Extends Recovery On Easing Trade Fears, European Stocks Advance
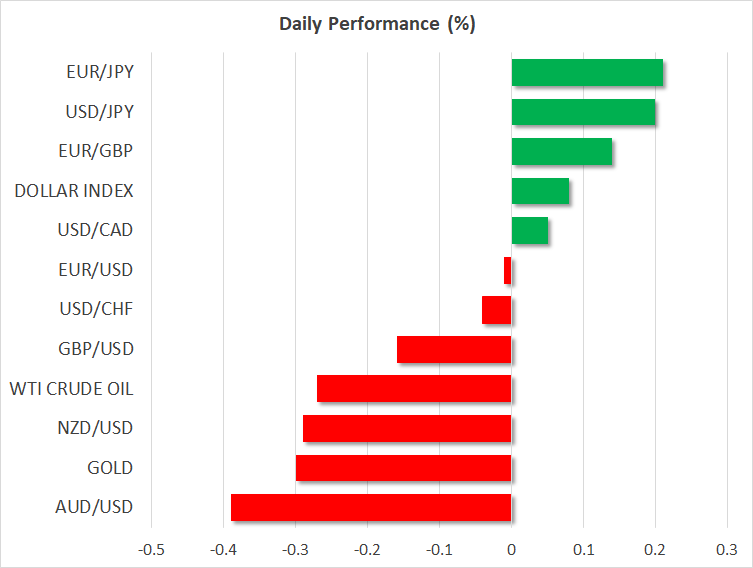
FOREX: The US dollar rose by 0.20% to a two-week high of 107.14 against the Japanese yen on Thursday after a late recovery by US equities. Looking ahead, Friday’s non-farm payrolls report is still a major point of focus for traders. The US dollar index moved marginally higher, edging up to 90.15. Euro/dollar pared earlier losses which drove the pair to a two-week low of 1.2248. The single currency, which is currently challenging its medium-term ascending trend line, may have to wait until the release of the NFP report to break out of its tight consolidation range against the greenback. Pound/dollar fell by 0.13%, snapping a four-day streak of gains on the back of a stronger dollar. The antipodean currencies dropped, with aussie/dollar being down at 0.7681 (-0.38%) and kiwi/dollar lower at 0.7283 (-0.29%). Dollar/loonie was last seen at 1.2778 (+0.07%) after it recorded a fresh five-week low of 1.2744 earlier.
STOCKS: European stocks advanced considerably, taking their cues from a rebound in US equities. Technology companies and miners led the Stoxx Europe 600 higher by 1.40%, with the index hitting the highest level in two weeks. The blue-chip Euro STOXX 50 was up by 1.61%, while the German DAX 30 rose by 1.57%. The French CAC 40 moved higher by 1.56%, the Spanish IBEX 35 jumped by 1.46% and the British FTSE 100 advanced by 1.16%. In the US, the S&P, Dow Jones and the Nasdaq all surged yesterday. Futures tracking these indices are currently in the green, pointing to a higher open today.
COMMODITIES: Oil prices slipped during the early European afternoon. West Texas Intermediate crude fell by 0.19% to $63.25 a barrel, while Brent was down by 0.13% at $67.88 a barrel. In precious metals, gold prices dipped by 0.38% to $1,327.7 an ounce.
Day ahead: US & Canada to deliver trade figures; Japanese household spending due in Asian session
Later on Thursday (1230 GMT), trade figures out of Canada and the US will attract some attention especially in light of the latest developments involving the global trade. The latter will also see its weekly update on initial jobless claims ahead of the all-important nonfarm payrolls report due on Friday.
According to forecasts, the US trade deficit is anticipated to widen by $0.2 billion to $56.8 in February, reaching the highest level since October 2008. If the deficit comes in larger than predicted, Trump could press for a tougher stance during trade talks with China. Yesterday, after retaliatory moves between the US and China, the US National Economic Advisor Larry Kudlow removed a layer of uncertainty, saying that US tariffs on Chinese products are still proposals that may never go into effect, while both countries left a window open for intensive talks to take place.
Canada is also anticipated to face a larger negative trade balance in February, with the relevant measure said to have increased to C$2.0 billion from C$1.90 in January. In this case, though, the numbers could have a softer impact on the loonie amid rising confidence that a NAFTA deal could be secured soon.
Meanwhile, the number of people applying for unemployment benefits for the first time in the US is projected to have inched up by 10,000 to 225,000 in the week ending March 30. However, Friday’s NFP stats and particularly the wage component would be the hot spot of this week’s data releases as investors are eagerly waiting to see whether wages picked up speed, a fact that could push up inflationary pressures and hence drive the Fed’s preferred inflation gauge – the core PCE index – towards its 2.0% target.
Elsewhere, Japan will publish data on household spending during the early Asian session (2330 GMT). On a yearly basis, consumption is projected to have risen moderately by 0.3% in February, compared to 2.0% growth seen in the previous month, while month-on-month a contraction of 0.6% is expected to follow a sharp expansion of 2.7%, the highest growth recorded since April 2014.
Geopolitical developments could be also in focus in the following days as a report by the Nikkei citing stated that North Korea’s leader Kim Yong Un showed interest to return to six-party denuclearization talks, including North Korea, China, US, Japan, South Korea, and Russia during this last week’s meeting with the Chinese President Xi Jinping.
Regarding today’s public appearances, Atlanta’s Fed President Raphael Bostic (voter) will be giving a speech at 1700 GMT, thought the topic of discussion renders any comments on monetary policy unlikely.
WTI OIL Eases, Unable To Hold Gains After Upbeat US Crude Stocks Data
Oil price is losing traction on Thursday and eases after bumpy ride on Wednesday, when oil initially dipped to new 3 ½ week low at $62.05 and bounced to $63.62 on upbeat US crude inventories data.
EIA report showed weekly crude inventories surprisingly fell by 4.6 million barrels, compared to forecast for 1.4 million barrels build.
Recovery proves to be short-lived as other factors continue to have negative impact on overall sentiment.
Rising US shale oil production and the output from Russia, the biggest oil producer, weigh heavily on efforts of key world oil producers to end global supply glut and stabilize oil market, keeping oil price volatile.
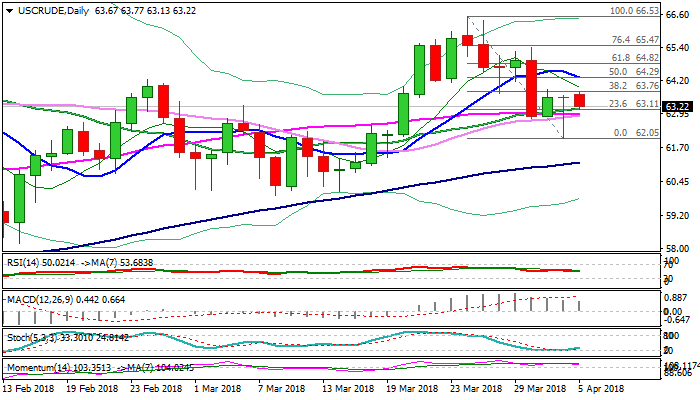
Fresh weakness on Thursday dents again daily techs which still hold in overall bullish setup and threaten renewed attempts through cracked key support zone between $63.15 and $62.56 (20/55/30 SMA’s/Fibo 61.8% of $60.11/$66.53 ascend) loss of which would be strong bearish signal.
Otherwise, hopes of fresh recovery attempts would remain in play while those supports hold. Such scenario requires close above $63.76 (Fibo 38.2% of $66.53/$62.05) which capped the action in past two days and today and extension to 10SMA ($64.29), break of which would confirm reversal.
Res: 63.76, 64.29, 64.82, 65.40
Sup: 63.11, 62.80, 62.56, 62.05
What To Expect From US NFP
Introduction
While the monthly jobs report is routinely among the most important high-frequency releases, the March reading will be particularly significant given the acute market focus on whether the FED is at risk of falling behind the curve in terms of policy normalisation.
Setting the scene
With the unemployment rate flirting with levels matching the lows of the 1990s cycle and labor conditions posed to tighten further this year, firmer wage pressures are likely to finally materialise more appreciably.
Wage pressures are picking up, as reflected in the gradually accelerating uptrend in the Employment Cost Index, as increased labour scarcity boosts wages. Philips Curve, inverse relation between unemployment and inflation in full swing. Businesses will now focus on productivity enhancing investments and productivity growth will gradually accelerate closer to its historical norms of 2%-2.25%.
What we expect to happen
Any forecast bias for March? Consider six and twelve month moving averages for March.
Look at ADP for March, what is the forecast bias, does it tend to underestimate official payroll gain in March?
Private companies added 241000 positions (ADP) in March as employment in construction and manufacturing surged, well ahead of Wall Street estimates for 205000 growth. On a YoY basis, March 2018 ADP nearly doubled the 122000 totals from the previous year.
Ahead of Friday's NFP, Wall Street is looking for growth of about 185000 and a decline in the unemployment rate to 4% from 4.1%.
The private payroll number adds upside potential to Friday's NFP. We expect NFP to surpass expectations.
However, both ISM surveys eased from impressively robust results earlier in the quarter, albeit in a modest manner. However Q1 average of ISM headline at 59.4 was the strongest quarterly result in the history of the series.
What this means for the markets
FED's dot plot more hawkish than meets the eye.
Average hourly earnings important, talk about how this data for February trumped NFP figures. Other focus for market participants remains on the unemployment rate and the pace of gains in average hourly earnings
The new ‘dot plot' released after March's FOMC meeting shows between two and three further 25bp rate hikes this year: the media end-2018 dot stands at 2.125%, consistent with two further rate increases while the average dot rose by 20bp to 2.2%, suggesting that risks are skewed towards three.
Economic projections submitted by the 15 FOMC members showed a further upgrade to real GDP trajectory, expected to expand this year and next by about 1.5% above its estimated trend rate, pushing down the unemployment rate too.
Consistent with the greater confidence over the medium-term economic outlook and a build-up of inflationary pressures, the FOMC now see scope for a more prolonged tightening cycle. Powell reassured investors that Trump's fiscal expansion had boosted FOMC members' confidence in their expectation of strong domestic demand ahead
Potential risk of US/China trade war. Tariffs and counter-tariffs has investors panicked and acts as a threat to US equity markets. However, escalating trade disputes between US and China are adding an unwelcome layer of uncertainty to an otherwise bright economic outlook.
Sterling Still Bullish Despite Weaker UK Data
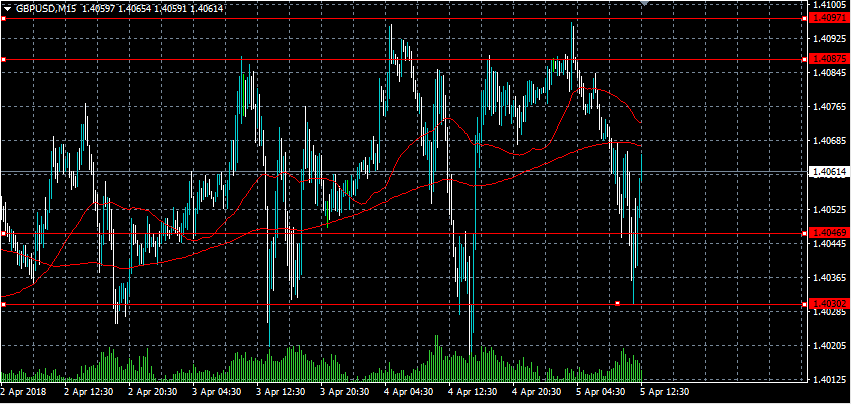
The British pound continues to trade towards the top-end of its recent range against the U.S dollar, after briefly dipping lower on weaker than expected UK PMI Services data. The GBPUSD pair again met strong dip-buying demand from the 1.4030 level, with price-action now trading towards the 1.4068 resistance area. Sterling traders continue to digest the weaker UK Services sector data, with the intraday trading-range now set between the 1.4030 and 1.4097 levels.
The GBPUSD pair retains a bullish bias whilst trading above the 1.4030 level, key resistance is currently located at the 1.4097 and 1.4146 levels.
Should price-action on the GBPUSD pair hold below the 1.4030 level for a sustained basis, key technical support is then found at the 1.4008 and 1.3960 levels.
Selling Pressures Weigh On Euro Below 1.2275
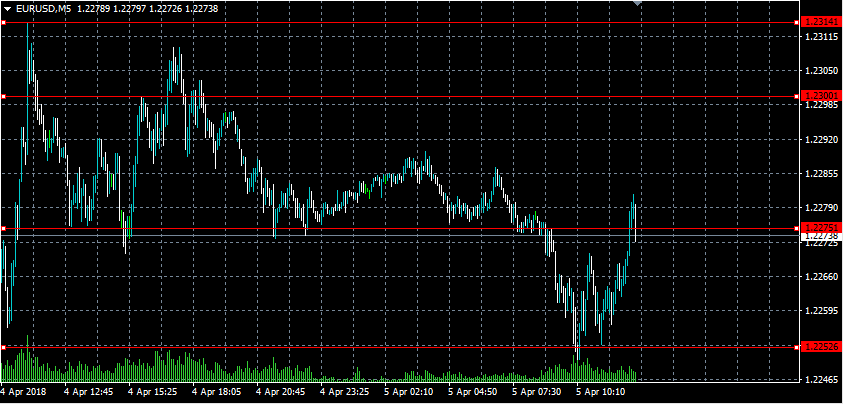
The euro currency has again slipped lower against the U.S dollar during the European trading session, following another round of soft economic data coming out of the Eurozone. The EURUSD pair briefly slipped below the 1.2252 support level, as EU Retail Sales and Services data came in weaker than economists expected. The euro remains under selling pressure whilst clearly trading below the pivotal 1.2275 level, and continues to print technically bearish lower trading lows.
The EURUSD pair retains a bearish bias whilst trading below the 1.2275 level, further downside towards the 1.2239 and 1.2205 levels seems likely.
Should EURUSD price-action move above the 1.2275 level, key intraday resistance is then found at the 1.2300 and 1.2314 levels.
EUR/USD Fails To Gain Momentum
The Euro continues to move in a ranging motion against the US Dollar for the fifth consecutive session. The pair was pushed slightly lower mid-Tuesday; nevertheless, the lack of distinctive movement still continues to dominate the market.
Despite attempts to push higher during the previous session, bulls failed to overcome the strong resistance of the 55– and 100-hour SMAs and the senior channel line circa 1.2310.
Meanwhile, the pair breached a junior pattern that could be regarded as a bullish signal. From a technical point of view, this should send the pair past 1.23 and towards the 200-hour SMA. However, the Euro has struggled to capitalise on the Dollar's weakness, and the same situation is likely to continue today.
In terms of downside potential, the rate should not fall below the 1.2240 mark.
GBP/USD Remains At Wednesday’s Level
GBP/USD has failed to pick up momentum after the Easter holidays, as it has remained trading in a range between 1.4020 and 1.41. A move above the latter level has been restricted by the weekly PP and the 200-hour SMA.
The general tendency, however, has remained slightly upwards. This suggests that if the aforementioned resistance is breached, the pair might go for a surge with no limits up to the 1.4175 mark.
On Thursday morning, the rate's positioning is between all three SMAs. Analysts expect that the British Services PMI released today at 0830GMT might introduce high volatility in the market, thus surely surpassing one of these barriers.
The bullish scenario was already discussed above. In case the 55– and 100-hour SMAs are breached, a move below the monthly PP at 1.40 is unlikely.