
Sample Category Title
Eco Data 4/6/18
[php_everywhere instance="1"]
CAD/JPY long opportunity for quick trading and position trading
USD/JPY is trading as the biggest mover (up) today, and momentum is maintained in the current 4H period.
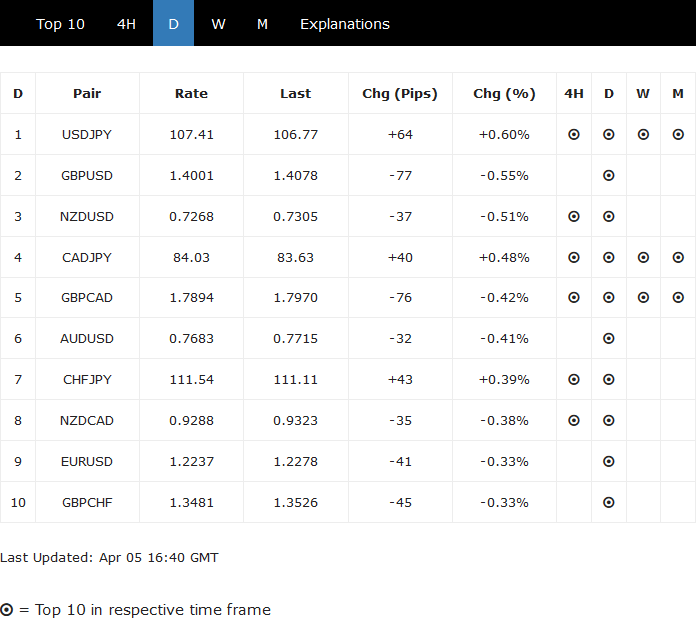 This is consistent with the D heatmap where USD is the strongest one, while JPY is the weakest one.
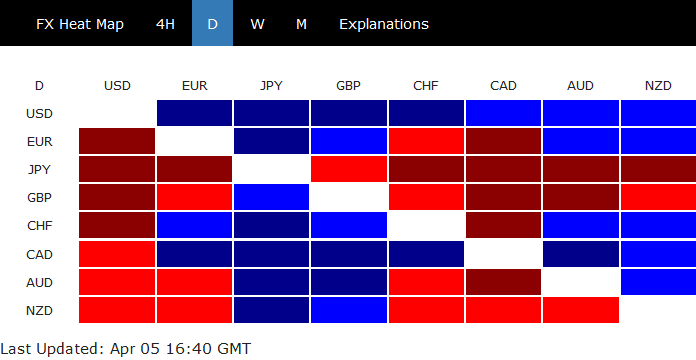 However, looking at the 4H heatmap and W heatmap, we can see that USD's strength is not that overwhelming. And indeed, CAD's strength look more solid. And, CAD/JPY is indeed also top 10 movers across all time frame.
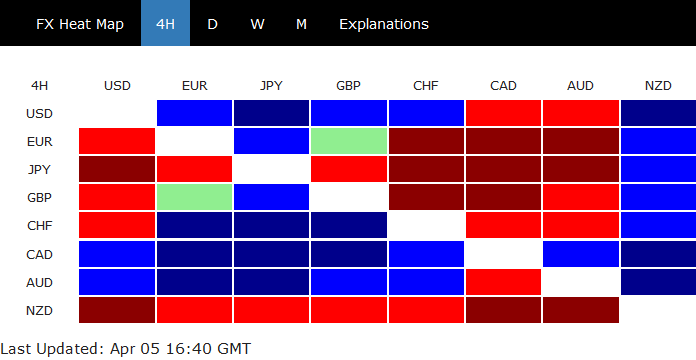
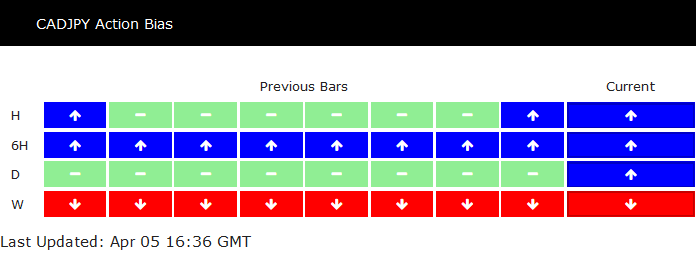
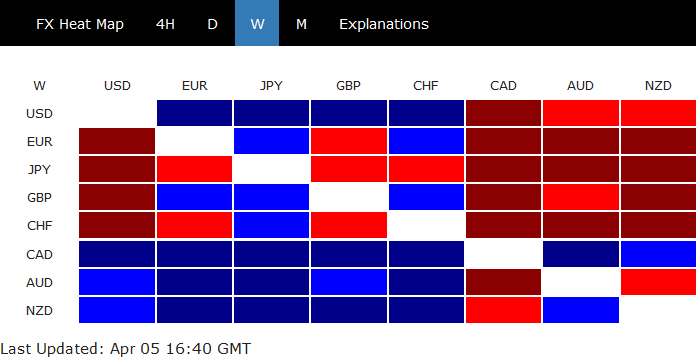 Hence, CAD/JPY is probably a pair that's worth more attention. Looking at CAD/JPY action bias table, solid upside momentum is seen in 6H time frame. However, D action bias has just turned from neutral to positive. And W action bias stays negative in the latest 9 bars. While there is a possibility that CAD/JPY is staging a trend reversal, current rebound could also be a correction.
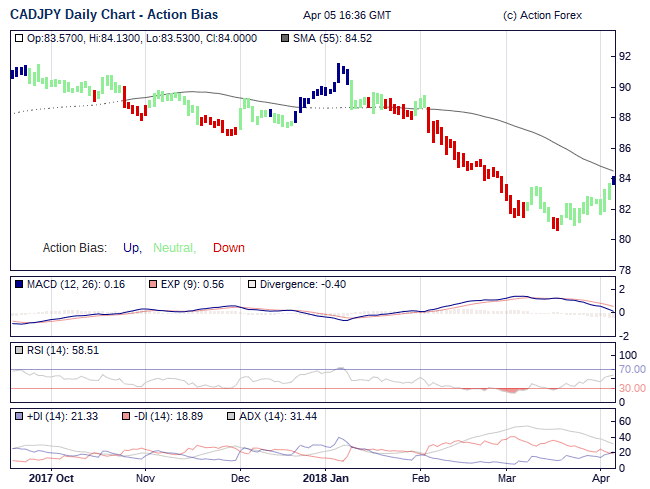 Looking back at the charts, CAD/JPY should have bottomed in short term at 80.52 after drawing support from 80.55. This give us more confidence on the long trade. For quick intraday traders, a strategy is to long CAD/JPY and target 38.2% retracement of 91.56 to 80.52 at 84.73 for a quick profit. For position traders, we better wait for the reactions from the 84.73 fibonacci level to make sure the pullback is corrective and buy at a dip.
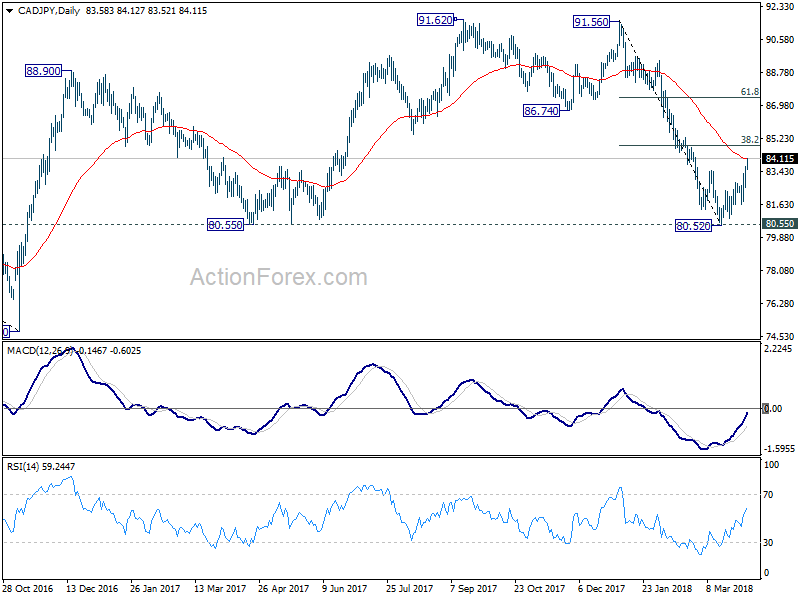
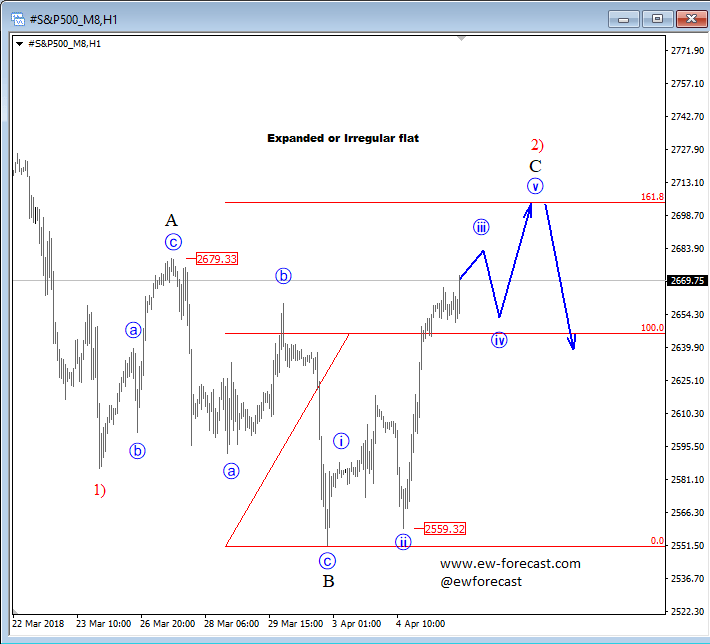
Elliott Wave Analysis: Correction on S&P500 Can See A Top At 2700
Hello traders.
On S&P500 we are observing a bigger, three-wave recovery in progress, which can be unfolding as an Elliott wave expanded flat correction. In flats, we have a 3-3-5 structure, with waves A and B unfolding three legs, while the final wave C unfolds five of them. On that note, we are now tracking final sub-wave C of 2) which can later look for resistance and for a new turn lower around the 2700 area, where the Fibonacci ratio of 161.8 could project end of wave C.
GBP/JPY – Bearish Confirmation or Bullish Breakout?
GBPJPY is trading at a very interesting level right now. After breaking below the ichimoku cloud and 55/89-day simple moving average combination two months ago, the pair continued to take out support after support with relative ease, creating quite a bearish outlook in the medium term.
The last month has seen the pair pare some of those losses and now we find ourselves at a key level. Price has run into resistance over the last week between 150.00 and 151.00, where the 55/89 DMAs once again cross the ichimoku cloud, something that did not end well last time. The fact that this combines with the 50 fib level – 2 February swing high to 2 March swing low – makes this an increasingly noteworthy level.
This time though, rather than powering through them, the rally has stalled and the momentum indicators don’t give the impression of a pair that’s about to break down the barriers right now. While oscillators are not a primary indicator – that will always be price – a divergence between price action and the stochastic and MACD can be a useful signal of an impending bias shift. For the last month, the trend has been nicely bullish, but is that about to change?
From a technical standpoint, a rotation off the current level would be very bearish. Aside from signaling a continuation of the medium term bearish move, it would also act to confirm the initial breakout.
None of this is to say price can’t and won’t break above here. And if it did, that would be quite a bullish signal. The important thing is we should get a clear indication of whether the market is bearish or bullish very shortly. As it stands, the pair looks bearish and the break of the 200/233 DMAs last month supports that (although it did turn out to be a false breakout back in August).
How Costly Would a Full-Blown Trade War Be?
Executive Summary
The United States and China have announced tariffs on each other's goods in recent weeks. The tariffs that China has announced to date, assuming they actually take effect, would make the business environment more challenging for establishments in the agricultural, motor vehicles, aircraft and chemicals industries. But, the overall effect on the U.S. economy should be limited, at least in the near term. That said, there could be other knock-on effects that could raise the pain for the United States. A full-blown trade war, should one develop, is probably not in the best interests of the United States.
Are the Tariffs Announced to Date a "Big Deal"?
Tensions between the United States and China regarding bilateral trade have intensified in recent weeks. The United States announced in early March that it would impose tariffs on imports of steel and aluminum products. Although the tariffs were not targeted exclusively at China, the country's exports of steel and aluminum to the United States will certainly be affected by the measures. China responded by levying its own tariffs on about $3 billion worth of American goods. On April 3, the United States announced that it would impose tariffs on the exports of about 1,300 Chinese goods, worth about $50 billion, in "response to China's unfair trade practices related to the forced transfer of U.S. technology and intellectual property." China promptly responded with tariffs on 106 American products—largely agricultural products, automobiles, aircraft and chemicals—whose export value to China totals about $50 billion.
These announcements notwithstanding, it may still be premature to proclaim that a full-blown trade war has commenced. After all, the proposed tariffs on Chinese goods has not yet gone into effect because they are subject to a 30-day public comment period in the United States. Depending on the outcome of the subsequent review that will be conducted by the office of the U.S. Trade Representative, some goods could be removed from the list. Likewise, China has not yet set a date on which its tariffs will go into effect. The tariffs could be completely rescinded if negotiators from both sides reach agreement on ways to settle the trade tensions between the two countries. But let's assume that the tariffs take effect as announced. Would that be a "big deal"?
As noted above, Chinese tariffs on American goods focus on agricultural products, automobiles, aircraft and chemicals. American exports of agricultural and other primary products to China totaled nearly $20 billion in 2016, which accounted for 25 percent of the industry's exports in that year (Figure 1).1 There were also significant amounts of exports of aircraft (nearly $15 billion), motor vehicles and parts (about $11 billion), and chemicals (more than $13 billion) in 2016. But because the total exports of these industries are larger than the total exports of the agricultural and other primary products industry, China accounts for lower percentages of their overall exports. But, all of these industries, especially the agricultural and other primary products industry, appear to have significant exposure to China.
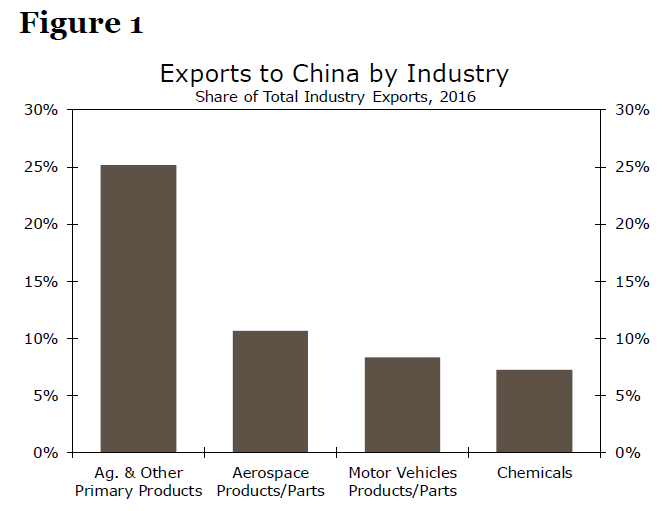 But when measured as a percent of total industry output, the exposure to China appears to be more manageable. For example, the gross output of agricultural and other primary products industry totaled $428 billion in 2016. Consequently, exports to China represented less than 5 percent of the industry's output in 2016 (Figure 2). Aircraft (about 3 percent), motor vehicles and parts (2 percent) and chemicals (less than 2 percent) had even lower ratios. The exports to China of the four industries that are shown in Figure 1 and Figure 2 totaled nearly $60 billion in 2016. But, this figure represents only 2.6 percent of the output of those industries, and those industries account for less than 5 percent of all the value added that is generated in the U.S. economy. In short, Chinese tariffs on these four broad industries are not a "big deal," at least not from a macroeconomic perspective.
 How Painful Could a Trade War Be?
But as the tit-for-tat retaliation of the past few days demonstrates, authorities in the United States and China may not stop at the measures that have been announced thus far. There could be further retaliatory steps in the days and weeks ahead. So how bad could a full-blown trade war be between the United States and China? In a worst-case scenario, each country could levy increased tariffs on all of the goods that the other country exports. How much exposure does each economy have to each other in terms of total exports?
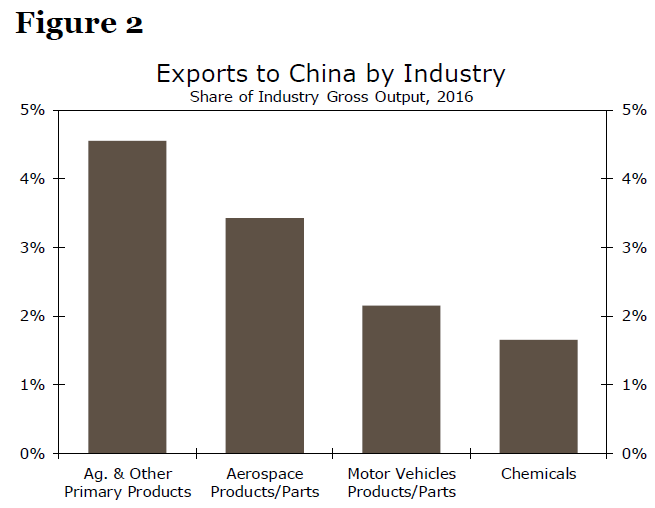
American exports to China have shot up from $16 billion at the turn of the century to $130 billion last year. This 13 percent annual average growth rate places China among the fastest growing export markets for the United States over the past two decades. Still, China accounts for just 8 percent of total American exports at present (Figure 3). Furthermore, we estimate that the value added that is embodied in American exports to China accounts for only 0.5 percent of total value added in the U.S. economy. The U.S. economy is largely a services-based economy and most services are not exported. Consequently, exports of goods to China account for only a very small percentage of total value added in the U.S. economy.
 Looking at things the other way around, China's exports to the United States totaled more than $430 billion in 2017, which represented 19 percent of China's total exports (Figure 3). We estimate that these exports accounted for roughly 2 percent of total value added in China. Not only are Chinese exports to the United States significantly larger than American exports to China, but the service sector is not as important in China (in terms of overall value added) as it is in the United States. Consequently, it appears that China would have more to lose than the United States from an all-out trade war, should one develop.
Other Potential Knock-On Effects
But, there could be other knock-on effects from a trade war that could potentially have deleterious consequences for the U.S. economy. Since March 8, when the Trump administration announced that it would levy tariffs on imports of steel and aluminum products, the Wilshire 5000 stock market index has declined about 4 percent on balance. Consequently, American households have lost about $700 billion in wealth via lower share prices. True, $700 billion is a relatively small amount in terms of the $99 trillion of net worth that American households have. But, share prices likely would decline even further if a full-blown trade war were to occur. Lower wealth could lead to slower growth in U.S. consumer spending.
Furthermore, China holds more than $1 trillion worth of U.S. Treasury securities, which represents almost 7 percent of the total marketable debt outstanding of the U.S. government. China could start to unload these securities, or threaten to do so, which could cause the price of Treasury securities to weaken significantly. The corresponding rise in bond yields could also lead to slower economic growth in the United States.
Conclusion
Whether the tariffs that the United States and China have levied on each other lead to a full-blown trade war between the world's two largest economies is yet to be determined. The business environment would be more challenging for establishments in the agricultural, motor vehicles, aircraft and chemicals industries if China does indeed levy tariffs on those goods, but the overall effect on the U.S. economy should be limited, at least in the near term. A full-blown trade war, in which the United States and China levied tariffs on all the goods that each country exports to the other, would not necessarily bring the U.S. economy to its knees, due to the relatively small amount (in terms of overall value added) that the United States exports to China. But, there could be other knock-on effects, which are difficult to quantify, that could raise the pain for the United States. The stock market likely would weaken, which would result in a hit to wealth of American households, and bond yields in the United States could rise if China started to unload some of its sizable holdings of U.S. Treasury securities. In sum, a full-blown trade war is probably not in the best interests of the United States.
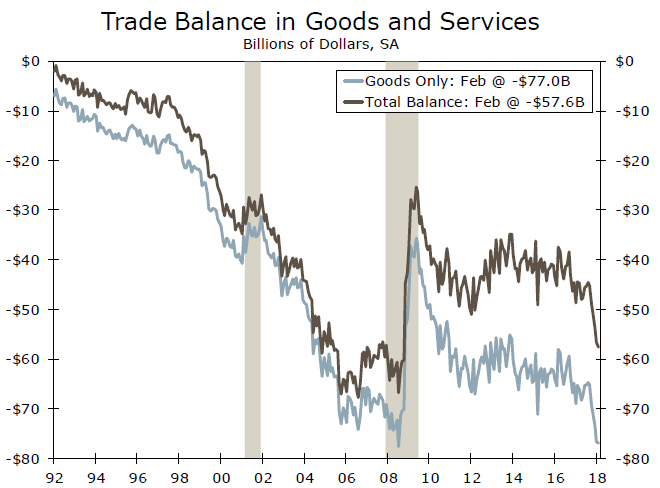
U.S. Trade Deficit Widened Even Further in February
The U.S. trade deficit rose to yet another post-Great Recession high in February. It probably will widen even further in coming months.
Exports Rise, But Imports Grow Even More
The U.S. trade deficit widened even further in February, rising to yet another post-Great Recession high of $57.6 billion (top chart). The trade gap was higher than most analysts had expected. Although exports of goods and services were up by $3.5 billion during the month, imports jumped even more, rising by $4.4 billion.
The increase in exports in February may reflect, at least in part, some statistical payback for the sizeable decline that occurred during the previous month. Drilling down into individual categories shows that there generally was broad-based strength in exports in February, with gains in industrial supplies and materials ($2.0 billion), capital goods ($658 million) and autos ($925 million). Exports of consumer goods fell by $840 million in February, but this seems to be more of a one-month outlier rather than a general trend. Indeed, with economic growth remaining solid in the rest of the world and with the trade-weighted value of the dollar down about 9 percent from its high in late 2016, U.S. export growth should remain resilient in coming months.
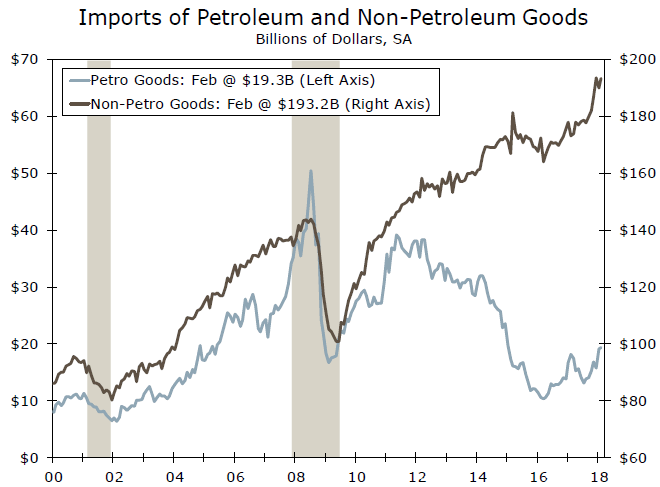
There was broad-based strength on the import side of the ledger as well. Higher prices of oil led to a modest increase ($256 million) in imports of petroleum products in February. But most of the increase in total imports reflects gains in non-petroleum products (middle chart). Solid growth in U.S. domestic demand in recent months continues to pull in imports, and we expect this dynamic to remain intact in coming months as well. We wrote at the beginning of the year that the trade deficit likely will continue to widen, and we stand by that prognostication.
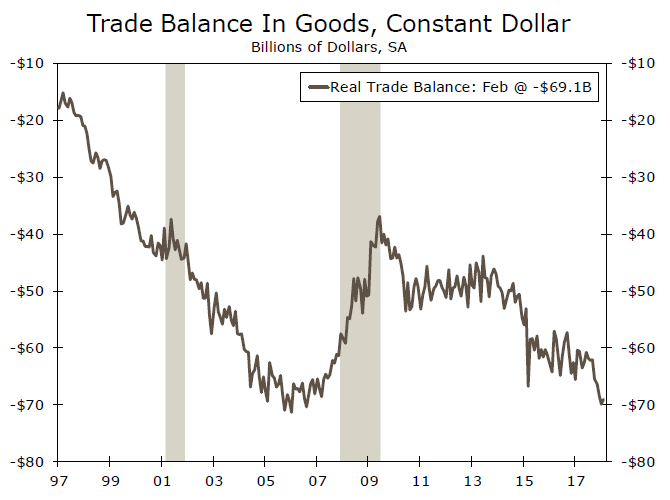
Net exports exerted a 1.2 percentage point drag on GDP growth in the fourth quarter of 2017, and it appears that the foreign sector continued to exert headwinds on U.S. GDP growth in the first quarter. Not only has the nominal trade deficit widened in recent months, but so too has the real trade deficit, which matters for real GDP growth (bottom chart). If the volume of exports and the volume of imports remained unchanged in March, then real net exports will exert a drag on real GDP growth that would be equal to ¾ of a percentage point.
We wrote above that exports and imports should continue to trend higher in coming months. A potential fly in that ointment would be tariffs that the United States and China have threatened to levy on each other's products in coming months. A full-blown trade war between the world's two largest economies, should one develop, probably would not cause American exports and imports to go into reverse, but it could weaken growth in trade. We have written a number of reports in recent weeks on the escalating trade tensions between the United States and China, and we refer interested readers to our website where these reports are posted.
Canada’s Trade Deficit Widened More than Expected in February
Highlights:
- Canada’s nominal trade deficit widened to $2.7 billion in February from $1.9 billion in January. A modest 0.4% increase in exports was more than offset by a 1.9% jump in imports. The rise in imports was broadly based but led by a significant, volume-driven increase in energy imports.
- Both aircraft and motor vehicle exports rebounded in February. The latter reflected the end of “atypical plant closures” that weighed on exports in the prior month.
- A 17% decline in agricultural exports, reportedly due to rail transportation issues in Western Canada, partially offset stronger shipments in the transportation sector.
- Machinery and equipment import volumes were relatively flat in February. That followed a sizeable decline in January after purchases were brought forward into 2017 ahead of a change in environmental regulation.
Our Take:
As is often the case with Canada’s trade data, some sizeable swings in individual product categories made for a noisy report. On the import side, a significant jump in energy imports accounted for more than half of the widening in Canada’s trade deficit in February. On the export side, transportation difficulties were reportedly behind a sharp drop in agricultural shipments. In January it was a shutdown in the auto sector that temporarily weighed on exports. On balance, imports are roughly flat so far this year relative to last quarter while exports have declined sharply. That points to net trade once again acting as a drag on GDP growth in Q1/18.
Growth in Canada’s non-energy exports has been disappointing for the better part of two years now. Concerns about US trade policy might be weighing on the sector somewhat, and recent reports of progress in Nafta talks suggest that headwind could soon ease. But trade uncertainty can hardly account for Canada not being able to take advantage of the recent upswing in global growth and a strong economy south of the border. Competitiveness challenges likely deserve some of the blame for export underperformance, and that is a headwind that won’t soon abate. So outside of a rebound in exports in Q2, we are expecting only limited support to the economy from trade going forward.
Sunset Market Commentary
Markets:
European stock markets joined the rally which started on WS yesterday as high rank US and Chinese officials indicated the start of a negotiating period after placing hawkish opening bets in the trade conflict. Main indices opened around 1.5% higher and managed to maintain momentum, recording gains of more than 2% currently. US stock markets build on yesterday’s increase and open 0.5% higher. Second tier EMU eco data were mixed and had no influence on today’s dealings. US weekly jobless claims unexpectedly picked up, but were distorted by Easter holiday. Core bonds grinded gradually lower throughout the session on the improvement in risk sentiment. Both the US and German yield curves bear steepened. Traded volumes were lower than on the previous two days with some investors side-lined ahead of tomorrow’s payrolls and a speech by Fed-governor Powell. US yields add 0.6 bps (2-yr) to 2.4 bps (30-yr) while changes on the German curve range between +0.9 bps (2-yr) and 2.6 bps (30-yr). 10-yr yield spread changes versus Germany are barely changed with Greece underperforming (-13 bps).
The dollar profited from the easing in trade tensions and the improvement in risk sentiment with several crosses hitting first technical levels. The trade weighted greenback (DXY) hit first resistance at 90.45. A break would pave the way for a test of the more important 91-area. USD/JPY trades north of 107. A move above 107.29 would end the negative momentum in the currency pair. EUR/USD tested 1.2240, which is this month’s low and settles currently around 1.2250. We’d argue in favour of technical breaks and an improvement for the dollar’s short term perspectives if tomorrow’s payrolls (and especially earnings) beat consensus.
Sterling couldn’t profit from the improving risk climate today. EUR/GBP climbed gradually from 0.8720 to 0.8740. A disappointed services PMI could have been a possible explanation, but timing of the release doesn’t coincide with the sterling losses. Technical factors are probably at play.
News Headlines:
EMU eco data printed mixed today. The final EMU services PMI faced a slight downward revision in March, from 55 to 54.9 (coming from 56.2 in February). Businesses across the euro zone ended the Q1 2018 with their weakest expansion since the start of 2017 as bad weather and a strong currency combined to curb growth in new orders. Retail sales disappointed in February, rising 0.1% M/M and 1.8% Y/Y while also February data were reviewed lower to -0.3% M/M and 1.5% Y/Y. Producer price inflation accelerated a tad faster than forecast (0.1% M/M vs 0% M/M) while stabilizing at 1.6% on a yearly basis.
Heavy snow and weak consumer demand weighed on British services businesses last month, which grew at the slowest rate since just after the vote to leave the EU in June 2016. The services PMI declined from 54.5 to 51.7 while consensus only expected a smaller setback to 54.0.
US weekly jobless claims rose more than forecast last week to the highest level in almost three months (242k from 218k). However, holidays related to the Easter weekend probably played a role.
Italian President Sergio Mattarella faces an uphill task trying to put together a new government, with centre-right parties split on their priorities and the centre-left vowing to head into opposition.
EUR/TRY rose above 4.95, heading to a record high close with the Turkish lira hit by renewed concerns about the central bank's ability to tackle inflation after a report that President Erdogan criticized last month’s rate hike.
Canadian PM Trudeau: High chance of win-win-win deal of NAFTA
Canadian Prime Minister Justin Trudeau also expressed his optimism regarding NAFT renegotiation. He told reports that "we have a high chance of reaching a win-win-win deal for Canada, the United States and Mexico."
And, "with the pressures of the elections in Mexico, and the U.S. elections, if we could announce something at the Summit of the Americas, that would be great."
That is the April 13-14 summit of regional leaders of the Americans in Peru. And it's rumored that there will be at least a symbolic NAFTA agreement reached for announcement during the summit.
Trump’s Economic Advisor Kudlow: US GDP could hit 5% as catch up
US National Economic Council Director Larry Kudlow talked to FOX Business News. He said US annual GDP could hit 5% growth as a "catch up". He pointed to the "long-term trend line for GDP versus the actual now". And added that the US is like "several trillion dollars below where we should be based on the long-term trend lines". And he wants to "get back to that full potential".
Kudlow also said he expected trade barriers between US and China will come down on both sides as part of a deal. Earlier, he emphasizedd that "none of the tariffs have been put in place yet, these are all proposals." And Trump's administration is "putting it out for comment". He added "there's at least two months before any actions are taken".