Sample Category Title
Tumbling Dollar
Tumbling dollar
The USD is in a bear market. Japan’s yen has defied fates by not caving into interest rate differentials, which would have sent USD/JPY significantly higher than its current 106. Still, political scandal, lingering risk aversion and the expected removal of Abenomics has traders forecasting a stronger yen. Meanwhile, German price-index figures released today suggest the European Central Bank might be too relaxed about inflation. Expectations were that inflation would remain around 1.5% through 2018, but it looks as if the rate might be accelerating. If so, the ECB is likely to end its loose money policy by September, which would spike the EUR/USD. In the home of the USD, worries about the collapse of the North American Free Trade Agreement are declining. Mexico’s peso is the clear winner in Q1, benefitting from higher oil prices,
South African doves
South Africa’s central bank confirmed its dovish policy on Wednesday, lowering its interest rate on repos by 25 basis points to 6.50%, its lowest since January 2016. February’s consumer price index shows that inflation is under control at 4% annualised (January: 4.40%) and is expected to slow in March, as the rand has strengthened since the middle of November 2017 (USD/ZAR: -18.28%). The resignation of President Jacob Zuma (and the stepdown of Zimbabwe’s President Robert Mugabe’s) have boosted the ZAR, thus reducing the cost of imports in the country.
With treasuries gradually nearing investment-grade rankings from all three major rating agencies, South Africa’s economy showing clear signs of improvement. With improved manufacturing and increasing exports in March, we expect GDP growth to head towards the 1.80% range (February: 1.50%). USD/ZAR is trading at 11.82, bouncing back from a 11.62 low earlier this week and continuing its short-term rise toward 11.83.
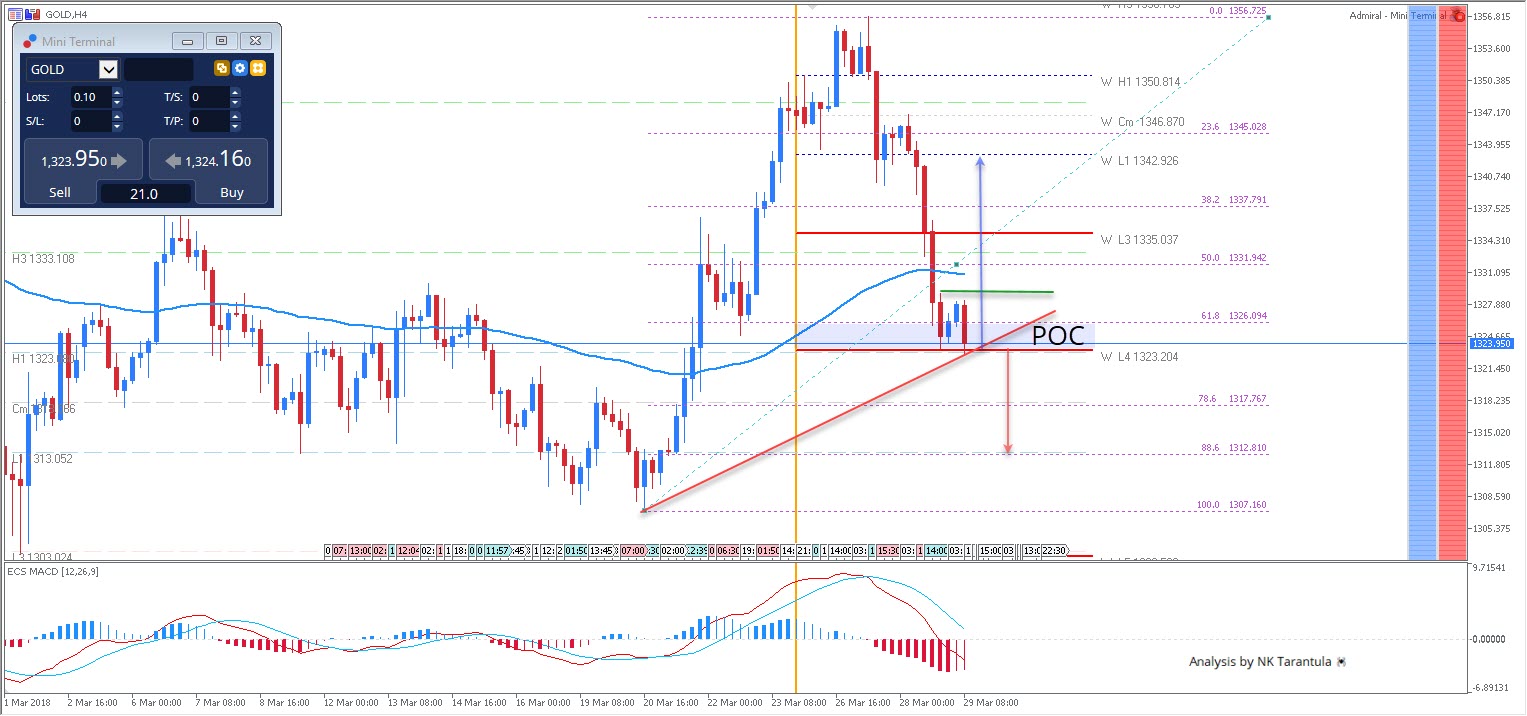
GOLD Is Supported At 61.8 Fibonacci Level
The Gold made a huge push to the upside reaching 1356 zone before it dropped to 61.8 fibonacci and W L4 confluence. At this point the Gold is at crossroads. There are two possible scenarios. The price could spike from the POC zone 1323-1326 towards 1335 and 1342. In that case a clear 4h close above 1342 is needed for a further push towards 1356. The second scenario is the breakout and close below W L4 -1323. The drop could target 78.6 and 88.6 fibs at 1317.76 and 1312.81 respectively.
W L3 - Weekly Camarilla Pivot (Weekly Interim Support)
W H3 - Weekly Camarilla Pivot (Weekly Interim Resistance)
W H4 - Weekly Camarilla Pivot (Strong Weekly Resistance)
D H4 - Daily Camarilla Pivot (Very Strong Daily Resistance)
D L3 – Daily Camarilla Pivot (Daily Support)
D L4 – Daily H4 Camarilla (Very Strong Daily Support)
POC - Point Of Confluence (The zone where we expect price to react aka entry zone)
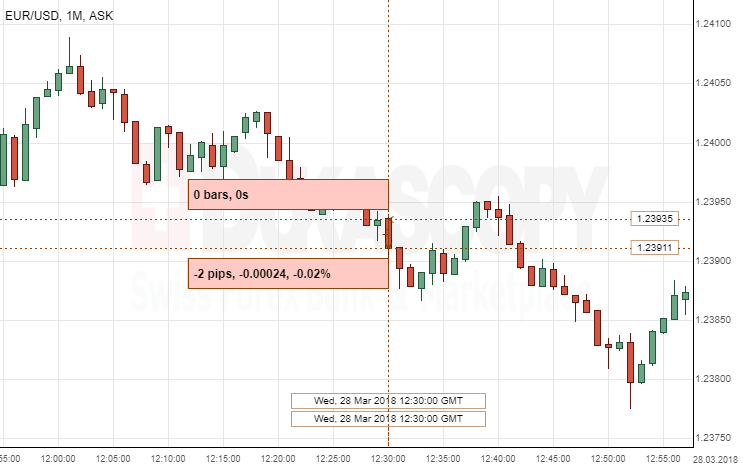
EUR/USD: US Final GDP
The Greenback strengthened against the Euro, following the US final gross domestic product data released on Wednesday. The EUR/USD currency pair lost only two pips, or 0.02%, in the first minute after the release, to continue fluctuating in the 1.2385 area.
The Bureau of Economic Analysis revealed higher final GDP in the Q4 2017, however the market remained almost unchanged. The Bureau of Economic Analysis reported a growthof 2.9%, surpassing the expectations and following a 3.2% growth rate recorded in the previous period. One of the main reasons for the US economy to expand more than forcast is the increase in consumer spending.
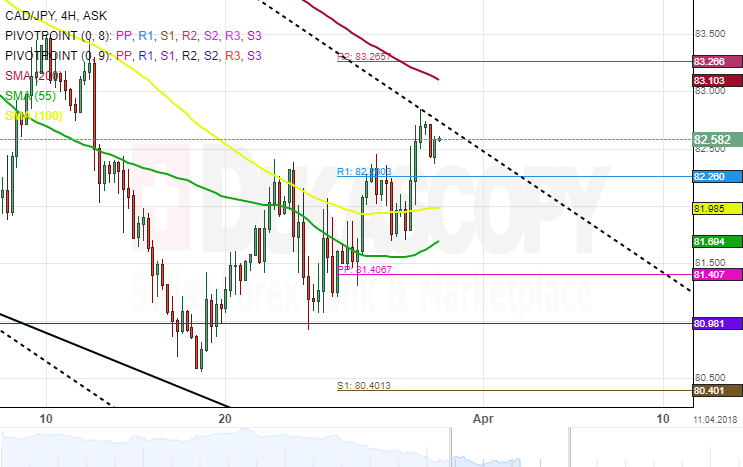
CAD/JPY 4H Chart: Pair Flashes Mixed Signal
The Canadian Dollar has depreciated substantially against the Japanese Yen since February. This bearish momentum has been steered by an eight-week descending channel. During the past week, however, this bearish movement has not been so distinctive, as the rate made corrective moves north.
The currency pair has tested the upper boundary of a junior channel. This movement was supported by 55– hour SMA at 81.66 and the 100– hour simple moving average at 81.93.
The overall market sentiment is bearish and it is likely to continue for the following trading sessions until it finds support at the weekly pivot point near the 80.40 regions.
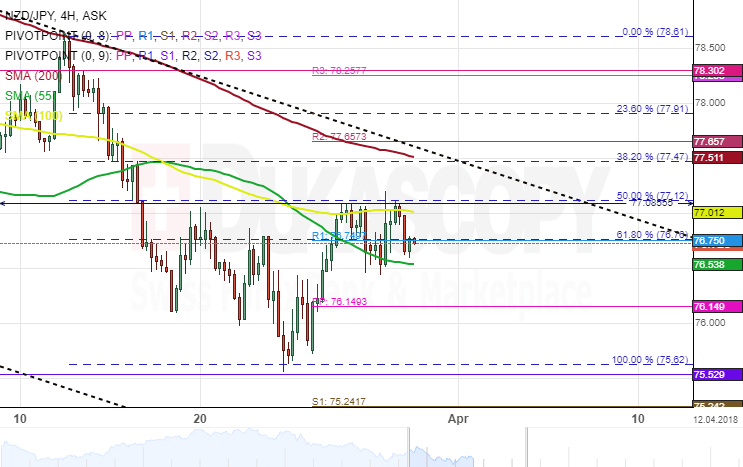
NZD/JPY 4H Chart: Berish Sentiment
The NZD/JPY exchange rate has been constrained by an eight-month descending channel against the Japanese Yen. During this period of decline, the currency pair has formed several patterns. The most recent of which is the dotted junior down channel which was formed on January 22.
In the four-hour time frame, the currency exchange rate hit the 50.00% Fibonacci retracement level and reverse south. This retracement can be measured by connecting the low at 75.62 and the high at 78.61.
Technical indicators suggest that the pair is likely to continue its bearish movement until it finds the next support level at 76.14. However, the price has to breach the 55– hour simple moving average which is located at 76.53.
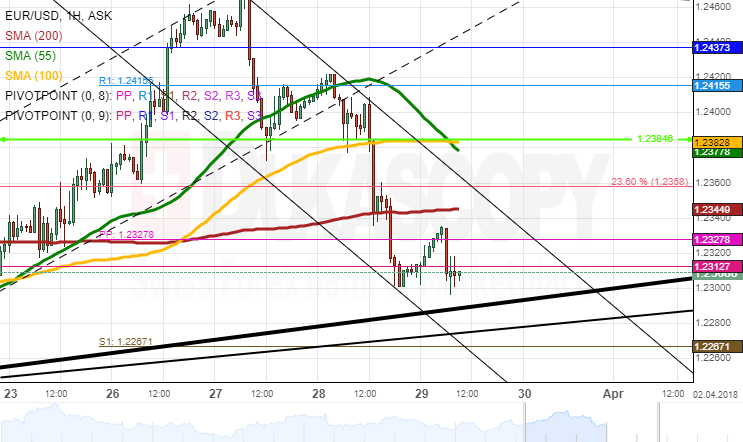
EURUSD Analysis: Bounces Off 1.23
Wednesday's session was spent in a relatively calm manner for EUR/USD, as the rate remained fluctuating between the weekly R1, the 55– and 100-hour SMAs and a strong resistance/support level at 1.2385.
The necessary momentum to breach the southern barrier was provided mid-session. Better-than-expected US GDP data put downward pressure on the pair as a result of which the Euro plunged 0.84% in a couple of hours. The 200-hour SMA and the weekly PP were likewise breached.
It is expected that the general tendency for the pair is northwards today, as supported by technical indicators. Bulls could find some resistance near the 1.2350 area, but it should eventually be breached to allow for a test of the daily high at 1.24. Meanwhile, a fall below 1.23 is unlikely.
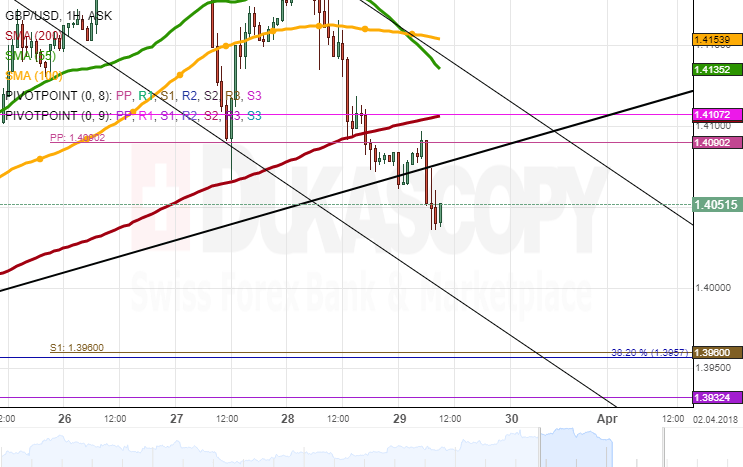
GBPUSD Analysis: More Bullish Today
Downside risks dominated the GBP/USD exchange rate on Wednesday. The failure to surpass the 55-hour SMA early in the session was followed by a decline in price.
This bearish momentum was strengthened mid-session in response to solid US GDP data. The market reaction to this fundamental release was limited 40 pips.
A southern breakout of the 200-hour SMA, the monthly R1 and the weekly PP could point to further decline within this session. Downward potential is until the 1.40 mark.
Conversely, oversold technical indicators suggest the opposite. This bullish scenario is likewise reinforced by the fact that the Pound has reached the bottom boundary of a four-week channel circa 1.4090. In case the 1.41 area is breached, the pair is likely to struggle near the 55– and 100-hour SMAs at 1.4150.
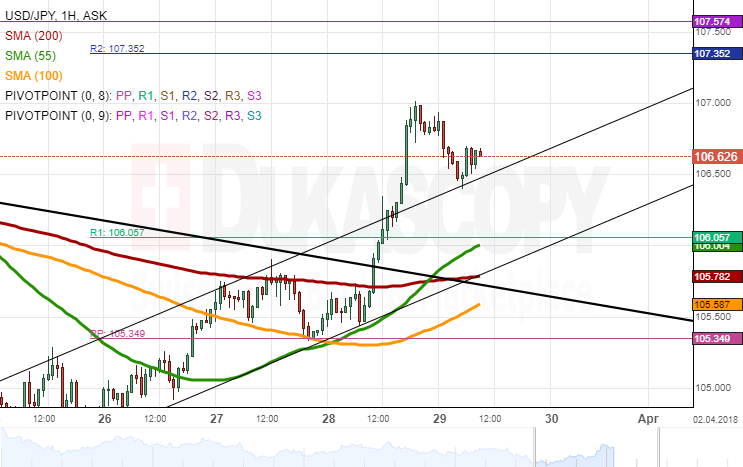
USD/JPY Analysis: Likely To Approach 106.00
The US Dollar rallied significantly against the Yen on Wednesday, seemingly being supported by a decrease in risk sentiment. The pair gained 1.43% throughout the day until it reversed at the psychological 107.00 mark.
Bears managed to re-gain some of their lost positions during the Asian session, thus pushing the rate towards the upper boundary of the previously-breached channel. The same bearish sentiment is likely to dominate the market today.
The Greenback could target a support cluster formed by the 55– and 200-hour SMAs near 105.80. This level should likewise mark the ultimate low for today.
Conversely, bulls might still try to use the slight potential up to the 107.40 level where the monthly PP and the weekly R2 are located.
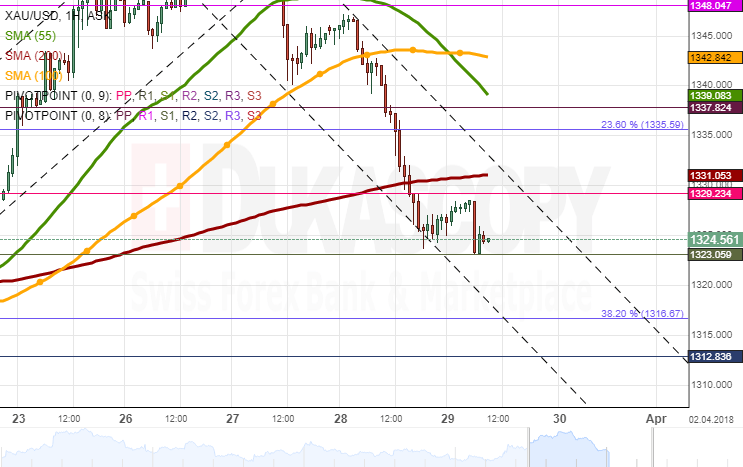
XAU/USD Anslysis: Moves Below 200-Hour SMA
The yellow metal continues to slide lower against the US Dollar for the third consecutive session.
The pair lost 1.58% on Wednesday, consequently breaching several important support clusters, including the 200-hour SMA and the monthly PP near 1,330.00. This strong downside momentum allayed later in the session when Gold tried unsuccessfully to regain its position above the long-term moving average.
Technical indicators flash bullish signals in this session, as they are located in the oversold territory. However, it is yet to be seen if the strong resistance at 1,330.00 is breached, because bulls might lack the necessary force to overcome this cluster.
In terms of downside potential, the rate is likely to target the 38.20% Fibonacci line at 1,317.00.
UK Q4 GDP finalized at 0.4% qoq, little reaction from GBP
A batch of data is released from UK:
- GDP Q/Q Q4 F: 0.4% vs exp 0.4% vs prior est 0.4%
- Current account (GBP) Q4: -18.4b vs exp -23.7b vs prior -22.8b
- Index of services 3M/3M Jan: 0.6% vs exp 0.6% vs prior 0.6%
- M4 money supply M/M Feb: -0.4% vs exp 1.3% vs prior 1.5%
- Mortgage approvals Feb: 64k vs exp 66k vs prior 66k
There is little reaction to the set of data as expected.
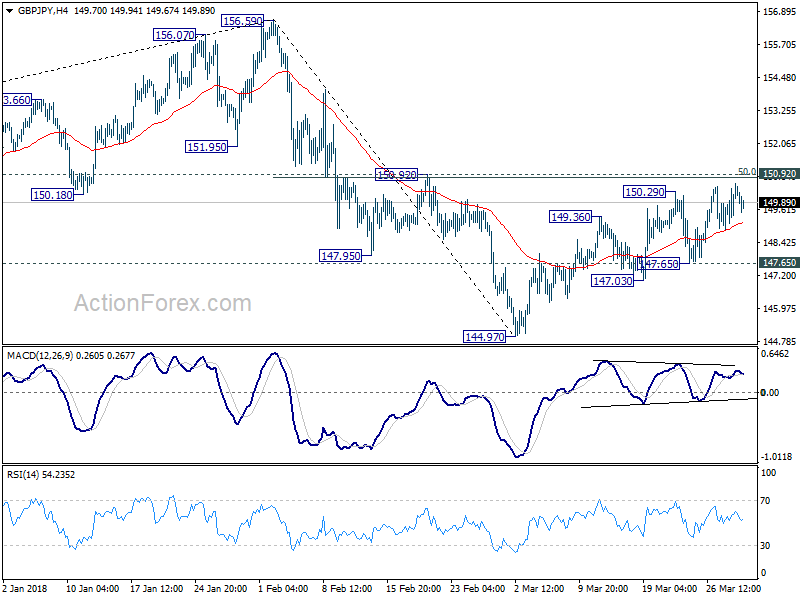
For us, the main question is on when GBP/JPY's corrective rise from 144.97 would end. Should be about time as it once again lose momentum as it approaches key resistance level at 150.92.