Sample Category Title
EUR/CHF Strengthening
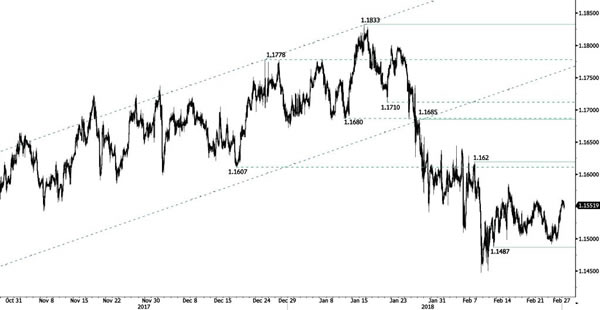
EUR/CHF is consolidating at the 1.155 range after rising from 1.1496 low (26/02/2018). The pair is trading between hourly support and resistance given at 1.1487 (12/02/2018 low) and 1.162 (07/02/2018 high). The technical structure suggests short-term sideway moves.
In the longer term, the technical structure has reversed. Strong resistance is given at 1.20 (level before the unpeg). Yet, the ECB's slowing QE program is likely to cause buying pressures on the euro, which should weigh in favour of the EUR/CHF. Support can be found at 1.0234 (20/04/2015 low).
EUR/GBP Bouncing Higher
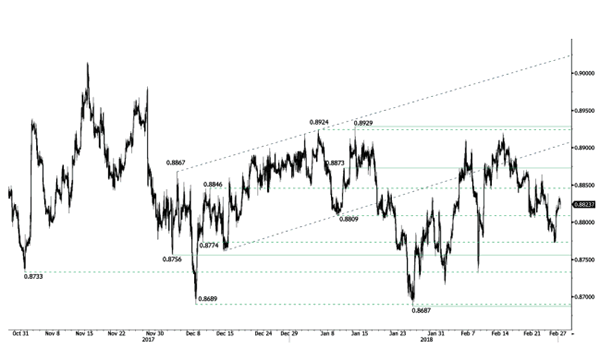
EUR/GBP resurgence above 0.882 slowly decreases, heading for 0.88. Hourly support is given at 0.8756 (04/12/2017 low) while hourly resistance remains at 0.8873 (10/01/2018 high). The technical structure suggests short-term downside moves.
In the long-term, the pair has largely recovered from 2015 lows. The technical structure suggests further upside pressure. Strong resistance can be found at 0.9500 (psychological level) while support remains at 0.8304 (05/12/2016 low). The pair is trading below its 200 DMA.
AUD/USD Weakening
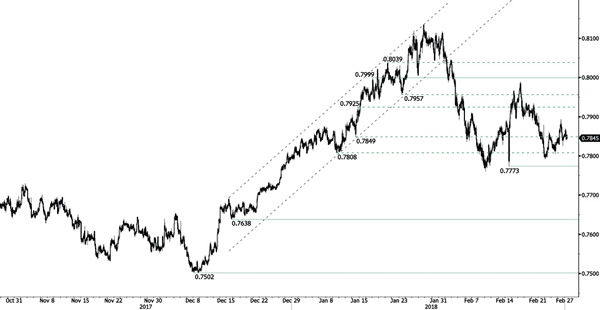
AUD/USD recovery falters, the pair is heading lower along the 0.78 range. AUD/USD currently trades along hourly support and resistance at 0.7773 (14/02/2018 low) and 0.7999 (17/01/2018 high). The short-term technical structure suggests further downside moves.
In the long-term, the upward trend slows down after failing to reach key resistance at 0.8164 (14/05/2015 low). Key support stands at 0.6009 (31/10/2008 low). A break of the key resistance at 0.8164 (14/05/2015 high) is needed to invalidate our long-term bearish view.
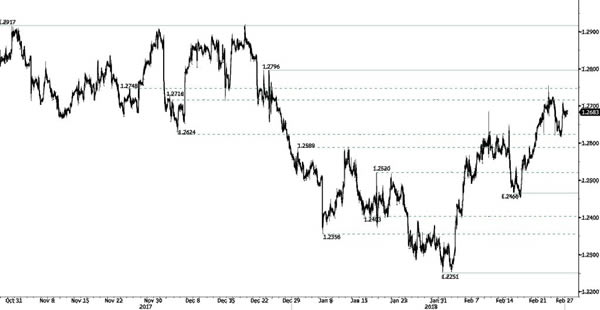
USD/CAD Sideways Trading
USD/CAD recent bounce brings the pair back to the 1.27 range, where it is currently stabilized. January upward pattern is maintained, approaching hourly resistance at 1.2796 (25/12/2017 high). Hourly support is maintained at 1.2466 (15/02/2018 low). The technical structure indicates that continued rise is expected in the short-term.
In the longer term, the pair is trading between resistance point at 1.3805 (05/05/2017 high) and support at 1.2128 (18/06/2015 low). Strong resistance is given at 1.4690 (22/01/2016 high). The pair is likely to head lower. The pairs is trading at its 200 DMA.
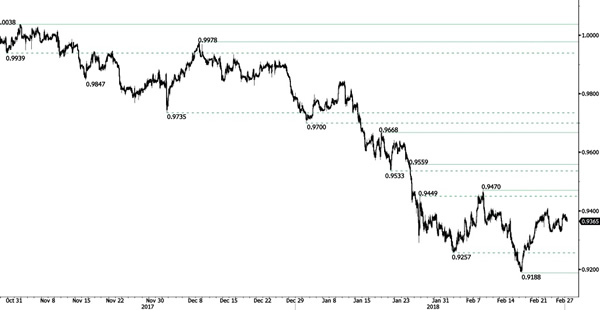
USD/CHF Approaching 0.94
USD/CHF sideways trading is maintained but presents potential for further rise along hourly resistance at 0.9470 (08/02/2018 high). Hourly support remains at 0.9188 (16/02/2018 low). The technical structure suggests short-term increase.
In the long-term, the pair is still trading in range since 2011 despite some turmoil when the SNB unpegged the CHF. Key support lies at 0.9072 (07/05/2015 low) while resistance at 1.0344 (15/12/2016 high) is distanced. The technical structure favours a long term bullish bias since the unpeg in January 2015.
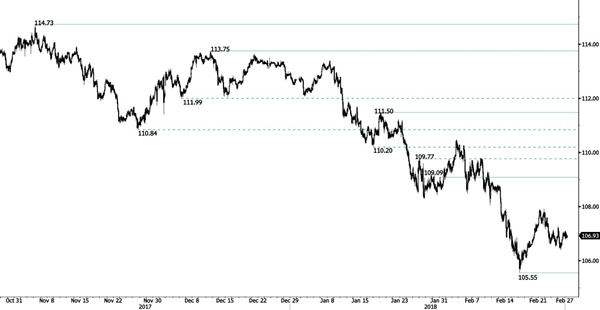
USD/JPY Buying Pressures
USD/JPY trades slightly higher since yesterday trading session. The USD/JPY bearish trend is however maintained, heading for the 106 range. Hourly support and resistance are given at 105.55 (16/02/2018) and 109.09 (31/01/2018 high). The technical structure suggests shortterm downside moves.
We favor a long-term bearish bias. Support at 105.55 (03/05/2016 low) is almost reached. A gradual rise toward the major resistance at 125.86 (05/06/2015 high) seems unlikely. Expected to decline further support at 101.20 (09/11/2016 low).
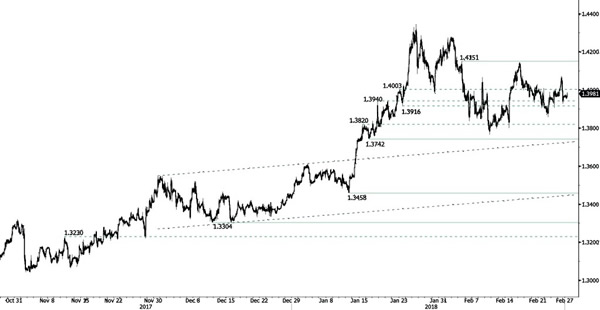
GBP/USD Slight Decrease
GBP/USD trades at the 1.40 range, the upward momentum is maintained. Edging higher along hourly resistance at 1.4151 (05/02/2018). Hourly support is given at 1.3742 (16/01/2018 low). The technical structure suggests further short-term upside moves.
The long-term technical pattern is reversing. The Brexit vote had paved the way for further decline but the pair is moving to 2016 highs. Long-term support and resistance are given at 1.1841 (07/10/2017 low) and 1.5018 (24/06/2016 high).
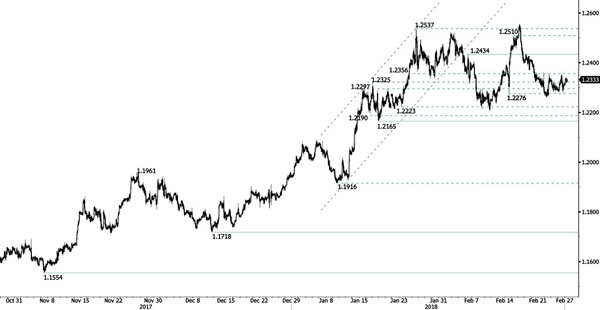
EUR/USD Pausing Before Another Leg Higher
EUR/USD is turning positive, heading to hourly resistance at 1.2434 (06/02/2018 high). Hourly support remains at 1.2165 (17/01/2018 low). The technical structure suggests upside moves.
In the longer term, the momentum is turning largely positive. We favor a continued bullish bias. Key resistance is holding at 1.2886 (15/10/2014 high) while strong support lies at 1.1554 (08/11/2017 low).
EUR Treads Water Despite Optimistic Draghi
China slips towards dictatorship
According to new flow the ruling Chinese Communist Party will move to allow President Xi Jinping to stay in power ad infinitum. A next month's annual session the counties parliaments the National People Congress projected to pass the proposed amendment. This act will shift the 1982 constitution, which limited the President's term to two five-year terms in office. The government of China holds no competitive elections for leadership positions and body responsible for decision on Presidential term and constitutional amendments generally rubberstamps the party's agenda. While limiting personal freedom and increasing the likelihood of authoritarian state cannot be a positive for humanity. However, safeguarding some degree of political stability provides comfort for investors.
President Xi Jinping extending his rule doesn't come without political risk. Centralizing power make Xi solely responsible for results. However, limited red tape means he can focus on ballooning public debt, nonexistent welfare system, rebalancing from export to consumer led growth, and geopolitical diplomacy.
Core to your investment story based partially on China's protectionist behavior around key domestic companies. Consolidation of power by President Xi Jinping support this theme. Elsewhere, US President Trump is expected to slap global tariffs on US steel and aluminum imports sometime this week. While affecting other nations China will be impacted. Some would say China is Trumps primary target. This shotgun trade policy is unlikely to be well received by an all-powerful Xi.
Draghi Speech gives comfort to investors
Draghi held a positive tone yesterday, reassuring investors that inflation is underway as growth continues to take effect. Draghi also mentioned that further increase in employment (published in March 14th 2018) and a pickup in wage growth will support consumer-price growth. February Consumer Price Index Estimate Y/Y published on Wednesday will most probably remain below the 2% target (estimated at 1.50%). An additional impediment for monetary policy authorities is the recent weakening correlation between growth and inflation that renders tackling inflation target much more challenging.
European markets remained solid after the announcement, the Euro Stoxx 50 rose at 3'463 points (+0.63%), supported by Consumer Staples (+1.59%), Information Technology (1.21%), Health Care (+0.92%) and Materials (+0.68%), all sectors remaining green. Major European markets also closed in positive figures (FTSE 100: +0.62%, DAX: +0.35%, CAC40: +0.51%, Ibex 35: +0.81%, FTSE MIB: +0.15% and SMI: +0.87%). Eurozone Government yields remained stable, currently valued at 0.658% (10-year) and -0.535% (2-year).
USD/JPY Could Spike To W H3 Pivot If Bullish Momentum Persists
The USD/JPY has formed a W bullish pattern straight from the W L3 support. We can also spot an ascending trend line supporting the bullish outlook. The POC zone 106.85-107.00 could spike the price upwards towards 107.15 and 107.36. However, a 4h close above 107.36 is needed for a continuation towards 107.70-85. Only below 106.50, the price should turn bearish and possibly reach 106.17.
W H3 -Weekly Camarilla Pivot (Weekly Interim Resistance)
W L3 - Weekly Camarilla Pivot (Weekly Interim Support)
W H3 - Weekly Camarilla Pivot (Weekly Interim Resistance)
W H4 - Weekly Camarilla Pivot (Strong Weekly Resistance)
D H4 - Daily Camarilla Pivot (Very Strong Daily Resistance)
D L3 – Daily Camarilla Pivot (Daily Support)
D L4 – Daily H4 Camarilla (Very Strong Daily Support)
POC - Point Of Confluence (The zone where we expect price to react aka entry zone)