Sample Category Title
Technical Outlook: AUDUSD – No Clear Direction While The Price Holds In Daily Cloud
The pair remains within daily cloud on Tuesday, after upside attempts in Asian session stalled under cloud top (0.7878), maintaining downside risk. Yesterday's strong upside rejection at 0.7893 and close within daily cloud was also negative signal, but clear near-term direction could be expected while the price holds in cloud. Mixed daily studies (MA's in bearish setup, but momentum studies improving) add to current outlook. On the other side, near-term techs are weak and keep the downside at risk. Break below Monday's low (0.7825) will be bearish signal for possible extension towards key supports at 0.7790 (22 Feb low) and 0.7770 (daily cloud top). To neutralize bearish threats, close above daily cloud is required. Speech of Fed's Chair Powell would provide stronger direction signal.
Res: 0.7868, 0.7878, 0.7913, 0.7947
Sup: 0.7825, 0.7803, 0.7790, 0.7770
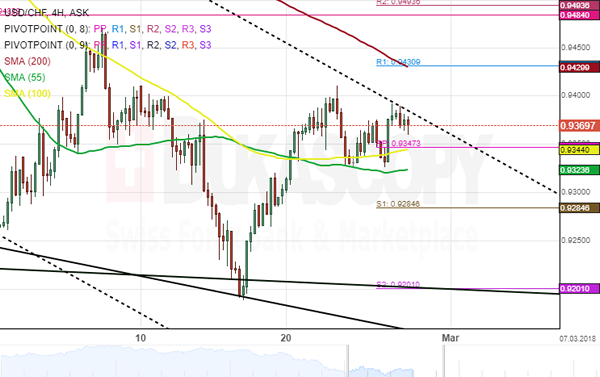
USD/CHF 4H Chart: Set For Breakout
The US Dollar has been bound in several long and short-term patterns which have guided the price lower since October 2017.
The currency pair is likely to continue falling within the following trading sessions in line with the medium-term pattern. The pair is currently trading near the border of the junior channel and could breach the upper boundary in the short term.
If and when this situation happens, the rate would encounter a resistance cluster set by the combination of the 200-hour simple moving average and the weekly R1 near 0.9428. Traders should look for opportunities to trade either direction if the aforementioned scenario occurs.
The exchange rate has been trading in a large-scale triangle after it hit the upper boundary on November 30, 2017. Also, the currency pair has formed a new junior pattern during this period.
A support cluster set by the combination of the 55-, and 200—hour SMAs and the weekly pivot point at 1.6839 was providing enough support to push the price north. However, the surge could be stopped by the weekly R1 at 1.6945 near the border of the junior pattern.
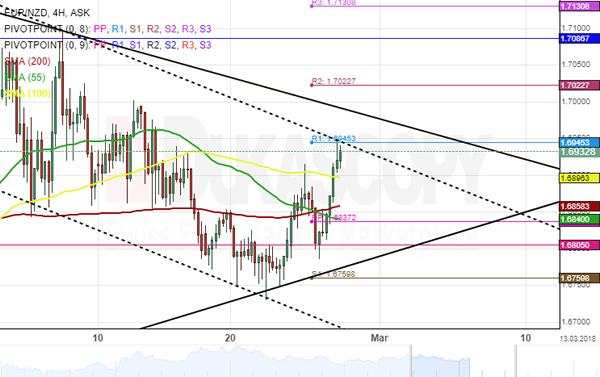
EUR/NZD 4H Chart: Pair Likely To Breach Triangle
The common European currency continued to appreciate against the New Zealand Dollar after the pair touched the lower bottom of an ascending trend-line.
The exchange rate has been trading in a large-scale triangle after it hit the upper boundary on November 30, 2017. Also, the currency pair has formed a new junior pattern during this period.
A support cluster set by the combination of the 55-, and 200—hour SMAs and the weekly pivot point at 1.6839 was providing enough support to push the price north. However, the surge could be stopped by the weekly R1 at 1.6945 near the border of the junior pattern.
Gold Analysis: Supported By 55-Hour SMA
Following a period of strong appreciation on Monday morning, Gold was halted by the combined resistance of the 200-hour SMA and the monthly PP near the 1,340.00 mark. Most gains were erased during the following hours, thus leaving the rate circa 1,332.00 by Tuesday morning.
The 55-hour moving average has guided the pair's movement since mid-yesterday. This situation might continue during the first part of the day, thus narrowing its trading range within the bounds of this line and the 200-hour SMA.
The current positioning of the short-term channel up demonstrates that the yellow metal might still reach the senior channel circa 1,340.00 in this session. However, US fundamentals released later in the day could likewise introduce some bearish pressure towards the 1,320.00 mark.
EUR/USD Analysus: Steady Prior To Fundamentals
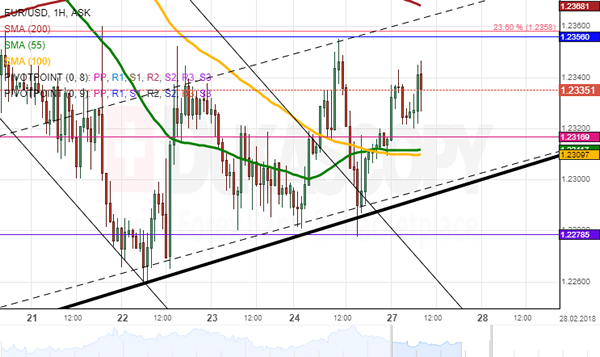
The common European currency was fluctuating around the 55– and 100-hour SMAs during the previous session. However, the general price movement has not changed since Monday morning.
As apparent on the chart, the price is still tended slightly upwards, as it is moving along the bottom line of a four-month channel up for the third consecutive session. Technical indicators flash mixed signals for today, suggesting that the current steady movement might prevail within the following hours, as well.
It is likely that volatility is introduced in the second part of the day is due to three sets of significant fundamentals published by the US during this time. A strong support could be provided by the 55– and 100-hour SMAs circa 1.23, while gains should be capped near the weekly R1 at 1.2402.
GBP/USD Analysis: Stranded In Narrow Range
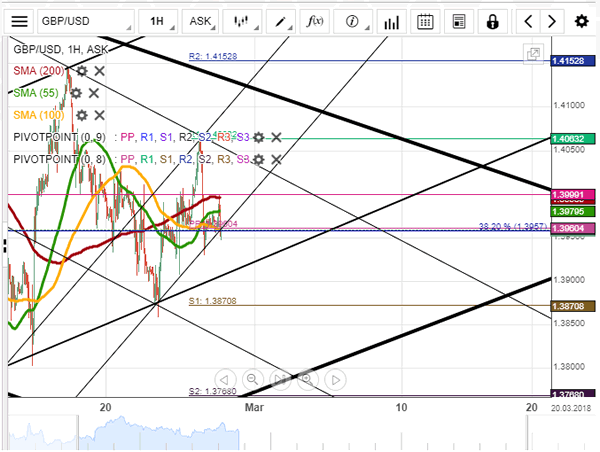
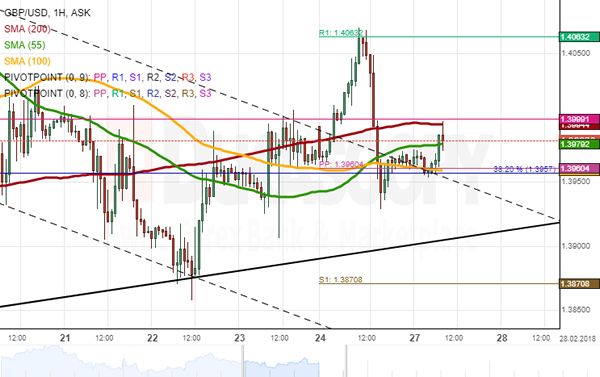
The Pound showed high volatility against the US Dollar on Monday, as the pair was trading in the 1.4063/1.3941 area during this time. Strong bearish sentiment took over the market mid-session when the rate plunge 121 pips within a couple of hours.
It has since been moving in a narrow range, thus not being able to surpass the strong bounds of the 55– and 100-hour SMAs, the weekly PP and the 38.20% Fibo retracement. Given that the northern barrier is likewise limited by the 200-hour SMA and the monthly PP, the Sterling might fail to make big advances in either direction for a couple of hours.
It is expected that support surrenders soon, forcing the rate down to the weekly S1 at 1.3871. In case fundamentals do not disrupt the current market sentiment, the rate is unlikely to move above 1.40.
USD/JPY Analysis: Two Scenarios Possible
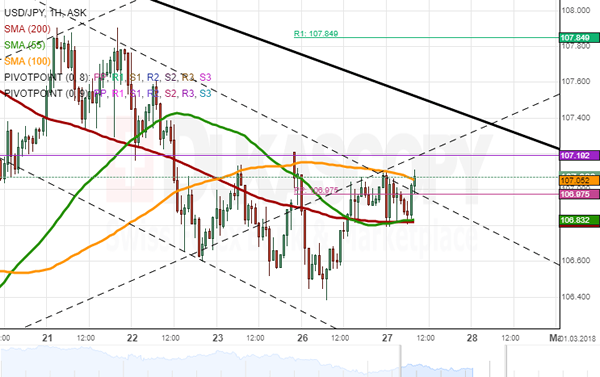
Weaker US Dollar put downward pressure on USD/JPY early on Monday, thus allowing the pair to plunge down to the 106.50 mark. The subsequent hours saw a slight recovery up to 117.00.
The rate's movement since mid-yesterday has been bounded between the 55-, 100– and 200-hour SMAs. It is likely that the direction of the breakout determines the US Dollar's movement during the following 24 hours.
Technical indicators are more supportive of the bearish scenario that should send the rate towards the weekly S1 at 106.00—a move that would likewise confirm the upper boundary of a short-term channel down.
On the other hand, a northern breakout of the 100-hour SMA and the weekly PP circa 107.00 is expected to result in a surge up to the 107.50 mark.
What To Expect From Powell’s First Major Speech
Jerome Powell is the new Fed chair replacing Janet Yellen after her term expired this month and without doubt market watchers are eagerly waiting to hear whether his views on the economy support the pre-existing monetary policy script. Therefore, Tuesday will see investors turning their ears to Powell's first major speech in front of the House Financial Services Committee, while on Thursday the new Fed boss will testify before the Senate Banking Committee.
Before Powell sits on the Fed chair, a surprising rise in wage growth last month triggered the stock-market melt-down as investors speculated that inflation would pick up sooner than expected and thus the Fed would start increasing interest rates faster than previously thought. Consequently, the 10-year US Treasury yields surged to four-year highs, but the dollar index oddly took a knock falling to three-month lows against a basket of major currencies, a phenomenon probably attributed to renewed worries over the twin deficits in the US following the approval of a two-year government spending plan and Trump's recent tax reforms aiming to deliver massive tax cuts to businesses. Now, the ball is in Powell's hands and markets want to confirm that his views on inflation and interest rates are in line with those of Yellen's as he has been so far seen as mister continuity, while most importantly they are curious to see how he will manage to express himself without causing any market turbulence.
Indeed, Powell, testifying on behalf of the FOMC committee before the Congress at 1500 GMT (prepared statement delivered at 1330 GMT) has no reason to hold a dovish stance as recent Fed remarks have sent clear hawkish messages. January's FOMC meeting minutes released on Wednesday revealed that the majority of the board members were sanguine that inflation, currently standing at 1.5% y/y, would gain steam this year and rise towards the Fed's 2.0% only in the medium-term. Besides that, policymakers decided to upgrade their economic projections made in December acknowledging that the country's positive economic performance, accommodative financial conditions and Trump's tax cuts, which are already in the pipeline, would unleash further growth. However, they judged that any rate hikes should come at a gradual pace in order to support a healthy expansion. Yet, the confidence vibes found in the minutes reinforced speculations that rates could pick up more than the three times the Fed currently predicts.
In case Powell holds a hawkish tone, potentially hinting that the Fed might use a more aggressive path to tighten monetary policy, traders might put more weight on his words than normal, setting off another round of stock market selloffs. Powell is not a stranger in the industry but he is new in the role and markets are expected to react more sensitively until they become more accustomed to his language patterns and way of thinking. Particularly, stock investors see the next pain threshold at 3.0% in terms of bond yields given that any break above this level would make equities less attractive compared to fixed income assets. In the previous week, the US 10-year Treasury yields topped at a four-year high of 2.95 in the wake of the Fed meeting minutes.
Hence, the new Fed chair is more or less anticipated to back statements expressed in January's FOMC meeting, highlighting the bullish outlook of the economy but since he would also like to keep financial markets calm, he will probably avoid indicating how fast should interest rates rise.
Turning to forex markets, encouraging remarks arising from Powell's speech could drive dollar/yen could back above to the previous high of 107.90, while if his comments really please investors, the pair could touch the 108 and 109 psychological marks.
On the other hand, a disappointing speech could pressure the pair towards the 106 handle, whilst in the worst scenario, dollar/yen could breach the previous low at 105.52 diving to fresh three-month lows, likely near the 104 key-area.
Sky Received Another Offer | European Markets And US Futures Higher | Cryptos In Green
Bull rally may not derail that easily
Fed chairman’s testimony could shock the financial markets
US core durable good number may drop to 0.4%
A green start to the week for the cryptocurrency markets
Investors have started to bet once again that the Fed’s monetary policy stance may not be that hawkish and perhaps the bull rally may not derail that easily. The S&P500 index has recovered most of its losses which occurred a few weeks ago and the Japanese markets have climbed to their best level which is not seen in more than three weeks. Looking at the daily chart of the S&P500 index from a technical perspective, the reverse head and shoulder pattern clearly stands out. The projection of this pattern, if fully played out, could easily push the price to another all-time high.
Nonetheless, how aggressive the pace of the monetary policy would be over in the US would remain a chief debate amidst investors. The new Fed chairman’s testimony has the potential to shock the financial markets as investors are not expecting any hawkish stance from him. Mr Powell, the new Fed Chairman, would have to stick to the script and he needs to assure the market that the path for the interest rate hikes would be a gradual one.
For currency traders, traders are wary of placing any large bets ahead of the new Fed Chairman’s testimony and the upcoming US NFP data. The US core durable good number is expected to show a drop to 0.4% from the previous number of 0.7%. Any increase in the purchase orders in this data would send the signal that manufacturers are less wary off interest rate hikes and the business sentiment is strong. We also have the consumer confidence data due later which could bring some swings in the dollar index. The forecast is an improvement in the consumer confidence from its previous reading of 125.4, the forecast is for 126.2.
As for the Euro, the chances are that we may get a break to the upside and provided that the new Fed Chairman does not ruffle any feather, the central bankers' speciality. Yesterday’s dovish comments by the ECB’s president pushed the euro lower against the dollar, catching out a few overeager bulls. However, at the same time, the president also ruled out any currency war with the US on F.X policy, this leaves the door open for the euro bulls. A strong German CPI number would mean that the ECB would face more pressure from Bundesbank to wind down the tents of easy money sooner than later.
Gold
The precious metal is struggling to hold on to gains despite the weaker dollar. Overall, it does appear that the traders have a bullish bias towards the shinning metal and looking at the overall bets, it appears that traders are planning for an upside move ahead of the Fed chairman’s testimony. Inflation qualms would continue to support the metal as traders use the yellow metal to hedge their risk against inflation.
Cryptocurrency
A green start to the week for the cryptocurrency markets, partly fuelled by Turkey’s proposition of introducing its own national cryptocurrency. Perhaps talks from the European Commission on how to regulate cryptos will provide headwinds to this bullish momentum. However, it generally seems that crypto traders have grown wiser when it comes to filtering what they read about this new asset class in the news.
SKY Gets Another Bid
Sky PLC, a pay television broadcasting service, received another bid but this time not from Rupert Murdoch’s company. Comcast Corp decided that they see a value play in acquiring Sky and the company jumped into the fray by challenging 21st Fox Inc and Walt Disney’s offer. The cash offer of 12.50 pounds per share from Comcast has set the bar really high for Fox.
Forex Technical Analysis: EUR/USD, USD/JPY, GBP/USD
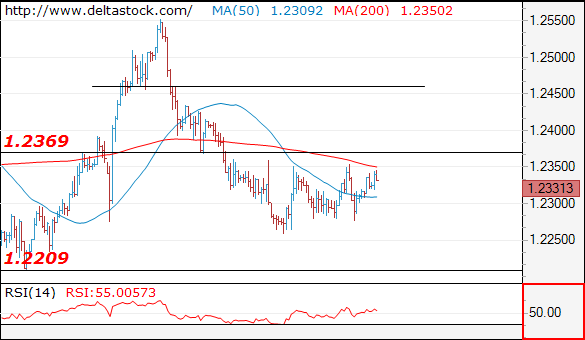
EUR/USD
Current level - 1.2331
The resistance at 1.2370 is still intact and the bias is neutral within the 1.2260 - 2370 range. The intraday outlook is neutral.
| Resistance | Support | ||
| intraday | intraweek | intraday | intraweek |
| 1.2370 | 1.2460 | 1.2260 | 1.2210 |
| 1.2460 | 1.2560 | 1.2210 | 1.2090 |
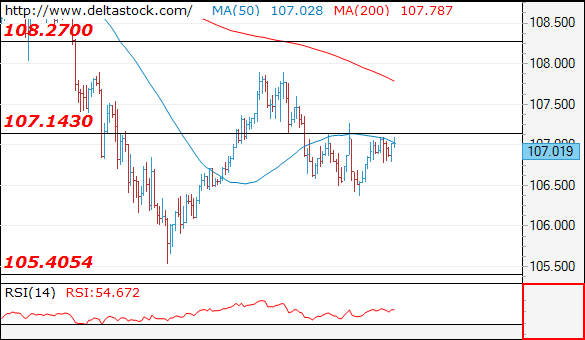
USD/JPY
Current level - 107.01
The overall bias remains negative below 107.20, but an eventual break through that area will challenge again 107.90 highs.
| Resistance | Support | ||
| intraday | intraweek | intraday | intraweek |
| 107.20 | 108.30 | 106.40 | 105.40 |
| 107.90 | 110.40 | 105.40 | 102.40 |
GBP/USD
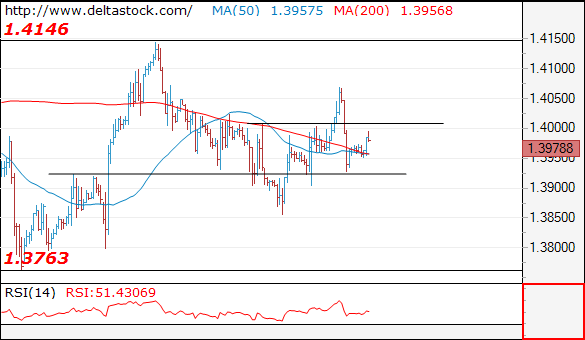
Current level - 1.3978
The dip below 1.4000 signals a reversal at 1.4060 and the bias is bearish below 1.4000, with a risk of further depreciation towards 1.3850. Trigger on the downside is 1.3950.
| Resistance | Support | ||
| intraday | intraweek | intraday | intraweek |
| 1.4060 | 1.4280 | 1.3950 | 1.3760 |
| 1.4150 | 1.4340 | 1.3850 | 1.3620 |