Sample Category Title
GBPUSD Still Struggling With 1.4000 Level
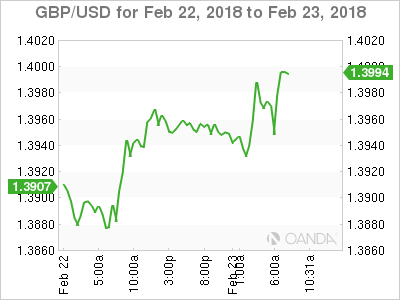
The British pound has quickly given back intraday gains against the U.S dollar, as buyers again failed to move price-action above the key 1.4000 level this morning. Sterling earlier traded as high as 1.3994, before strong technical selling saw the pair dropping sharply to the 1.3904 technical level. Price-action now trades back above the pivotal 1.3938 level, with Brexit news and the U.S dollar index now driving the current trading sentiment surrounding the GBPUSD pair.
The GBPUSD pair only retains an intraday bullish bias whilst trading above the 1.3938 level, key intraday resistance is now found at the 1.3994 and 1.4008 levels.
Should GBPUSD price-action hold below the 1.3938 level on a higher-time frame basis, a further decline towards the 1.3901 and 1.3873 levels seems likely.
EURUSD Back Testing Key Support at 1.2292
The euro is losing bullish momentum against the greenback after earlier rallying to the 1.2351 level, as the U.S dollar index starts to move higher again. The EURUSD pair is currently trading back towards the key 1.2292 technical level, with sellers regaining control from the 1.2321 level during the European trading session. The U.S dollar index and volatile moves in the U.S treasury market remain the main drivers of EURUSD price-action on Friday.
The EURUSD pair remains under bearish pressures while trading below the 1.2292 technical level, further losses towards the 1.2259 and 1.2232 levels appear likely.
Should EURUSD price-action move back above the 1.2292 level, key intraday resistance is found at the 1.2310 and 1.2351 levels.
Fed Rhetoric to Dictate Dollar Direction
Friday February 23: Five things the markets are talking about
Ahead of the U.S open, Euro equities are struggling for direction after a positive Asian session as the market debates the outlook for central banks 'normalizing' their policies.
Euro bonds have gained along with Treasuries, while the dollar steadies after yesterday's drop.
With no U.S data on the docket today, the market will shift its attention towards a plethora of Fed speakers doing the rounds.
First up will be New York Fed Chief, William Dudley, who kicks off proceedings at 10:00 am EDT as he addresses the "Monetary Policy Forum" in Chicago.
Note: Dudley is making his final rounds of appearances before his retirement.
Appearing at the same conference shall be Boston Fed President Rosengren, who is one of the Fed's more "dovish" members, but who is not a "voter" this year.
Ms. Mester, the President of the Cleveland Fed, will be speaking at the same conference this afternoon at 1:00 PM EDT. She is a "voter" this year and a "hawk."
Finally, Mr. Williams, the President of the San Francisco Fed, a "voter" on the FOMC this year and generally considered a "moderate," will be speaking to a group on the west coast on the economy and monetary policy at 03:40 pm EDT.
1. Stocks gain in thin trading
In Japan, stocks rallied in light trade as receding fears of more aggressive U.S interest rate hikes boosted sentiment. The benchmark Nikkei ended +0.7% higher. For the week, it was up +0.8%.The broader Topix gained +0.8%.
Down-under, Australia's S&P/ASX 200 closed +0.8% higher to cap its best week since Oct. In S. Korea, the Kospi had its best day since Oct. 10 rising +1.5%.
In Hong Kong, stocks rose overnight, capping a holiday-shortened trading week, as main indexes managed to recover much of the damage done during the recent rout. The Hang Seng index rose +1.0%, while the China Enterprises Index gained +1.7%.
In China, shares extended their rebound overnight, on sign's that the Chinese government is once again supporting the stock market. The blue-chip CSI300 index ended up +0.5%, while the Shanghai Composite Index gained +0.6% in a holiday-shortened week. Both indexes have rebounded over +7% from a low print on Feb. 9.
Note: One of China's largest insurance companies, Anbang Insurance Group, was seized as it violated laws and regulations that could seriously endanger the solvency of the company.
In Europe, regional indices trade mixed this morning with strength in the Italian MIB offset by weakness in the Spanish Ibex and FTSE.
U.S stocks are set to open in the 'black' (+0.3%).
Indices: Stoxx600 flat at 380.4, FTSE -0.2% at 7238, DAX +0.1% at 12470, CAC-40 flat at 5310, IBEX-35 -0.2% at 9858, FTSE MIB +0.4% at 22541, SMI -0.6% at 8917, S&P 500 Futures +0.3%
2. Crude oil prices rally, gold little changed
Crude oil prices remain better bid and range bound following the release of this week's EIA inventory report, which showed a somewhat surprising decline in crude oil inventories on the order of -2.3m barrels compared to the average increase of +3.4m barrels in the previous five-years.
U.S oil production last week was steady at +10.27m bpd, a record level, while crude exports jumped to more than +2m bpd, close to a record +2.1m hit in October.
Crude bulls are beginning to ask if the "bull" rally could fade away as the U.S. oil production undermines the OPEC production cut commitments.
Note: The decline in crude inventories was particularly acute in Cushing. U.S oil refineries averaged approximately +15.8m bpd during the week ending February 16 or about -330k fewer bpd than last week previous.
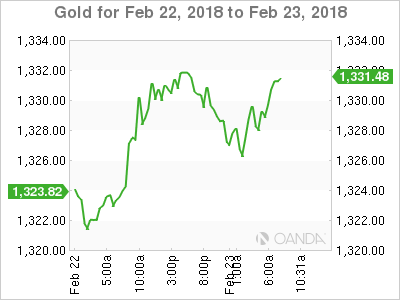
Ahead of the U.S open, gold prices are little changed, but the 'yellow metal' remains on track for its sharpest weekly drop in nearly three-months. Spot gold is down -0.1% at +$1,329.16 an ounce.
Note: Prices gained +0.6% Thursday, their biggest one-day percentage rise since Feb. 14. The precious metal remains on track for its biggest weekly fall since the week ended Dec. 8, 2017.
3. Sovereign yields fall
Capital markets remains somewhat sceptical that the recent streak of data on wage growth, consumer prices and producer prices points to a rapid acceleration in inflation on either side of the Atlantic.
Data this morning from the Eurozone showed that consumer price growth slowed slightly last month (see below), but the core-measure edged a tad higher for the first time in months.
The ten-year U.S yield has eased, but remains atop of their 2014 high print, while those on German bunds dropped to the lowest since early January.
The yield on 10-year Treasuries decreased -2 bps to +2.90%. In Germany, the 10-year Bund yield has fallen -2 bps to +0.70%, the lowest in four weeks. In the U.K, the 10-year Gilt yield has declined -2 bps to +1.546%. In Japan, 10-year JGB's yield has dipped less than -1 bps to +0.05%, the lowest in more than seven-weeks.
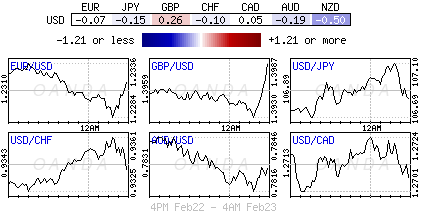
4. Dollar on the back foot
The U.S dollar is modestly weaker as the market is apparently ready to accept as a given that the Fed shall move at least three times this year to tighten monetary policy and to raise the overnight fed funds rate. The only question is whether the Fed shall move for a fourth time and by how much?
For the 'single' unit, it's not only next weekend's Italian general election (Mar 4) that poses a risk to the EUR (€1.2313), but also Sunday week is the same date that Germany's SPD party members will vote on the proposed CDU/SPD coalition. The market is currently pricing in a +40-50% chance of a rejection, a result that could see Chancellor Angela Merkel step down.
Elsewhere, the pound (£1.3950) has edged a tad higher after U.K's PM Theresa May won the backing of her divided Brexit "war cabinet" to ask for an ambitious trade deal with the E.U.
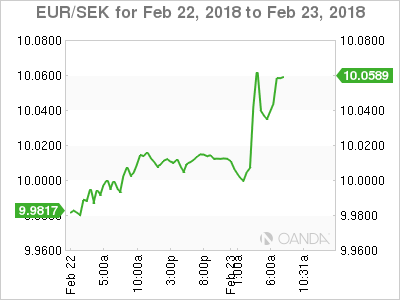
The SEK (€10.0388) is a tad softer outright as the market felt that the Riksbank Feb minutes this morning were on the softer side with concerns lingering over inflation and the exchange rate given the recent negative surprise with Jan CPI data.
5. Eurozone Jan CPI unrevised, but still a distance from target
Eurostat said consumer prices in the 19 countries sharing the 'single unit' fell -0.9% m/m in January for a +1.3% y/y increase.
Ex-food and energy, or core-inflation, fell -1.3% m/m and rallied +1.2% y/y, accelerating from +1.1% in the previous three months.
An even broader measure of core inflation, which in addition excludes alcohol and tobacco prices, also increased to +1.0% y/y in January from +0.9% in the previous three-months.
Canadian Dollar Unchanged Ahead Of CPI
The Canadian dollar is drifting in the Friday session. Currently, USD/CAD is trading at 1.2707, up 0.01% on the day. On the release front, Canada will release a host of CPI indicators, led by CPI. This key indicator is expected to rebound with a gain of 0.4% in January. In December, CPI declined 0.4%, its first decline in six months. In the US, there are no data releases, but we'll hear from three FOMC members – William Dudley, Loretta Mester and John Williams.
Canadian retail sales reports, released on Thursday, were dismal in December. Core Retail Sales plunged 1.8%, well of the estimate of +0.1%. This marked the sharpest decline since January 2015. It was a similar story with Retail Sales, which fell 0.8%, missing the estimate of 0.0%. This was the indicator's worst showing since March 2016. The soft readings pushed USD/CAD as high as 1.2754 on Thursday, its highest level since late December. The Canadian dollar has dropped 1.2% this week, and if CPI also misses expectations, the slide could continue.
Investors remain wary after the recent stock market turbulence, which wiped off some $4 trillion in valuations. A key factor in the sharp correction was investor concern that higher inflation in the US would trigger more interest rate hikes. This has led to close monitoring of any releases connected to the Federal Reserve, and led to high anticipation ahead of the release of the January minutes on Wednesday. There were no major revelations in the minutes, and policymakers did not discuss a quicker pace of rate hikes. Still, policymakers hinted that further rate hikes could be in the cards, due to strong economic conditions in the US. In the words of the minutes, policymakers “anticipated that the rate of economic growth in 2018 would exceed their estimates of its sustainable longer-run pace and that labor market conditions would strengthen further”. At the December meeting, the Fed penciled in three rate hikes in 2018, but there is growing sentiment in the markets that the Fed may have to raise rates four or even five times this year. As for inflation, the minutes did not reveal any concern, with most Fed members were of the opinion that inflation would rise towards the Fed target of 2 percent.
EURCAD Trades Around 2-Year High, Bullish Bias But Possibility Of Overstretched Rally
EURCAD has advanced considerably since roughly the beginning of the year, hitting a two-year high of 1.5687 during Thursday's trading. Price action is at the moment taking place not far below this peak.
The Tenkan-sen line being above the Kijun-sen one is pointing to a bullish short-term momentum. However, the Chikou Span suggests that the recent rally might be overextended, rendering a pullback in the near-term a possibility.
Price advances could meet resistance around yesterday's high of 1.5687 – including the 1.57 handle that may be of psychological importance – with stronger bullish movement turning the attention to the 1.58 level that could also hold psychological significance.
On the downside, the area around the current level of the Tenkan-sen at 1.5569 might offer support, with a violation of this area increasingly bringing the Kijun-sen at 1.5433 into focus.
The medium-term picture is positive: price action is taking place above both the 50- and 100-day moving averages, as well as the Ichimoku cloud. In addition, both MA lines maintain a positive slope.
Overall, both the short- and medium-term outlooks are looking bullish, with the possibility of an overstretched market in the short-term being in place.
Technical Outlook: WTI OIL Is Consolidating After Strong Rally, Rising Daily Cloud Continues To Underpin
WTI oil price is consolidating under fresh over two-week high at $63.07, posted on Thursday when oil prices surged on positive US crude inventories data.
EIA weekly report showed unexpected fall in US crude inventories against forecasted build which sparked strong rally.
Oil price accelerated above daily cloud and exceeded previous high at $62.63, on rally to $63.07 peak, generating strong bullish signal on close in long bullish daily candle.
Current consolidation is a result of profit-taking as well as traders digesting positive data which turned near-term bias bullish and sidelining fears of rising US output.
Structure of daily techs improved as oil price is gaining momentum, but daily MA’s are still in mixed mode.
WTI contract is on track for the second weekly bullish close which adds to positive near-term outlook.
Break above 30SMA which capped Thursday’s rally (currently at $63.05) and pivotal $63.36 barrier (Fibo 61.8% of $66.64/$58.06 downleg) is needed to generate stronger signal for bullish continuation.
Consolidation was so far contained by falling 20SMA ($62.30) with extended downticks expected to remain above the top of rising daily cloud ($61.90) to keep bullish bias intact.
Res: 63.05, 63.36, 64.27, 64.62
Sup: 62.30, 61.90, 61.52, 61.22
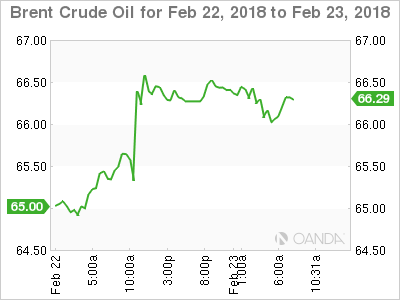
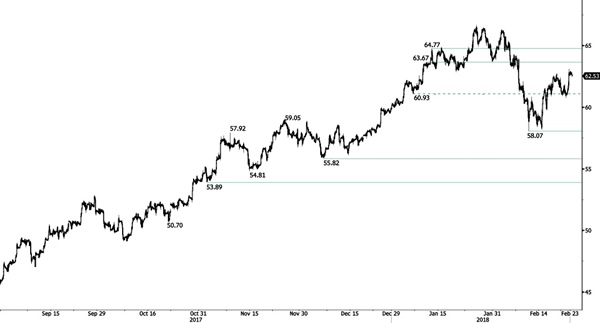
CRUDE OIL Buying Pressures Resume
Crude oil upward trend resumes, curerntly trading above 62.50 and approaching hourly resistance found at 63.67 (10/01/2018 high). Crude oil hourly support remains at 58.07 (09/02/2018 low). The technical structure suggests short-term upside moves.
In the long-term, crude oil has recovered after its sharp decline last year. However, we consider that further weakness is very likely. For the time being, the pair lies in an upside trend since June 2017. Support lies at 42.20 (16/11/2016) while resistance is located at 77.83 (20/11/2014). Crude oil is trading largely above its 200 DMA.
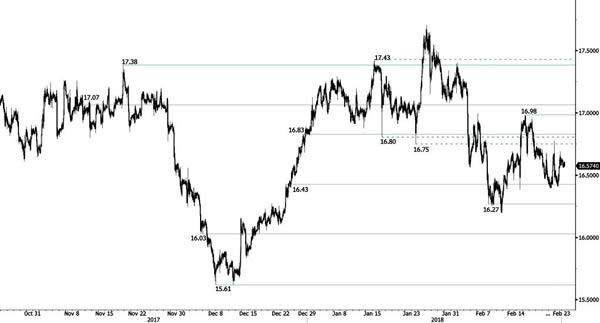
SILVER Upward Consolidation
Silver is maintained at the range of 16.55 and trades indistinctly. Silver is trading between hourly support and resistance given at 16.27 (07/02/2018 low) and 16.98 (15/02/2018 high). The technical structure suggests further shortterm sideway moves.
In the long-term, the trend remains negative/ sideways. Further downside is very likely. The pair is trading below its 200 DMA. Resistance is located at 21.58 (10/07/2014 high). Strong support can be found at 11.75 (20/04/2009).
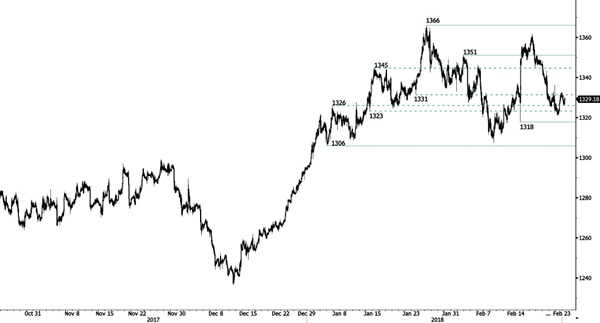
GOLD Testing 1330
Gold is trading higher, nearing the range of 1330, though a short-term bearish pattern dominates. Hourly support and resistance are given at 1306 (04/01/2018 low) and 1366 (25/01/2018 high). The technical structure suggests further downside moves.
In the long-term, the technical structure suggests that there is a growing upside momentum. A break of 1'392 (17/03/2014) is required to confirm it. A major support can be found at 1'045 (05/02/2010 low).
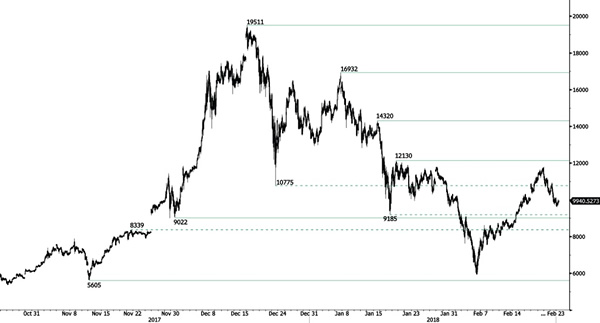
BITCOIN Sideways Price Action Maintained At 10000
Bitcoin upward trend stops following slight decrease above 10000. Expected to continue consolidation above the 10000 range. Hourly support remains at 9022 (30/11/2017 low) while resistance is given at 12130 (18/01/2018 high).
In the long-term, the digital currency has had an exponential growth but also presented important downturns. There is decent likelihood that the currency could stabilize between 7'000 - 12'000 in 2018. Bitcoin is trading above its 200 DMA (6'500 range).