
Sample Category Title
Technical Outlook: AUDUSD – Bears Show Hesitation Ahead Of Key Supports
The pair entered consolidation phase on Thursday, following strong fall the previous day, after Fed minutes inflated the greenback.
Near-term action is moving within daily cloud, which was penetrated on Wednesday's strong bearish acceleration.
Break through cloud top and close in the cloud was bearish signal, reinforcing negative outlook on bearish setup of daily techs for further extension of bear-leg from 0.7988 (16 Feb high) towards key supports, converged 100/200SMA's (0.7773), 09 Feb low (0.7758) and Fibo 61.8% of 0.7500/0.8135 ascend (0.7742).
Bears may show stronger hesitation on approach to these supports which could result in slowing bearish momentum and stronger corrective upticks.
Broken cloud top, reinforced by 55SMA marks initial resistance at 0.7839, with extended rallies to be capped by 10SMA (0.7872) to keep bears intact for fresh attempts lower.
Res: 0.7839, 0.7872, 0.7900, 0.7920
Sup: 0.7790, 0.7773, 0.7758, 0.7742
Elliott Wave Analysis: USDCAD And BTCUSD Update
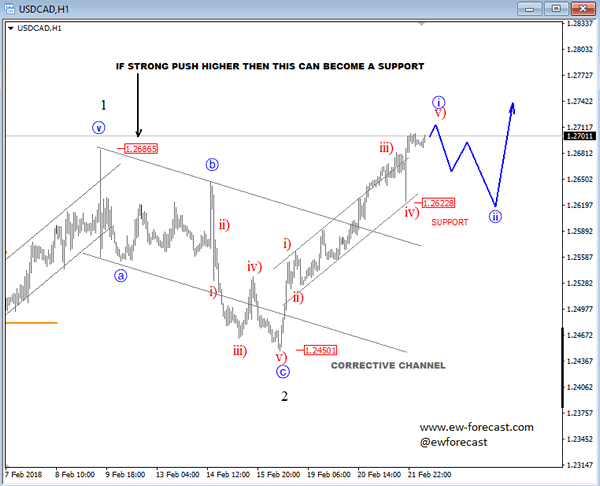
USDCAD bounced perfectly yesterday from that channel support where wave four bottomed so we see pair now in wave five testing that old swing high at 1.2686. If there will be a decisive break through this level with a daily close above it then this old high can become a new support later. If break would be unsuccessful in the next 12 hours then support to keep an eye on for a pullback is at 1.2622.
USDCAD, 1H
BTCUSD is turning south, now falling below the trendline support so we assume that new a-b-c pullback is in play, ideally for 9k.
BTCUSD, 2H
EUR/USD: US Existing Home Sales
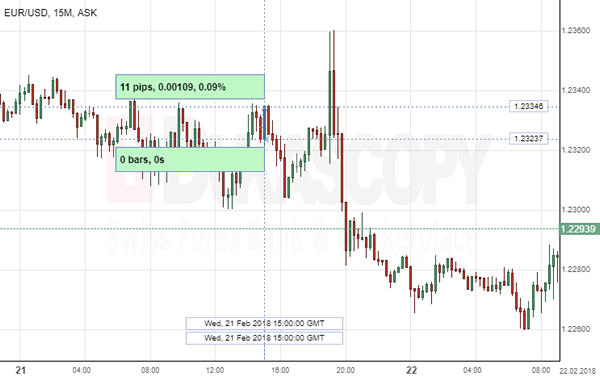
The Greenback weakened versus the Euro following the release of US existing home sales report. The EUR/USD pair increased 11 base points, or 0.09%, to hit the 1.2334 level, reflecting the decline in the resales of American homes.
The US National Association of Realtors reported that in January the existing home sales slumped for the second month in a row. Contrary to economists' expectations for the number to have surged 0.9%, existing home sales declined 3.2% in the reported month. It was the largest drop on year-to-year basis over the three-year period. Yet, the demand for housing is increasing due to the boosting labor market, which results as a shortage of buying opportunities for some potential first-time buyers.
GBP/NZD 4H Chart: Set For A Breakout
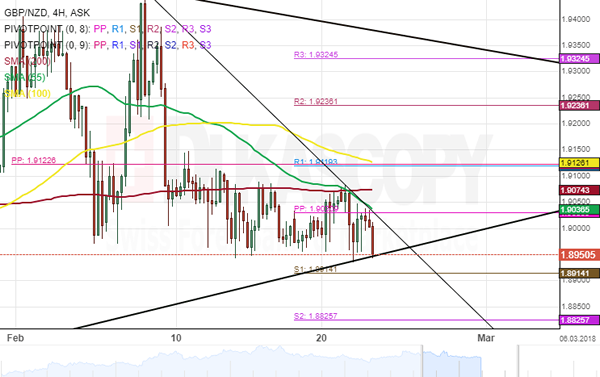
The Pound Sterling has continued to surge against the New Zealand Dollar since the last time the pair was reviewed. However, there has been some negative development during this period.
The currency pair has been trading in a large-scale triangle after it hit the lower boundary on January 11. Also, the exchange rate has formed a new junior channel during this period.
Given that the GBP/NZD pair is currently trading sideways, traders should expect a breakout in either direction in near future. In addition, technical indicators favour a breakout south.
GBP/CAD 4H Chart: Meets Resistance
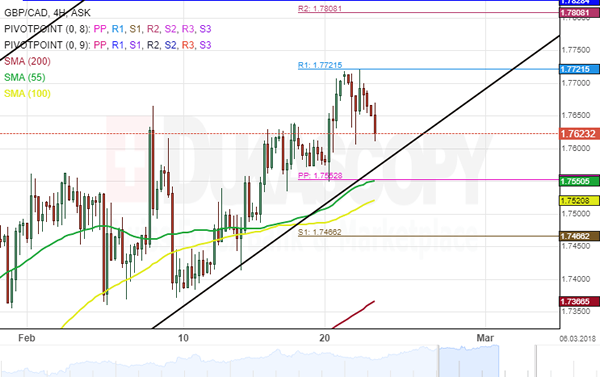
Sterling has been guided by an ascending channel against its Canadian counterpart since late September 2017. The pair bounced off the lower boundary of a dominant channel on September 11 and has since rallied against the Loonie.
The currency pair has moved closer to the border of a medium-term pattern and could be set for a breakout. From a theoretical point of view, a retracement south is likely. However, this retracement could find a support cluster set by the weekly PP and the 55– hour SMA near 1.7550.
Technical indicators suggest that the exchange rate is likely to continue its bullish movement in the nearest future.
EURUSD Analysis: Breaches Senior Channel
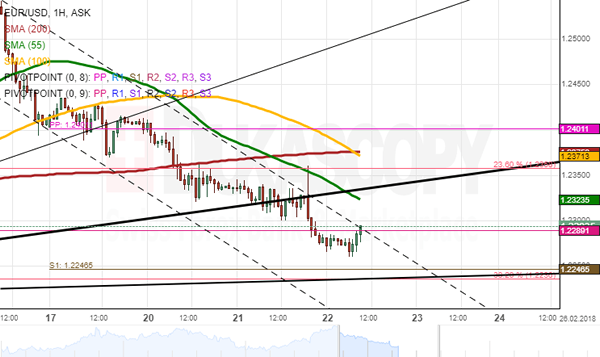
The Euro was trading with low volatility during the first part of Wednesday. Higher volatility was introduced later in the evening when the FOMC released its meeting minutes.
The Fed praised the strength of economic growth, while expressing concerns over missed inflation targets. This statement resulted in an immediate upward pressure on the pair, which was soon overrun by the stronger Greenback. As a result, the session ended with a 56 pip decline in price.
Given that the prevailing senior channel was breach mid-session, traders might see a decline in the medium term. However, in terms of the following session, the Euro is expected to bounce off the junior channel and the weekly S1 at 1.2240 to begin a brief period of recovery. Upside target for today—the 1.2350/1.2400 area.
GBPUSD Analysis: Tended South
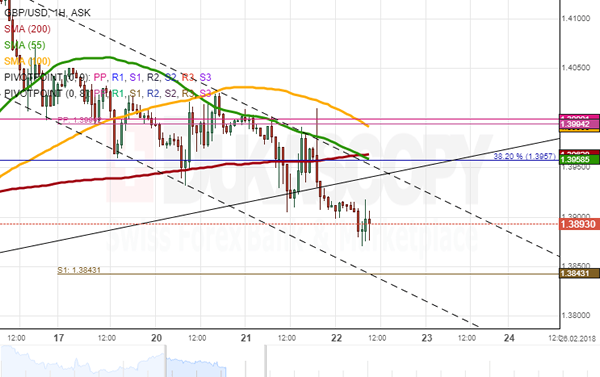
The resistance cluster which limited a move above the 1.40 mark provided a strong barrier for the Pound on Wednesday. Thus, bears took over the market. As already expected, the pair breached the two-week channel down circa 1.3825 later in the evening and has since been moving lower in line with the junior pattern.
Daily technical indicators favour a continuous fall within the following trading sessions; thus, it is likely that the Sterling targets the bottom boundary of the senior channel near 1.3750.
In terms of today, the pair is expected to remain between the weekly S1 and the combined resistance of the 55– and 200-hour SMAs and the 38.20% Fibo retracement in the 1.3840/1.3960 area. A retracement from the breached channel is the most likely scenario.
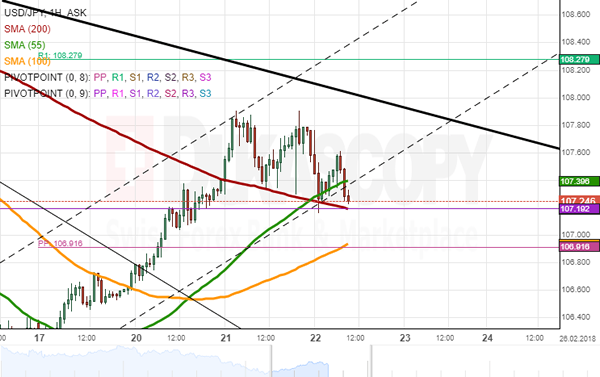
USDJPY Analysis: Supported By 200-Hour SMA
Despite several attempts to edge lower on Wednesday, the movement of the US Dollar was guided by the 200-hour SMA. As apparent on the chart, the pair has still not reached the upper boundary of a two-month channel down. This is expected to occur today.
A possible test of this line is also supported by the fact that the nearest southern barrier is provided by the 200– and 55-hour SMAs and the monthly S1 which are restricting the pair's movement below the 107.20 mark. This might put upward pressure on the rate just to allow for a test of the senior channel.
Technical indicators are in favour of subsequent bearish pressure that should dominate the market today. Thus, the test of 108.00 could be followed by a decline in price. This, in turn, might mark the beginning of a new wave down during next week.
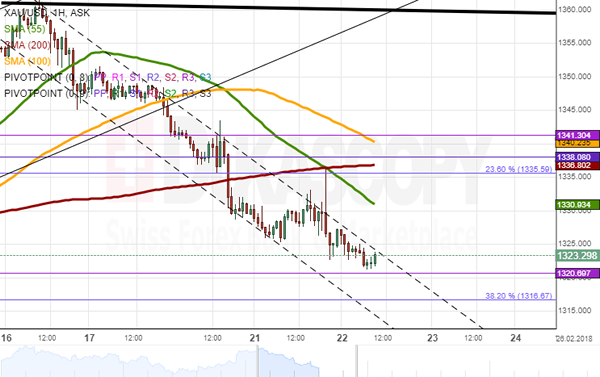
Gold Analysis: Remains In Junior Pattern
After breaching the 200-hour SMA late on Tuesday, the yellow metal has since been moving lower. Wednesday's trading session, however, did not introduce significant changes, as the pair closed the day with a limited 0.35% decline. The FOMC meeting minutes introduced some upward volatility which was still more favourable for the US Dollar.
As apparent on the chart, the narrow junior channel has managed to confine the rate for the third consecutive session. A breakout is expected to occur today. Gold might still slide lower down to the weekly S1 or the 38.20% Fibo at 1,320.70 and 1,316.70, respectively.
However, the overall direction should nevertheless be north with gains being capped near the 55– and 200-hour SMAs, the monthly PP and the 23.60% Fibo in the 1,332.00/1,338.00 territory.
ECB Minutes, FOMC’s Colour Matter
The Fed is surely confident about the US economy
Momentum is weak for the euro bulls
Pullback in the equity market may encourage investors to park their funds in safe-haven
The European markets and US futures are under the influence of the change in the monetary policy stance by the Fed. Having said that, the yield on the 10-year treasury bonds have retraced from it’s high.
Forex
The Fed is surely confident about the economy, does not matter if the stock market feels that way especially if we see the traders reaction to the FOMC minutes. The word “further” in the FOMC minutes added fuel to the fire. To a greater extent , the minutes gave an acute signal that the Fed is open to debate that there could be 4 interest rate hikes this year. The markets are pricing this reaction now and this has pushed the dollar index above the 90 mark. The FOMC meeting minutes are suggesting an upward revision in US economic projections provide a further green light for traders to long the dollar.
The officials were more positive in their economic outlook and optimistic that they can achieve their inflation target. Positive US economic data, including a 0.5% monthly gain in CPI and a 2.9% increase in average hourly wages for January, anchored investors’ expectations for aggressive interest rate hikes this year. Increased Fed hawkishness is perhaps enough to say goodbye to the dollar sell-off fuelled by speculation that the Trump Administration would pursue a weak-dollar strategy.
The German IFO provided further hints about the momentum in the German economy. The momentum is weak for the euro bulls, traders are going to focus on the ECB’s minutes and their debate on capping asset purchase. This would be in the limelight. The doves have a little or no excuse to delay the talks around the change in the forward guidance stance. The bank may not be revealing what is going on behind the closed doors, but one can guess that the ECB must have had a debate about changing the forward guidance
The Euro plummets down to 1.2265 against the greenback, but this is more to do with a firmer USD rather than changing Euro fundamentals, so we could see a slight pullback may continue as the dollar remains firm. Elsewhere, despite English policymakers striking a hawkish tone on inflation, the Sterling bulls are going to keep the upcoming limelight on the second estimate GDP q/q reading. The number is improving as we have come a long way from 0.2% which was the reading in May last year. Given that the EU has said that the timeline for the transition period for the UK leaving the EU is on track, boosts some confidence amidst traders. However, the stronger dollar and poor GBP employment figures, causing the Cable to retest the 1.38 region.
Gold
The Fed is hawkish and the dollar index has crossed above the 90 mark, these are enough reasons for the bears to draw their boundary. The weakness in the gold price is prominent, however, there is no major panic especially when the metal is still holding on to gains if you look at its performance from YTD perspective. A soaring dollar is the main reason for investors to scale back on Gold, however, the pullback in the equity market may encourage investors to park their funds in safe-haven- gold. Imminent geopolitical tensions remain a major concern for Gold shorts, so the dip may provide an ideal buying opportunity for traders wanting to get a piece of the yellow metal.
Oil
Oil traders had a little to no chance to react to the dropping crude oil inventories, a similar message which was echoed in the API date too. However, pressure from Saudi Arabia to push Oil prices higher ahead of the Aramco IPO may give an indication that there is still upside potential for the commodity.The 50 day moving average is serving an interesting purpose because the last time the price crossed this was back in September 2017 and since then we had a massive rally. I think the support of 58, which is also where the 100 day moving average is an important point and there is a possibility that we could touch mark.