Sample Category Title
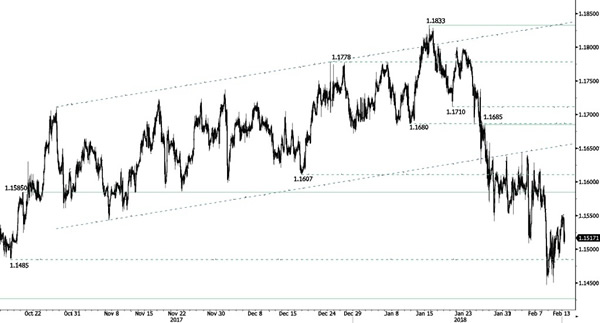
EUR/CHF Bearish Breakout
EUR/CHF continues its decline heading toward 1.15. Hourly resistance is found at 1.15850 (19/10/2017 high) while strong resistance at 1.1833 (15/01/2018 high) remains. Hourly supports are given at 1.14269 (04/10/2017 low) and 1.1388 (02/10 2017 low).
In the longer term, the technical structure has reversed. Strong resistance is given at 1.20 (level before the unpeg). Yet, the ECB's slowing QE program is likely to cause buying pressures on the euro, which should weigh in favour of the EUR/CHF. Support can be found at 1.0234 (20/04/2015 low).
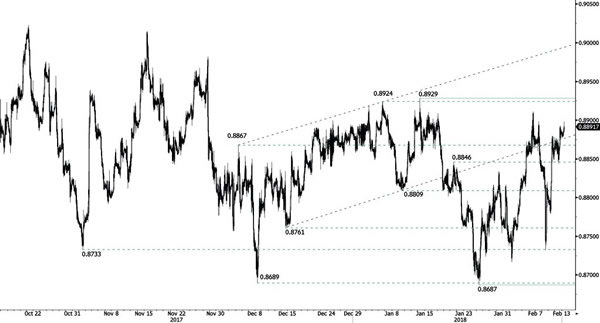
EUR/GBP Retracement Maintained
EUR/GBP is trading higher and approaches resistance at 0.8929 (12/01/2018 high). Hourly support remains at 0.8687 (25/01/2018). The technical structure suggests further short-term upside move.
In the long-term, the pair has largely recovered from 2015 lows. The technical structure suggests further upside pressure. The pair is trading above the range of its 200 DMA. Strong resistance can be found at 0.9500 (psychological level) while support remains at 0.8304 (05/12/2016 low).
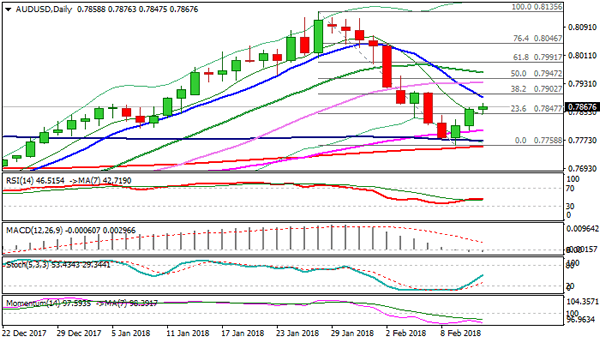
Technical Outlook: AUDUSD – Extended Recovery Faces Strong Resistances At 0.7890/0.7910 Zone
The Australian dollar extends bounce from 0.7758 low (09 Feb) where steep descend from 0.8135 faced strong headwinds from supports provided by 200SMA and rising daily cloud. Recovery extends into third day but shows signs of losing traction ahead of strong barriers at 0.7892 (falling 10SMA) and 0.7902 (Fibo 38.2% of 0.8135/0.7758 fall). Fundamentals are supportive for AUD, following release of stronger than expected Australian business confidence (12 in Jan vs 10 f/c and 11 previous month). On the other side, techs are mixed, slow stochastic heads north on daily chart, RSI turned sideways and holding under neutrality zone, while bearish momentum is building. Bulls need sustained break above pivotal 0.7890/0.7910 resistance zone to generate fresh bullish signal for recovery extension towards 0.7963 (20SMA) and psychological 0.80 barrier (also near Fibo 61.8% of 0.8135/0.7758 descend. Conversely, the downside is expected to remain vulnerable while the price holds below plethora of resistances between 0.7890 and 0.7910. Rising 55SMA marks initial pivotal support at 0.7802, loss of which would re-expose 200SMA.
Res: 0.7892, 0.7902, 0.7910, 0.7935
Sup: 0.7847, 0.7802, 0.7771, 0.7754
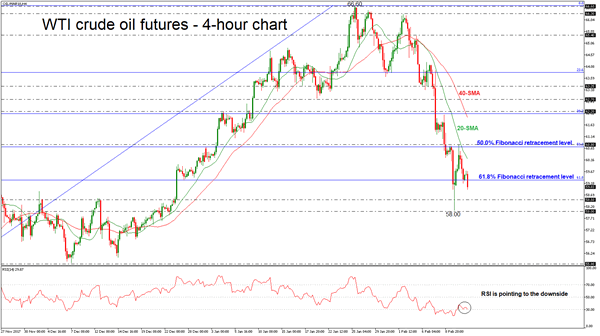
WTI Crude Oil Futures Tumble In Short-Term Extending Its Losses Below 61.8% Fibonacci Mark
WTI crude oil futures are continuing the bearish movement following the strong pullback from the 60.80 resistance level during Monday’s session. Prices have been touching the 61.8% Fibonacci retracement level at 59.30 of the up-leg from 54.80 to 66.60 over the last hours, finding strong support obstacle. The bearish picture in the short-term is supported by the RSI indicator.
In the 4-hour chart, the aforementioned indicator is moving slightly lower in the negative territory near the 30 level and is approaching the oversold zone. In addition, the 20 and 40 simple moving averages are moving lower, suggesting further downside pressure.
Should prices extend their losses, immediate support could come at 58.50, a level that it tested several times in the past. In case of a fall below that barrier, the oil could hit the 7-month low of 58.00.
On the flip side, if prices jump above the 61.8% Fibonacci mark, the 50.0% Fibonacci retracement at 60.71 could act as a barrier before being able to re-challenge the 60.80 resistance barrier.
USD/JPY Decline Resumes
USD/JPY is weakening further. Hourly support at 107.63 (08/09/2017 low) is now broken, suggesting the pair could even reach resistance at 107.32 (08/09/2017 low). Hourly resistances can be found at 111.50 (18/01/2018) and 113.75 (12/12/2017 high). The technical structure suggests further short-term downside moves.
We favor a long-term bearish bias. Support given at 107.32 (08/09/2017 low) is nearing. A gradual rise towards the major resistance at 125.86 (05/06/2015 high) seems unlikely. Expected to decline further support at 101.20 (09/11/2016 low).
GBP/USD Bullish Momentum
GBP/USD is bouncing since recent sideways moves, trading between resistance at 1.4003 (23/01/2018 high) and support at 1.3742 (16/01/2018 low). The technical structure suggests further potential upside move.
The long-term technical pattern is reversing. The Brexit vote had paved the way for further decline but the pair is moving to 2016 highs. Long-term support and resistance are given at 1.1841 (07/10/2017 low) and 1.5018 (24/06/2016 high).
EUR/USD Heading Higher
EUR/USD is approaching resistance at 1.2356 (24/01/2018 high). Support is located at 1.2165 (17/01/2018 low). The technical structure suggests further upside moves.
In the longer term, the momentum is turning largely positive. We favor a continued bullish bias. Key resistance is holding at 1.2886 (15/10/2014 high) while strong support lies at 1.1554 (08/11/2017 low).
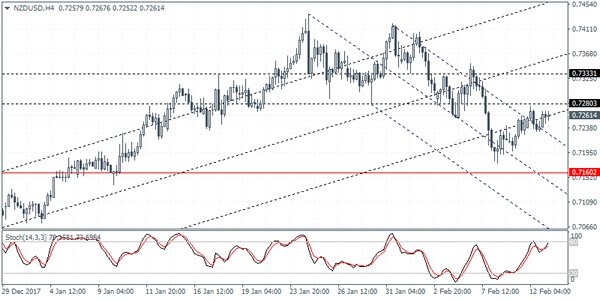
NZDUSD Intraday Analysis
NZDUSD (0.7261): The NZDUSD currency pair has been modestly drifting higher. Following the breakdown below 0.7333 level, price action formed a minor support level at 0.7280. A retest back to this level could see NZDUSD forming resistance. A reversal at this level will signal the downside price action. NZDUSD could be seen targeting the support at 0.7160. To the upside, a breakout above 0.7280 will keep NZDUSD trading flat within the resistance and support levels. Further gains can be expected only on a breakout above 0.7333 level.
GBPUSD Intraday Analysis
GBPUSD (1.3841): The British pound stayed flat with price action confined to Friday's range. Price was seen to be briefly consolidating near 1.3855 level where resistance is likely being formed. In the event that GBPUSD breaks above this level, we can expect price action to test 1.3978 which marks the next level of resistance. To the downside, the support seen at 1.3611 - 1.3589 will be tested in the near term. This will potentially mark the correction to the rally following which we could see renewed momentum taking shape.

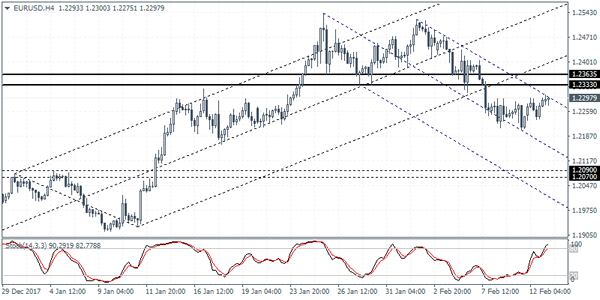
EURUSD Intraday Analysis
EURUSD (1.2297): The EURUSD was seen retracing its declines following Friday's doji pattern. The rebound to the upside could see a follow through in the short term with the potential lower high being formed on the current retracement. Resistance is seen near 1.2333 - 1.2363 level which could see price posting a reversal. This could potentially pave way for further declines to the initial support level at 1.2090 - 1.2070. Alternately, in the event that EURUSD breaks above 1.2363, we could anticipate further room to the rally above the resistance level.