Sample Category Title
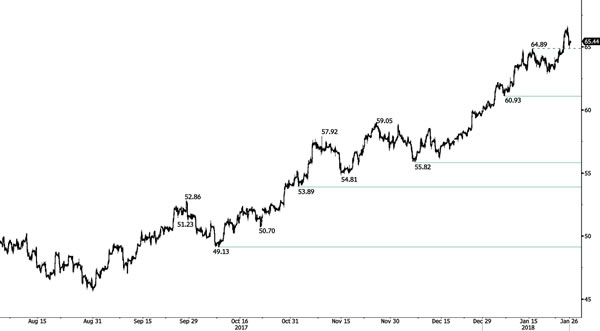
CRUDE OIL Upward Trend Maintained
Crude oil keeps increasing. Strong support is given at 60.93 (05/01/2018 low). Expected to keep increasing as demand remains strong.
In the long-term, crude oil has recovered after its sharp decline last year. However, we consider that further weakness is very likely. For the time being the pair lies in an upside trend since June 2017. Support lies at 42.20 (16/11/2016) while new resistance point is located at 77.83 (20/11/2014). Crude oil is trading largely above its 200 DMA.
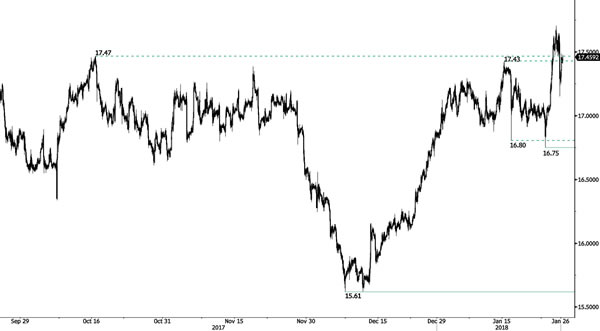
SILVER Growing Pressure
Silver has been bouncing on hourly support at 17.1539 (25/01/2018) and continues its hike. The short-term technical structure is turning positive. Hourly resistance lies at 18.21 (08/09/2017 high).
In the long-term, the trend remains negative. Further downside is very likely. The pair is trading slightly above its 200 DMA. Resistance is located at 21.58 (10/07/2014 high). Strong support can be found at 11.75 (20/04/2009).
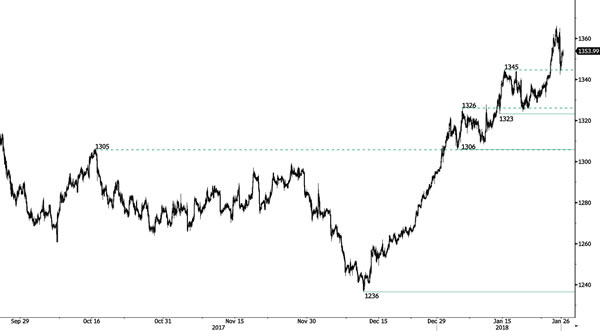
GOLD Rising (Continued)
Gold increases and exceeds 1'350. Hourly support is at 1'323 (12/01/2018 low). The technical structure indicates further short-term upside moves.
In the long-term, the technical structure suggests that there is a growing upside momentum. A break of 1'392 (17/03/2014) is required to confirm it. A major support can be found at 1'045 (05/02/2010 low).
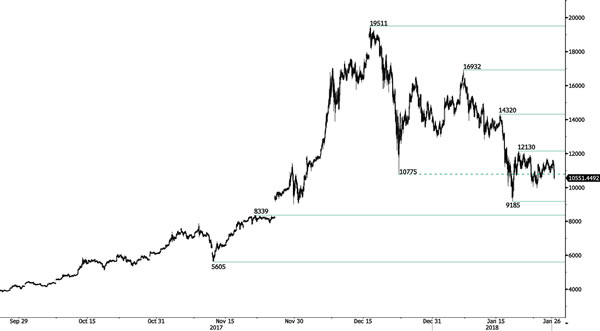
BITCOIN Decreasing
Bitcoin is heading downward. Hourly support is at 9'185 (17/01/2018 low). In the short-term, the technical structure suggests further decrease.
In the long-term, the digital currency has had an exponential growth but also presented important downturns. There is decent likelihood that the currency could stabilize between 9'000 - 12'000 in 2018. Bitcoin is trading far above its 200 DMA (5K+ gap).
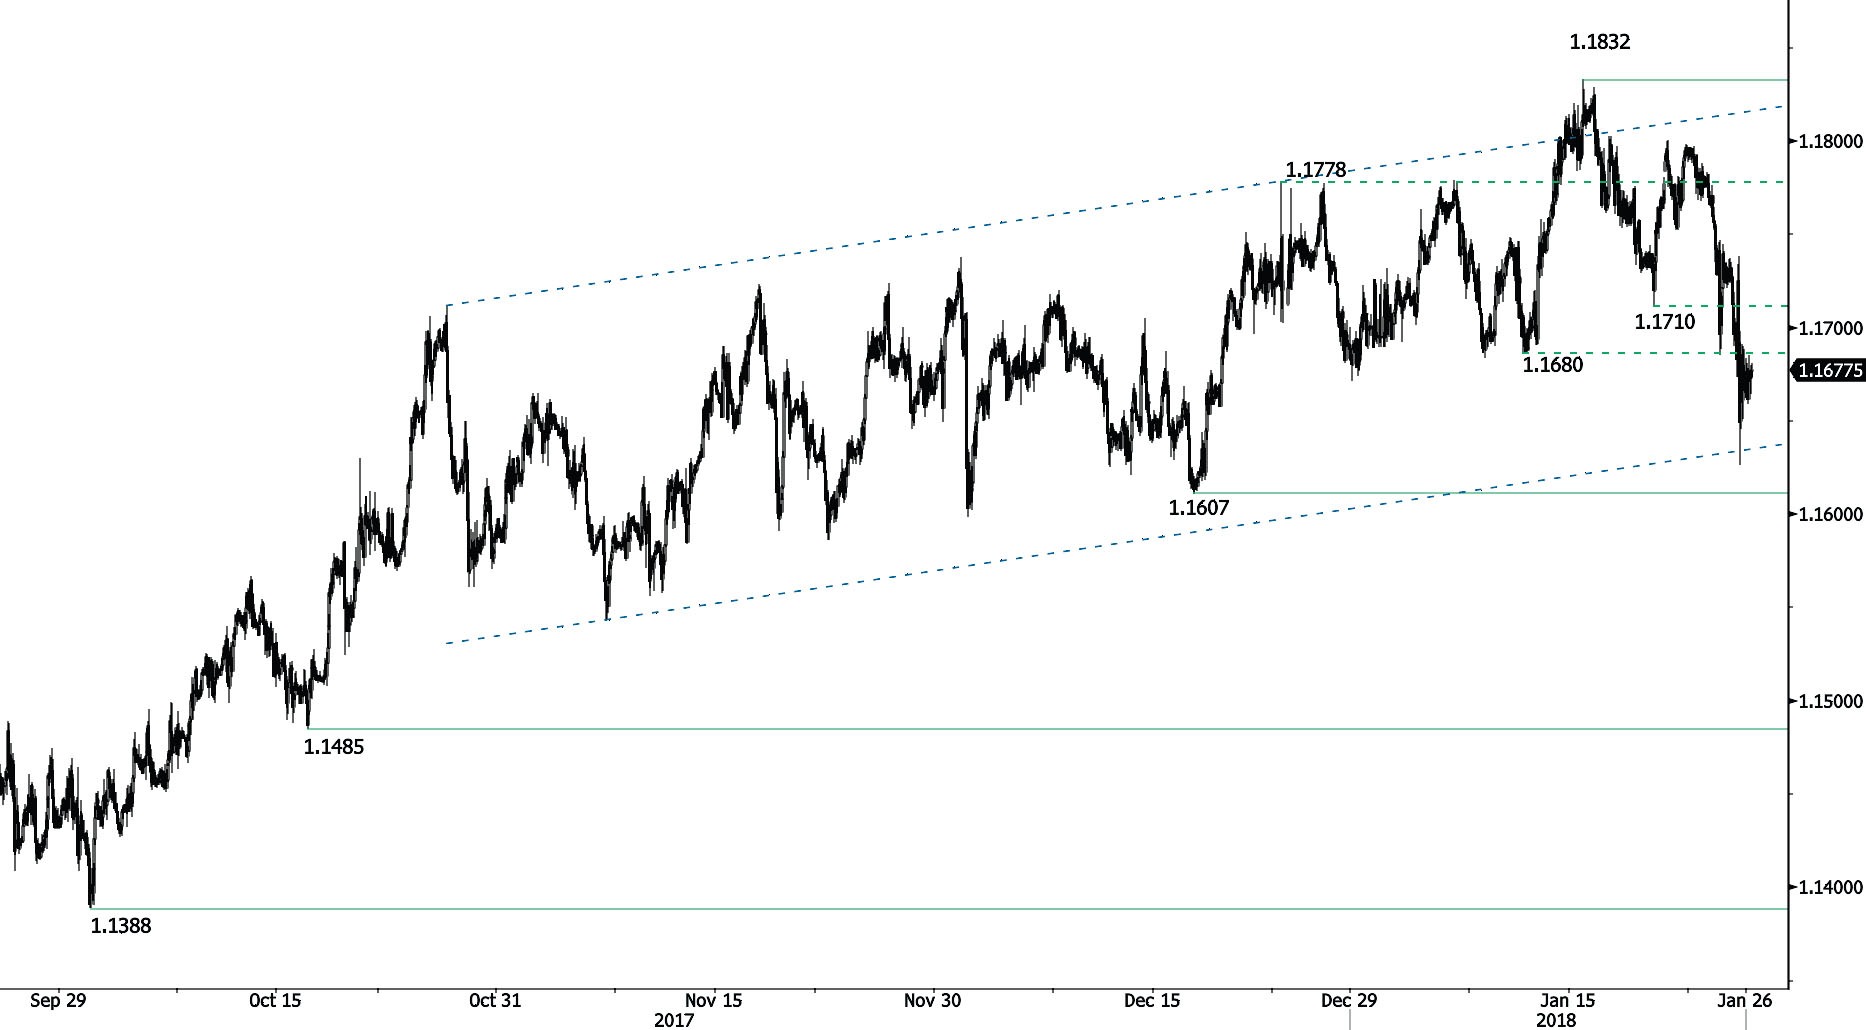
EUR/CHF Weaker Decline
EUR/CHF bearish momentum decelerates. Hourly support at 1.1607 (18/12/2017 low) is near. Hourly resistance is at 1.1832 (15/01/2018 high). Expected to show further short-term downside moves.
In the longer term, the technical structure has reversed. Strong resistance is given at 1.20 (level before the unpeg). Yet, the ECB's slowing QE program is likely to cause buying pressures on the euro, which should weigh in favour of the EUR/CHF. Support can be found at 1.0184 (28/01/2015 low) and 1.0082 (27/01/2015 low).
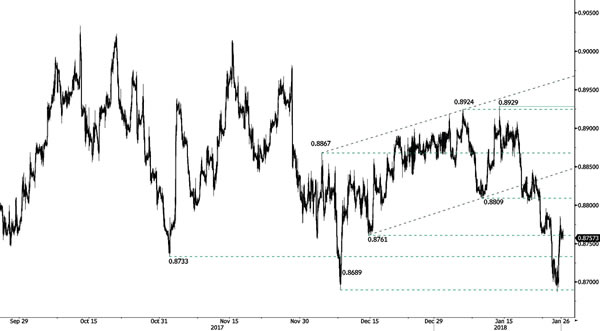
EUR/GBP Downside Skewed
.
EUR/GBP is declining after sharp rise yesterday. The pair is again distancing the resistance at 0.8929 (01/12/2017 high). Hourly resistance at 0.8689 (08/12/2017 low) has been reached. Expected to show further decline.
In the long-term, the pair has largely recovered from lows in 2015. The technical structure suggests a growing upside momentum. The pair is trading below the range of its 200 DMA. Strong resistance can be found at 0.9500 (psychological level).
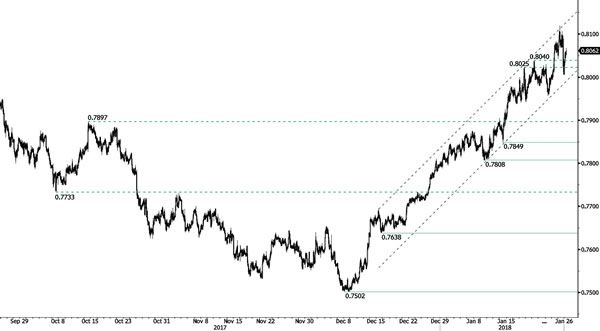
AUD/USD Rebouncing
AUD/USD's upside pressures keeps growing. Support stands at 0.7849 (12/01/2018 low). The technical structure indicates further short-term upside move.
In the long-term, the trend is turning positive. Key support stands at 0.6009 (31/10/2008 low). A break of the key resistance at 0.8164 (14/05/2015 high) is needed to invalidate our long-term bearish view (drawing near).
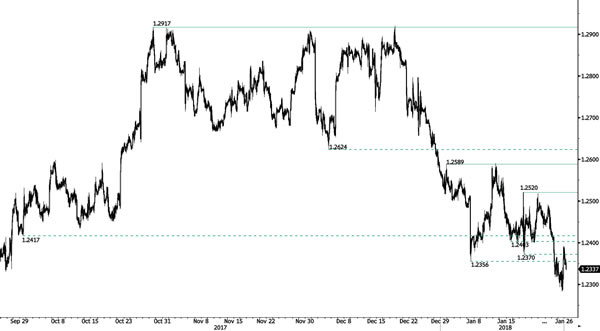
USD/CAD Renewed Fall
USD/CAD is decreasing. Hourly resistance is given at 1.2520 (17/01/2018 high) while further resistance given at 1.2589 (01/01/2018) is momentarily out of reach. The technical structure indicates that additional weakness is achievable.
In the longer term, the pair has broken longterm support that can be found at 1.2461 (16/03/2015 low). New support point is identified at 1.2128 (18/06/2015 low). Strong resistance is given at 1.4690 (22/01/2016 high). The pair is likely to head lower. The pairs is trading below 200 DMA.
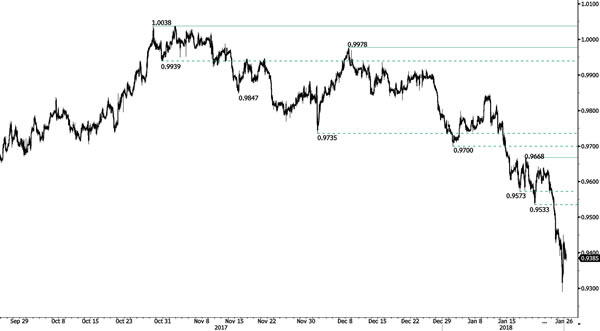
USD/CHF Converging Towards 0.9300
USD/CHF is trading lower following a small pick up. Hourly resistance at 0.9668 (17/01/2017 high) moves away. Expected to show further short-term downside move.
In the long-term, the pair is still trading in range since 2011 despite some turmoil when the SNB unpegged the CHF. Key support can be found at 0.9072 (07/05/2015 low). The technical structure favours nonetheless a long term bullish bias since the unpeg in January 2015.
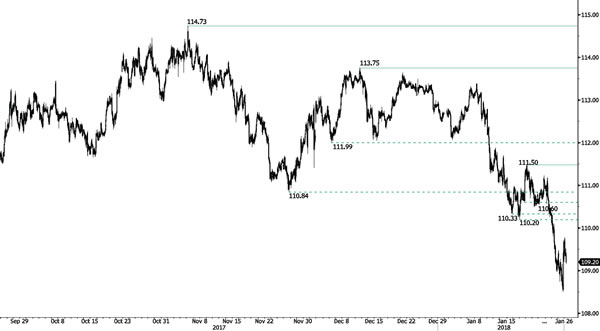
USD/JPY Bearish Breakout
USD/JPY is trading below the 110 mark. The resistance at 111.50 (18/01/2018) is distanced. The technical structure suggests further shortterm downside moves.
We favor a long-term bearish bias. Support is now given at 107.32 (08/09/2017 low). A gradual rise towards the major resistance at 125.86 (05/06/2015 high) seems unlikely. Expected to decline further support at 101.20 (09/11/2016 low).