Sample Category Title
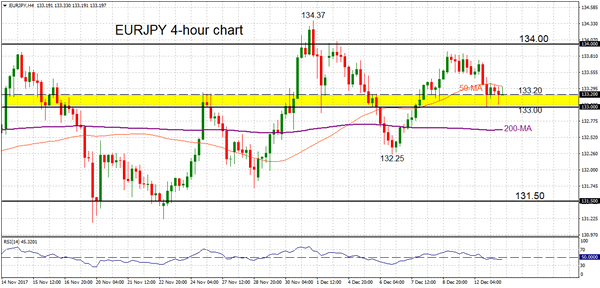
EURJPY Sees Risk To The Downside In The Short Term After Recent Rally Reverses
EURJPY has been in a neutral phase for the past three months as the pair has been trading sideways in the 131-134 area when the uptrend from April to September lost steam.
Looking at the 4-hour chart, EURJPY is capped at the 50-period moving average at 133.33. Support is in the zone between the key 133.00 level and at 133.20 and the market is consolidating recent losses following a reversal just ahead of 134.00.
A sustained break below 133.00 would increase downside pressure and propel EURJPY towards the 200-MA at 132.64 and then to the December 6 low at 132.25. A move lower would push the market towards the lower end of the range.
While immediate downward pressure has eased, a strong recovery cannot be expected in the near term since RSI is flat and showing an absence of momentum in the market. This suggests EURJPY will likely consolidate for now but further weakness cannot be ruled out as long as prices trade below the 50-MA and while RSI is below 50. EURJPY would need to clear 134.00 to shift to a more bullish outlook.
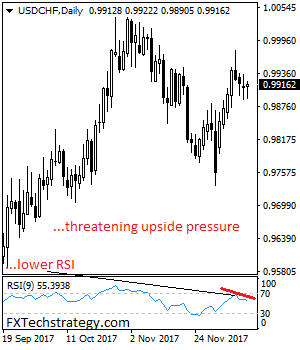
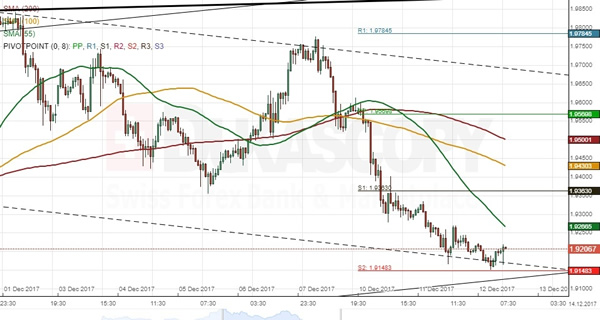
USDCHF – Hesitates, Upside Risk Builds Up
USDCHF - The With the pair continuing reject lower prices risk of a recovery higher is likely. On the downside, support lies at the 0.9900 level. A turn below here will open the door for more weakness towards the 0.9850 level and then the 0.9800 level. On the upside, resistance resides at the 0.9950 level where a break will clear the way for more strength to occur towards the 1.0000 level. Further out, resistance comes in at the 1.0050 level. Above here if seen will turn attention to 1.0100. All in all, USDCHF faces further upside pressure but with caution
Forex Technical Analysis: EUR/USD, USD/JPY, GBP/USD
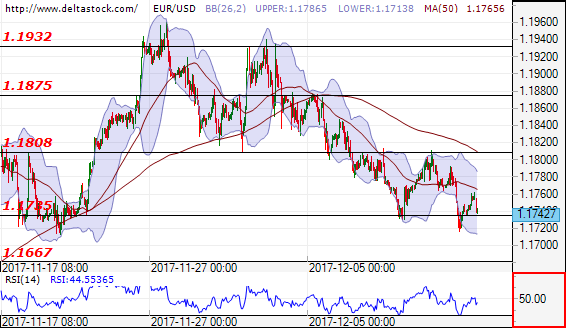
EUR/USD
Current level - 1.1742
The outlook is positive for test of the resistance level at 1.1808. In opposite direction the support level is at 1.1735. A breakthrough of that level will lead to test of the next support level at 1.1667.
| Resistance | Support | ||
| intraday | intraweek | intraday | intraweek |
| 1.1808 | 1.1932 | 1.1735 | 1.1690 |
| 1.1875 | 1.2090 | 1.1667 | 1.1550 |
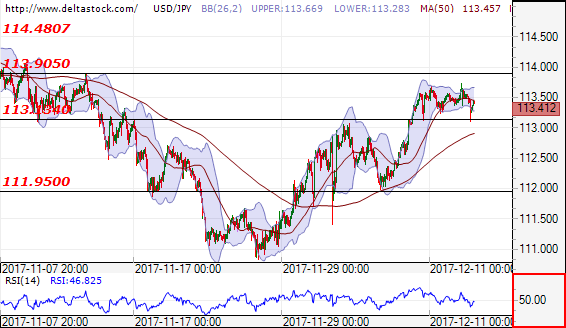
USD/JPY
Current level - 113.41
The forecast is negative for test of the resistance level at 113.13. A breakthrough of that level will lead to the next support level at 110.90. In positive direction a breakthrough of the resistance level at 113.90, might lead to the next resistance level at 114.48.
| Resistance | Support | ||
| intraday | intraweek | intraday | intraweek |
| 113.90 | 113.90 | 113.13 | 109.50 |
| 114.50 | 114.70 | 111.95 | 107.30 |
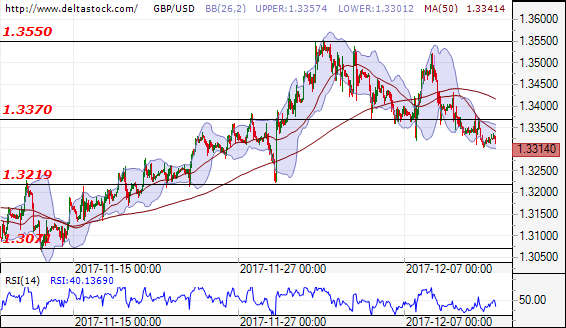
GBP/USD
Current level - 1.3314
The outlook is positive for test and breakthrough of the resistance level at 1.3370 and movement up to 1.3550. In negative direction a breakthrough of the support level at 1.3219, will lead to another test of the next support level at 1.3071.
| Resistance | Support | ||
| intraday | intraweek | intraday | intraweek |
| 1.3370 | 1.3460 | 1.3219 | 1.3219 |
| 1.3550 | 1.3660 | 1.3071 | 1.3020 |
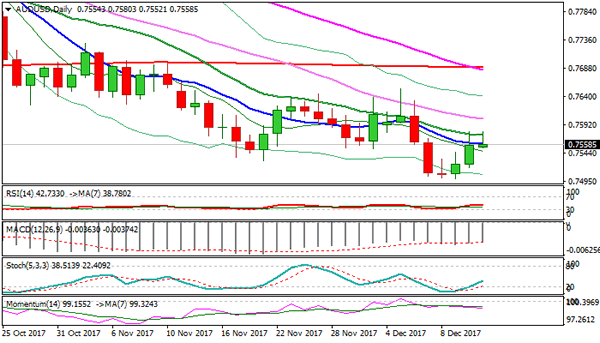
Technical Outlook: AUDUSD – Recovery Shows Strong Signs Of Stall At 20 SMA Barrier
Recovery rally from near-term base that is forming at 0.7500 is shows signs of losing traction after being repeatedly capped by 20SMA (0.7575).
Overall bearish structure warns of recovery rally stall, as solid offers at 0.7575/0.7600 zone (20SMA / 30SMA) maintain pressure.
Repeated close below 20SMA would be an additional bearish signal for fresh weakness and retest of key near-term support at 0.7500, with sustained break here to signal bearish continuation towards another strong support at 0.7482 (bull-trendline off 0.6826, 20 Jan 2016 low).
Conversely, firm break above 0.7600 resistance zone would signal extended recovery and expose key near-term barrier at 0.7653 (05 Dec high).
Res: 0.7574, 0.7600, 0.7633, 0.7653
Sup: 0.7552, 0.7518, 0.7500, 0.7482
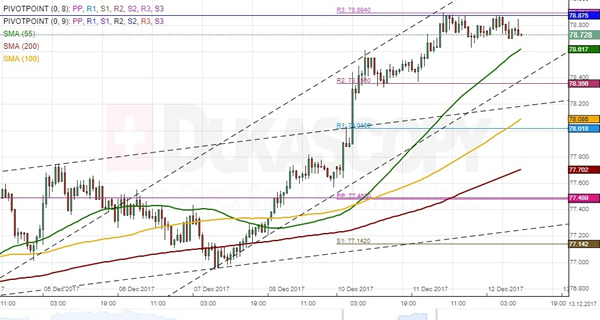
NZD/JPY 1H Chart: Kiwi Likely To Fall In Short Term
The dominant pattern which has guided NZD/JPY for the last two years is an ascending channel. The pair bounced off its upper boundary mid-July and has since been driven by bearish momentum. During the past four weeks, the Kiwi has been gradually moving towards the upper boundary a new medium-term pattern circa 80.50; thus, this upward movement might hold for the following weeks, as well. In the short term, however, the pair has failed to move above the combined resistance of the monthly R1 and the weekly R3 near the 78.88 mark. This suggests that a possible decrease in price might be due soon. The ultimate downside target for this week could be the weekly and monthly PPs at 77.50, while the 55-, 100– and 200-hour SMAs are likely to provide support for some time or even reverse the rate.
GBP/NZD 1H Chart: Pair Edges Lower In Channel
The Sterling has been trading in a long-term channel up against the New Zealand Dollar since September, 2016. The Pound tested its upper boundary two weeks ago prior to starting a new wave down. As apparent on the chart, the Pound is located near the bottom boundary of a medium-term channel which has been guiding the given currency during its latest up-wave. Thus, two scenarios are possible. On the one hand, the pair might breach this medium pattern southwards and thus continue depreciating towards the senior channel circa 1.88. On the other hand, technical indicators suggest that the rate might still go for another price increase. A possible upside target is the 200-hour SMA and the weekly PP circa 1.9550. The 55– and 100-hour SMA could also provide some resistance along the way.
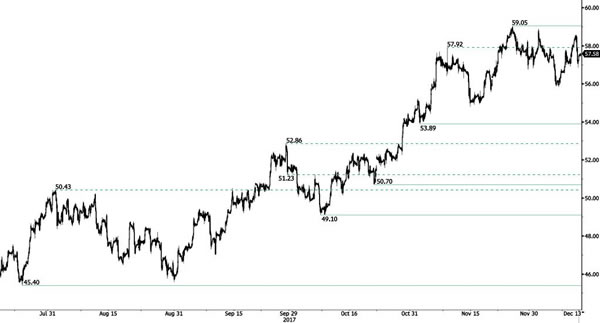
CRUDE OIL Triple Top
Crude oil is has failed to break resistance given at 59.05 (24/12/2017 high). Support is given at a distance at 54.81 (14/11/2017 low). Expected to bounce back.
In the long-term, crude oil has recovered after its sharp decline last year. However, we consider that further weakness are very likely. For the time being the pair lies in an upside momentum. Strong support lies at 35.24 (05/04/2016) while resistance can now be found at 55.24 (03/01/2017 high).
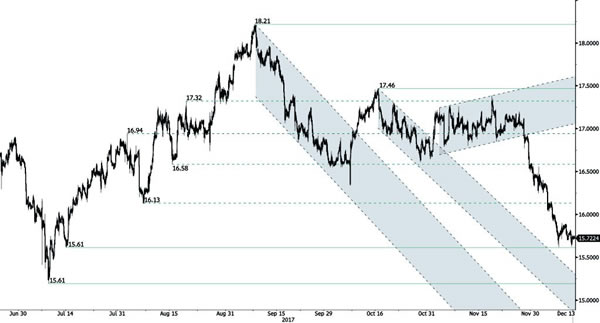
SILVER Monitoring Strong Support
Silver has been bouncing on hourly support at 15.61 (14/07/2017 low). Hourly resistance is given at 17.46 (13/10/2017 high). Expected to keep pushing lower.
In the long-term, the trend is rater negative. Further downsides are very likely. Resistance is located at 25.11 (28/08/2013 high). Strong support can be found at 11.75 (20/04/2009).
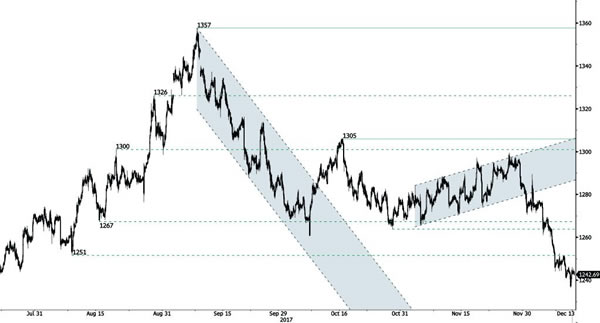
GOLD Continued Decline
Gold is still going lower after strong collapse. The technical structure confirms a further consolidation phase. Hourly support is given at 1236 (12/12/2017 low) has been broken. Resistance is located at 1288 (20/10/2017).
In the long-term, the technical structure suggests that there is a growing upside momentum. A break of 1392 (17/03/2014) is necessary ton confirm it, A major support can be found at 1045 (05/02/2010 low).
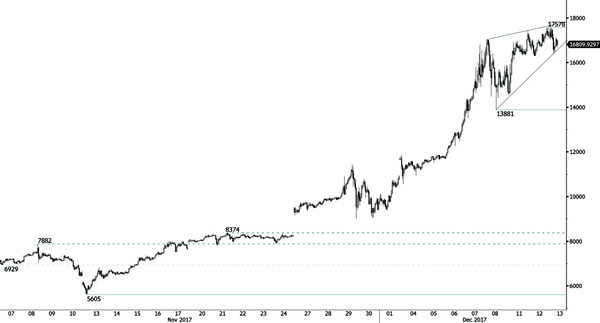
BITCOIN Bullish Triangle
Bitcoin's bullish momentum is far fom over. The technical structure has shown a tremendous positive short-term momentum. Hourly support is located below 14k (08/12/2017 low). Strong support stands very far at 2975 (22/08/2017 low). In the short-term, the digital currency should continue rising at levels unseen so far.
In the long-term, the digital currency has had an exponential growth. There are decent likelihood that the asset will reach $40'000 in 2018.