Sample Category Title
Technical Outlook: US CRUDE Is Holding Near 2 ½ Year High, Bulls To Resume After Consolidation
WTI Oil is slightly lower on Thursday but holding near fresh 2 ½ year high at $58.13, posted on Wednesday.
Strong bullish sentiment on firm signs of oil markets rebalancing, draws in oil inventories and optimism about OPEC’s output cut extension, keep oil price supported.
Bulls focus psychological $60.00 barrier and could extend towards May 2015 high at $62.71.
Meanwhile, corrective dips on overbought studies are expected to find support above rising 10SMA ($56.52).
Thinner volumes are expected today as US markets are closed for Thanksgiving holiday.
Res: 58.13, 58.63, 59.08, 59.82
Sup: 57.74, 57.02, 56.52, 56.04
Greenback Edges Lower As US Markets Close For Thanksgiving, Sell-Off In Chinese Stocks
Chinese stocks free fall, US markets closed for Thanksgiving
It is going to be a quiet day in the stock market day as US financial markets are closed in observance of the Thanksgiving Day holiday. In addition, markets will close earlier on Friday. In short, it is already the week and investors will likely trim their equity exposure especially following the disappointing economic data released yesterday. On Thursday, US futures were edging lower in thin market conditions. The S&P 500 was moving back and forth around the neutral threshold, while the futures on the Nasdaq and Dow Jones edged down 0.0% and 0.05%.
In China, both the Shanghai and Shenzhen Composites fell sharply. The former slid 2.30% while the latter fell 2.96%. The sell-off in Chinese stocks came on the back of a sharp increase in corporate bonds yields. The government has started its deleveraging campaign last year, which is aiming to reduce the overall systemic risk. Weak and highly indebted companies will therefore feel the blow as it would become more and more difficult to refinance themselves as the credit market tightens. This anticipated tightens of credit conditions is spilling over equities. Further downside adjustment in the Chinese equity market is more than likely. However, investors will reallocate their capital out of weak companies and invest more in companies with a solid financial base. This reallocation will limit the overall sell-off.
No surprise from the FOMC Meeting Minutes
According to the Fed meeting minutes released yesterday, interest rates will be raised in the “near term”. Markets’ expectations regarding a rate hike have not changed much and are still standing above 90%. The fed was clearly not in a hurry to send a very hawkish signal.
The inflation remains one very important topic and in particular the path consumer prices will take. Minutes show that the debate is still open amongst policymakers regarding inflationary pressures. In our view and as we mentioned yesterday we rather believe that there are strong inflationary pressures but the predictable inability to raise rate above a certain level – Risk of bursting the bond bubble would be very high - obliges the Fed to send mixed signals on inflation. Yellen’s comment stating “We are monitoring inflation very closely” seems contradictory with the reality of the monetary policy.
It is going to be very tough to switch a very loose monetary policy from a tighter one. Inflation is now there and will help to kill the massive debt accumulated. Right now, the dollar continues to weaken against the single currency.
NZDUSD Makes Corrective Bounce And Pauses Downward Trajectory
NZDUSD is on a continuous downward trajectory since falling from the September 20 peak of 0.7434, making a series of lower highs and lower lows. The bearish market structure is still in place, although in the near-term prices are pulling back.
Short-term charts are indicating a slight reversal. On the 4-hour chart, there was a corrective bounce off the 5-month low of 0.6780. The market has reached a critical area and is testing a key Fibonacci level. The 50% retracement of the recent downleg from 0.6979 to 0.6780 has been pierced today.
Another leg higher cannot be ruled out since RSI is above 50 and as long as NZDUSD can remain above the 50% Fibonacci in the near-term. The next target to the upside would be the 61.8% Fibonacci level at 0.6904 and the November 9 high of 0.6979. From this point, the outlook appears more bullish with scope to target the key areas at 0.7100 and 0.7200.
Meanwhile, a break below the 50% Fibonacci would target support levels at 0.6856 and 0.6828 ahead of 0.6720. Another extension lower from here would confirm the resumption of the medium-term downtrend.
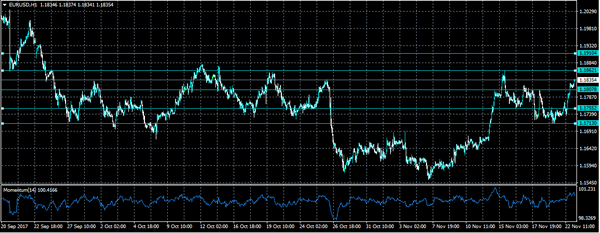
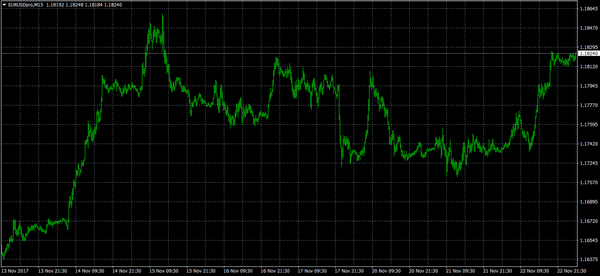
EURO Strongly Bullish Above 1.1807
The euro has risen sharply higher against the U.S dollar, reaching 1.1840, after weaker than expected economic data from the United States and a significantly more dovish than expected FOMC Minutes. The bulk of the largest U.S dollar sell-off in five months, came after the minutes of the Federal Reserve's last meeting showed “many participants” were concerned that inflation would stay below the bank’s 2 percent target for longer than expected. Traders now await the release the ECB Meeting Minutes, during the upcoming European trading session.
The EURUSD pair remains strongly bullish while trading above the 1.1807 technical level. Further upside towards 1.1860 and 1.1910 seems likely.
A sustained loss of the 1.1807 level may lead to a euro price-correction towards the 1.1755 level.
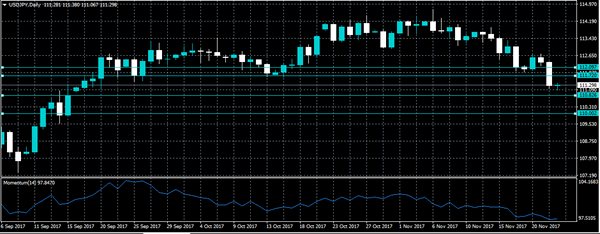
USDJPY Intraday Bearish Below 111.72 Level
The U.S dollar has moved sharply lower against the Japanese yen, crashing below its 200-day moving average, reaching 111.11, following weaker U.S data and a more dovish than expected FOMC Meeting Minutes. Price-action currently trades around the 111.30 region in early Thursday trading, which is still some way below the USDJPY 200-day moving average, which is currently located at the key 111.72 level. Trading volumes are likely to remain fairly light today, despite the downside break in the pair, as North America observes Thanksgiving holidays.
The USDJPY pair is expected to remain under selling pressure while trading below the 111.72 level, further losses towards the 110.80 and 110 level seems attainable.
Should the USDJPY pair move back above the 111.72 level, further upside towards the 112.09 resistance level would seem likely.
Technical Outlook: SPOT GOLD – Repeated Failure At Daily Cloud Base But Sentiment Remains Positive
Spot Gold price eased below daily cloud base ($1290) which was cracked on Wednesday's rally, boosted by dovish stance from Fed's policymakers.
Base of thickening daily cloud proves to be very strong barrier as several attempts to clearly break above in recent sessions failed.
However, gold is expected to maintain bullish sentiment as Fed minutes signaled that the US central bank might not be aggressive in further policy tightening as previously expected.
Extended dips under the cloud are expected to find support above $1283 (daily Tenkan-sen) to keep intact bullish structure for eventual firm break into daily cloud and extension towards $1296/$1300 targets (17 Nov high / psychological barrier.
Conversely, bearish extension below $1283 would signal another upside rejection and shift near-term focus lower.
Res: 1290, 1294, 1296, 1300
Sup: 1287, 1283, 1280, 1276
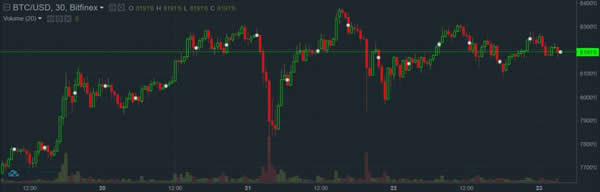
Bitcon Prices Hover Near ALl-Time Highs
It was business as usual for bitcoin on Thursday, as the world's most active cryptocurrency continued to trade near all-time highs.
BTC/USD continued to trade north of the $8,000 level on Thursday, as prices continued to push forward following weeks of renewed upside. Prices were last seen trading at $8,185, according to Bitfinex, for a market cap of roughly $137 billion.
Bitcoin surged through the stratosphere this week en route to new record highs as rising institutional demand and a failed Segwit2x fork kept demand elevated.
The coin's technical parameters show continued upside, with analysts growing increasingly bullish on bitcoin's prospects. Analysts are now targeting $10,000 as the next major resistance test.
Bitcoin is in the midst of a two-week uptrend, as prices recovered from the failed Segwit2x hard fork. The failed implementation of the hard fork sent Bitcoin Cash (BCH) surging.
EUROZONE DATA DRIVES HEADLINES ON US THANKSGIVING
Eurozone economic data will be front and centre on Thursday as US markets remain closed for Thanksgiving.
Germany kicks off the economic calendar at 07:00 GMT with a report on third quarter gross domestic product (GDP). Revised estimates are expected to show a quarterly growth rate of 0.8% for Europe's largest economy, which translates into a year-over-year gain of 2.6%.
A steady stream of French data will make headlines over the next hour, including a monthly report on the business climate. IHS Markit will also unveil final PMI figures covering manufacturing and services.
Germany is back in the spotlight at 08:30 with PMI reports spanning the manufacturing and services sectors. Germany's Composite Index is expected to show a reading of 56.7 in November, following a print of 56.6 the month before.
The 19-member Eurozone will also see fresh PMI prints on Thursday, including reports on manufacturing and services. The Eurozone Composite PMI is expected to come in at 56 for the month of November.
At 09:30 GMT, the United Kingdom is scheduled to report on third quarter GDP. The British economy is projected to grow just 0.4% in the third quarter, which translates into an annualized gain of 1.5%.
Total business investment, a closely watched indicator of private sector activity, is expected to climb 0.4%.
In terms of monetary policy, the European Central Bank (ECB) will issue its monetary policy meeting accounts at 12:30 GMT. The report will be closely scrutinized for clues about the future of Eurozone policy.
Later in the day, ECB Board member Benoit Coeure will deliver a speech.
In North America, the Canadian government will report on retail sales at 13:30 GMT. Receipts at retail stores are forecast to climb 0.9% in September after falling 0.3% the month before. Excluding automobiles, sales are projected to rise 1%.
EUR/USD
The euro regained momentum in mid-week trade, as the dollar backtracked against a basket of world currencies. The EUR/USD exchange rate is currently trading north of 1.1823 following a sharp, 60-pip acceleration during the previous session. The pair is eyeing the 1.1830 resistance level, followed by 1.1860. Immediate support is located at 1.1790, followed by 1.1745.
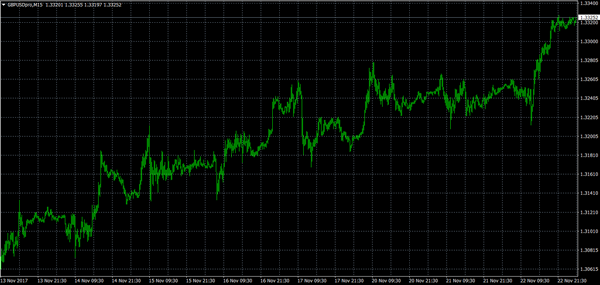
GBP/USD
The British pound crept higher on Wednesday to retake the 1.3300 US handle. Prices forged higher toward the 1.3320 level, as markets continue to eye resistance at the 50% retracement level near 1.3343. That's the next target for the GBP/USD.
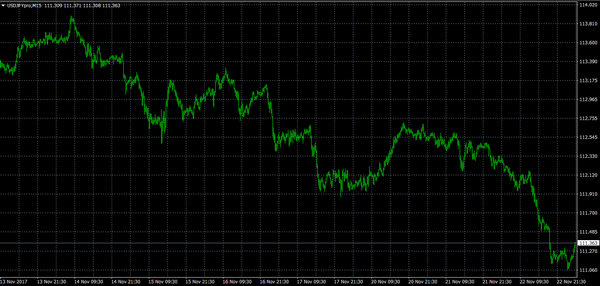
USD/JPY
The US dollar declined sharply versus the yen on Wednesday, with prices falling back toward the 111.00 handle. USD/JPY was last seen trading at 111.358, where it was virtually unchanged compared with the previous close. The pair faces immediate support at 111.20. Resistance is found way up ahead at 112.35.
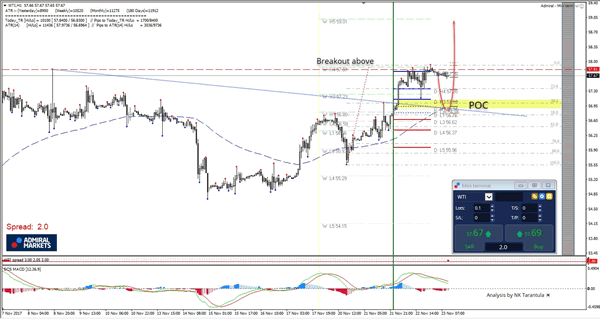
WTI W H4 Resistance Consolidation
The WTI has been trying to break the W H4 resistance but the price lacks momentum and we can spot a consolidation exactly at W H4 camarilla pivot. If the resistance holds, we might see a retracement towards the POC zone 56.86-59.10 ( D H3, inner trend line, EMA89, D H1, 38.2) and now moment buyers might spike the price again towards the W H4. However the break of 57.90 could spur another momentum buying towards 59.01. So it comes to "make it or break it" scenario. The price is bullish, the WTI is topping out, and buyers are still holding the upper hand.
W H4 - Weekly Camarilla Pivot (Strong Weekly Resistance)
D H4 - Daily Camarilla Pivot (Very Strong Daily Resistance)
D L3 – Daily Camarilla Pivot (Daily Support)
D L4 – Daily H4 Camarilla (Very Strong Daily Support)
POC - Point Of Confluence (The zone where we expect price to react aka entry zone)
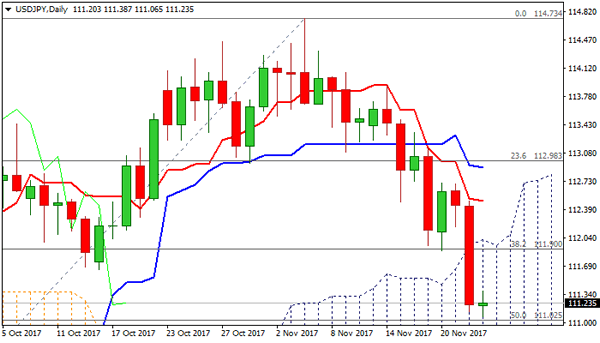
Technical Outlook: USDJPY – Consolidation Above 111.02 Target To Precede Fresh Bears
The pair holding within narrow consolidation above target at 111.02 (50% retracement of 107.31/114.73 ascend) in early Thursday’s trading.
Strong bearish acceleration on Wednesday eventually took out key supports at 111.90 (daily cloud top) and 111.70 (converged 100/200SMA’s) and generated strong signal of bearish continuation.
Bids at 111.00 zone could trigger extended consolidation, however, with limited upside action seen ideally capped by 100/200 SMA’s, guarding daily cloud top.
Firm break below 111.02 support would open way towards daily cloud base (110.37) and Fibo support at 110.15 (61.8% retracement of 107.31/114.73).
However, holiday-thinned trading may delay bears.
Res: 111.70, 112.01, 112.48, 112.90
Sup: 111.02, 110.66, 110.37, 110.15
USD/CHF Elliott Wave Analysis
USD/CHF – 0.9812
Despite rebounding last week, as the greenback ran into renewed selling interest at 0.9947 and has dropped again this week, dampening our bullishness and suggesting the corrective decline from 1.0039 top is still in progress, hence near term downside risk remains for retracement of recent rise to 0.9755-60 and then test of support at 0.9737 which is likely to hold from here. Only a drop below this level would signal top has been formed instead, bring test of key support at 0.9705 which is likely to hold from here.
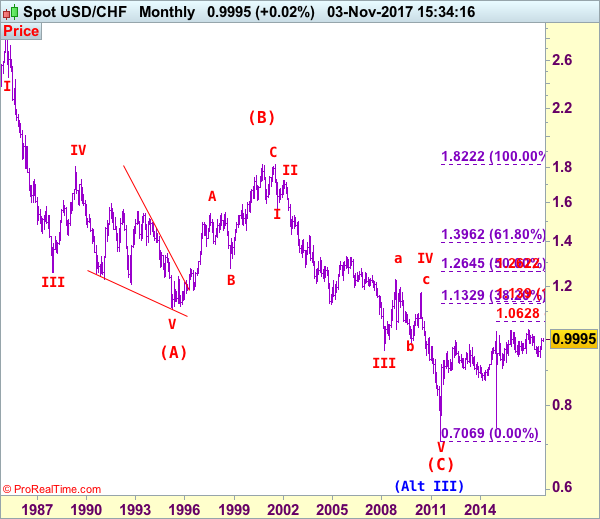
Our preferred count on the daily chart is that early selloff to 0.9630 is an end of the larger degree wave III and major correction is unfolding from there with a leg ended at 1.2298 (Nov 2008 with (a): 1.0625, (b):1.0011 and (c):1.2298), wave b ended at 0.9910 with (a): 1.0370, (b): 1.1967, (c): 0.9910. The rise from there to 1.1730 is the wave c which also marked the end of wave IV and wave V has possibly ended at 0.7068.
On the upside, whilst recovery to 0.9870-75 cannot be ruled out, reckon upside would be limited to 0.9900-10 and price should falter below said resistance at 0.9947, bring another corrective decline later. Above said resistance at 0.9947 would signal low is formed and suggest the retreat from 1.0039 has ended, bring further gain to 1.0000, then test of said resistance at 1.0039. Only above this level would confirm early upmove from 0.9421low has resumed for headway to previous resistance at 1.0100.
Recommendation: Exit long entered at 0.9875 and stand aside.
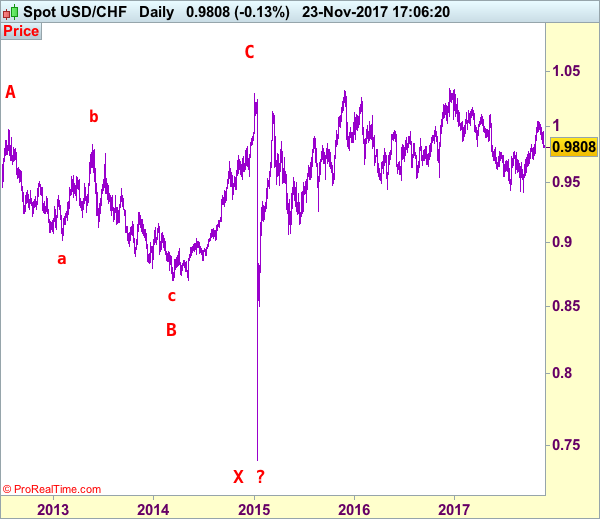
Dollar's long-term downtrend started from 2.9343 (Feb 1995) and it was unfolding as a (A)-(B)-(C) with (A): 1.1100, (B): 1.8310 (26 Oct 2000), then followed by another impulsive wave (C) with wave III ended at 0.9630 (Mar 2008). Under this count, correction in wave IV has possibly ended at 1.1730 and wave V already broke below support at 0.9630 and met indicated downside target at 0.7500 and 0.7400. The reversal from 0.7068 suggests the wave V has possibly ended and the breach of resistance at 0.9595 add credence to this view and indicated upside target at 1.0000 had been met, however, the sharp retreat from 1.0296 to 0.7401 suggests choppy trading would be seen but price should stay above said record low at 0.7068.