Sample Category Title
Yen Weakens as US Yields Bounce, Markets Eye Trump’s Reciprocal Tariffs and US CPI
Yen struggled in the Asian session and stayed weak, with renewed selling pressure driven by a combination of rising US Treasury yields and ongoing concerns over trade policy developments. Market participants are still digesting the implications of US President Donald Trump's decision to reintroduce tariffs on steel and aluminum imports, with Canada and the EU voicing strong opposition. Japan has now joined Australia in formally requesting an exemption, but there is little clarity on whether any exceptions will be granted. The focus has now shifted to Trump’s impending announcement of "reciprocal tariffs," which he indicated would be unveiled either yesterday or today. Until the full scope of these measures is known, uncertainty in currency markets is likely to persist.
Meanwhile, Fed Chair Jerome Powell’s testimony overnight reinforced expectations that the central bank is in no rush to adjust its policy stance. His remarks confirmed that the current pause in rate cuts could last for an extended period, particularly if inflation remains sticky. Fed funds futures continue to price in roughly 50% probability of a rate cut occurring in June, suggesting that market participants are still divided on the timing of Fed’s next move.
The upcoming release of US consumer inflation data will be a critical factor in shaping those expectations. Headline CPI is forecast to remain steady at 2.9%, while core CPI is projected to dip slightly from 3.2% to 3.1%. However, any upside surprise could further push expectations for rate cuts into the second half of the year.
In the currency markets, Sterling has emerged as the strongest performer so far this week, followed by Euro and Aussie. At the other end of the spectrum, Yen is the weakest major currency, Swiss franc and Kiwi are also underperforming. Dollar and Loonie are trading in a more mixed manner.
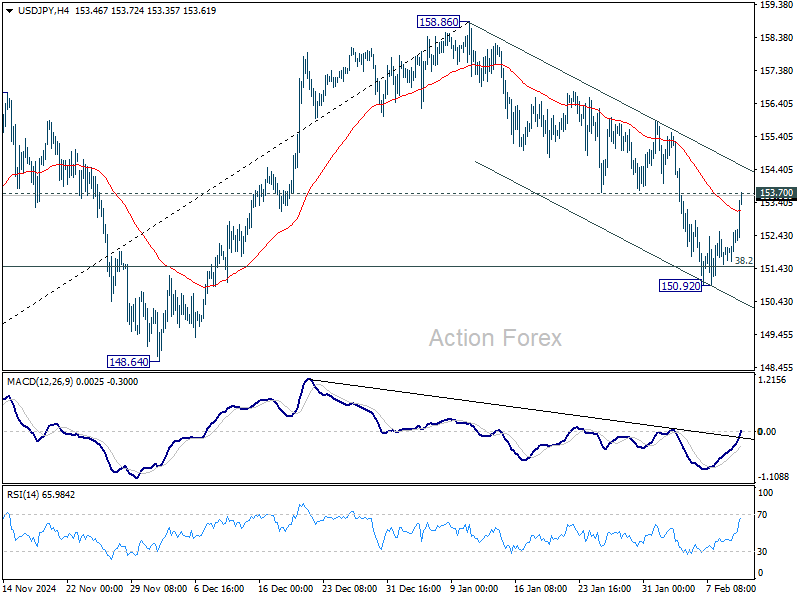
Technically, US 10-year Treasury yield has found strong support at 38.2% retracement of 3.603 to 4.809 at 4.348. The subsequent rebound has brought attention back to the 4.590 resistance. Firm break above this point would indicate that pullback from 4.809 has concluded, setting the stage for stronger rally to retest that high. Given the close correlation between US yields and USD/JPY, further bounce in Treasury yields could provide additional lift for the pair, pushing it back toward 158.86 high.
In Asia, at the time of writing, Nikkei is up 0.34%. Hong Kong HSI is up 1.34%. China Shanghai SSE is down -0.12%. Singapore Strait Times is down -0.09%. Japan 10-year JGB yield is up 0.025 at 1.341, at the highest level since 2011. Overnight, DOW rose 0.28%. S&P 500 rose 0.03%. NASDAQ fell -0.36%. 10-year yield rose 0.044 to 4.537.
Fed's Williams: Current modestly restrictive policy well positioned to achieve dual mandate
New York Fed President John Williams stated in a speech overnight that policy remains “well positioned” to balance the dual mandate. He added that the current “modestly restrictive” policy is expected to support a gradual return to 2% inflation while maintaining economic growth and labor market resilience.
Nevertheless, Williams also acknowledged the high degree of uncertainty surrounding the economic outlook, particularly concerning fiscal, trade, immigration, and regulatory policies.
On the labor market, Williams noted that it has reached a “good balance” after a period of "unsustainably tight conditions" in prior years. He highlighted that wage growth has now aligned with productivity gains, which should keep inflationary pressures contained. He projected inflation at around 2.5% this year and expects it to reach the Fed’s 2% target “in coming years.”
Williams also forecasted that the unemployment rate would remain stable between 4% and 4.25% throughout the year, with GDP growth expected to hold around 2% both in 2025 and 2026.
ECB's Schnabel: Europe must rethink export-driven model amid geopolitical fragmentation
ECB Executive Board member Isabel Schnabel emphasized in a speech that while interest rate cuts could help "mitigate economic weakness", they are not a cure-all for the deeper "structural crises" facing Eurozone.
She pointed to persistent issues such as high energy prices, declining competitiveness, and labor shortages, which continue to weigh on the region’s economic outlook.
Schnabel acknowledged the growing pressures facing Europe’s economy, particularly in light of Donald Trump’s return to the White House and his trade policies.
“The export-led growth model needs to be reconsidered in the face of this increasing geopolitical fragmentation,” she stated.
USD/JPY Daily Outlook
Daily Pivots: (S1) 151.90; (P) 152.25; (R1) 152.86; More...
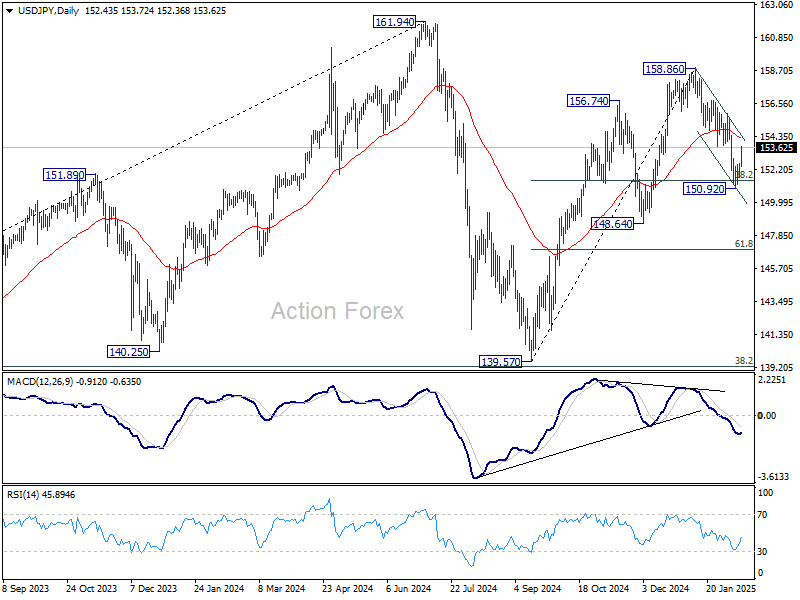
Immediate focus is now on 153.70 support turned resistance as USD/JPY's rebound from 150.92 extends. Firm break of 153.70 will argue that correction from 158.86 has already completed after drawing support from 38.2% retracement of 139.57 to 158.86 at 151.49. Such development will also keep the rally from 139.57 intact. Further rise should then be seen to retest 158.86 next. ON the downside, however, sustained trading below 151.49 will suggest that whole rise from 139.57 has completed, and bring deeper fall to 61.8% retracement at 146.32 next.
In the bigger picture, price actions from 161.94 are seen as a corrective pattern to rise from 102.58 (2021 low). In case of another fall, strong support should be seen from 38.2% retracement of 102.58 to 161.94 at 139.26 to bring rebound. However, sustained break of 139.26 would open up deeper medium term decline to 61.8% retracement at 125.25.
Gold Eyes $3,000: Is a Historic Milestone Within Reach?
Key Highlights
- Gold started a fresh surge above the $2,900 resistance and traded to a new record high.
- A key bullish trend line is forming with support at $2,855 on the 4-hour chart.
- Bitcoin is struggling to clear the $100,000 resistance zone.
- The US Consumer Price Index could rise 2.9% in Jan 2025 (YoY).
Gold Price Technical Analysis
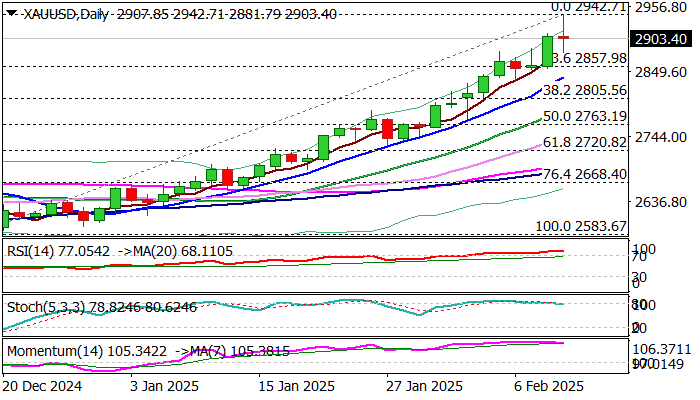
Gold prices started a fresh rally above the $2,850 resistance. The bulls pumped the price above the $2,900 level and the price traded to a new record high.
The 4-hour chart of XAU/USD indicates that the price traded as high as $2,942. It settled well above the 100 Simple Moving Average (red, 4 hours) and the 200 Simple Moving Average (green, 4 hours).
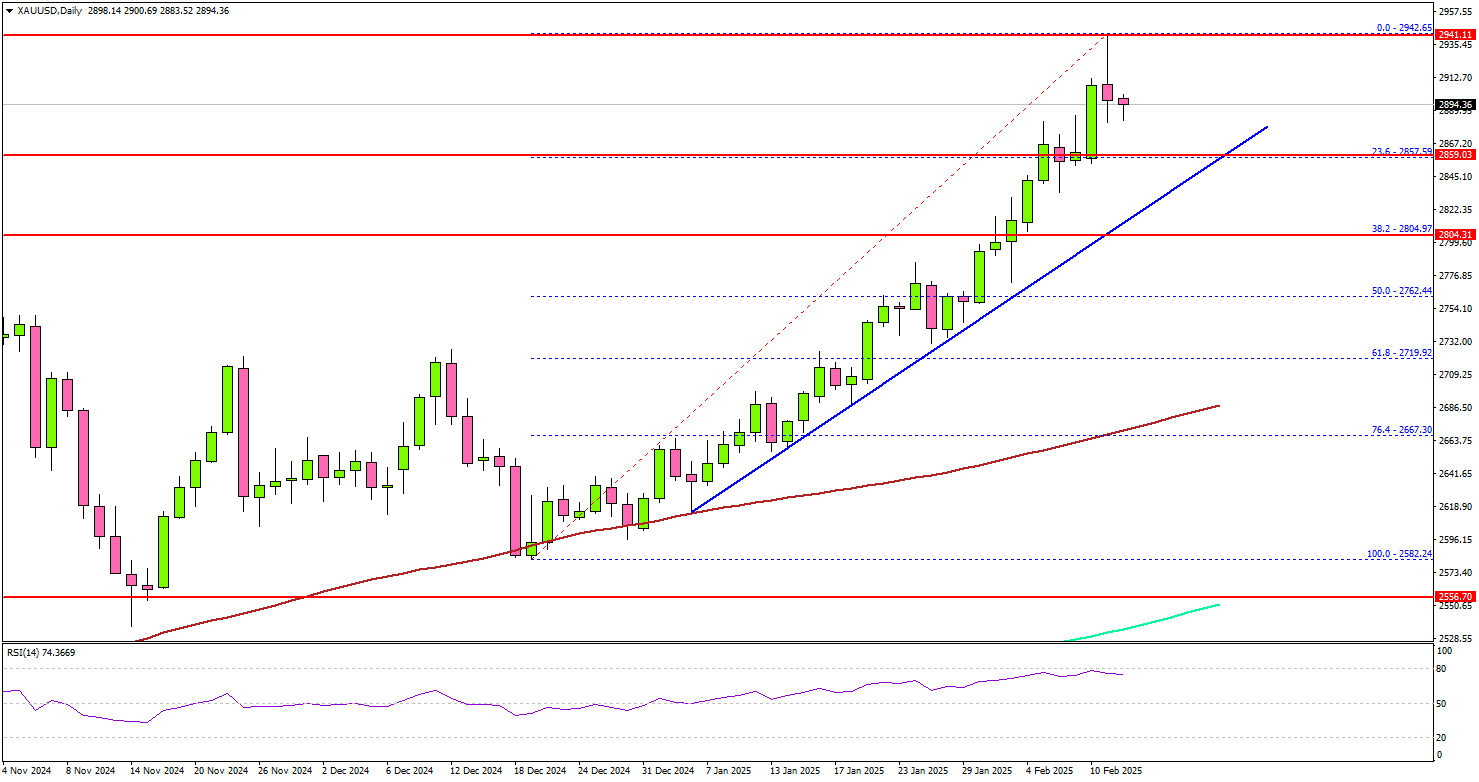
The current price action is bullish and indicates chances of more upsides. On the upside, immediate resistance is near the $2,940 level. The next major resistance sits near the $2,955 level.
A clear move above the $2,955 resistance could open the doors for more upsides. The next major resistance could be $2,980, above which the price could rally toward the milestone level at $3,000.
On the downside, initial support is near the $2,865 level. The first key support is near $2,855. There is also a key bullish trend line forming with support at $2,855 on the same chart. The next major support is near the $2,820 level.
The main support is now $2,805. A downside break below the $2,805 support might call for more downsides. The next major support is near the $2,740 level.
Looking at Bitcoin, the price attempted a recovery wave but the bears are still active below the $100,000 level.
Economic Releases to Watch Today
- US Consumer Price Index for Jan 2025 (MoM) – Forecast +0.3%, versus +0.4% previous.
- US Consumer Price Index for Jan 2025 (YoY) – Forecast +2.9%, versus +2.9% previous.
- US Consumer Price Index Ex Food & Energy for Jan 2025 (YoY) – Forecast +3.1%, versus +3.2% previous.
Fed’s Williams: Current modestly restrictive policy well positioned to achieve dual mandate
New York Fed President John Williams stated in a speech overnight that policy remains “well positioned” to balance the dual mandate. He added that the current “modestly restrictive” policy is expected to support a gradual return to 2% inflation while maintaining economic growth and labor market resilience.
Nevertheless, Williams also acknowledged the high degree of uncertainty surrounding the economic outlook, particularly concerning fiscal, trade, immigration, and regulatory policies.
On the labor market, Williams noted that it has reached a “good balance” after a period of "unsustainably tight conditions" in prior years. He highlighted that wage growth has now aligned with productivity gains, which should keep inflationary pressures contained. He projected inflation at around 2.5% this year and expects it to reach the Fed’s 2% target “in coming years.”
Williams also forecasted that the unemployment rate would remain stable between 4% and 4.25% throughout the year, with GDP growth expected to hold around 2% both in 2025 and 2026.
ECB’s Schnabel: Europe must rethink export-driven model amid geopolitical fragmentation
ECB Executive Board member Isabel Schnabel emphasized in a speech that while interest rate cuts could help "mitigate economic weakness", they are not a cure-all for the deeper "structural crises" facing Eurozone.
She pointed to persistent issues such as high energy prices, declining competitiveness, and labor shortages, which continue to weigh on the region’s economic outlook.
Schnabel acknowledged the growing pressures facing Europe’s economy, particularly in light of Donald Trump’s return to the White House and his trade policies.
“The export-led growth model needs to be reconsidered in the face of this increasing geopolitical fragmentation,” she stated.
AUDJPY Technical Analysis
The USDJPY pair is edging closer to 152.00 in Tuesday’s European session but remains within Monday’s price range, indicating a sideways movement. Traders are holding back as they wait for Federal Reserve (Fed) Chair Jerome Powell’s testimony before Congress at 15:00 GMT, hoping for insights into the Fed’s future policies.
Investors want to know how long the Fed will keep interest rates between 4.25%-4.50%. Powell is unlikely to give a clear timeline on when the Fed might start cutting rates again, as he previously stated that rate changes would depend on inflation cooling or the job market weakening.
Market watchers also want to hear Powell’s thoughts on the potential impact of Trump’s 25% tariffs on steel and aluminum imports, which take effect on 12th Mar. Many believe these tariffs could push inflation higher in the US.
Meanwhile, the Japanese Yen’s strong rally in January has stalled. Investors had been buying the Yen, expecting that the Bank of Japan (BoJ) would raise interest rates to narrow the gap with other central banks. BoJ officials have hinted at another possible rate hike if the economy and inflation continue to meet their forecasts.
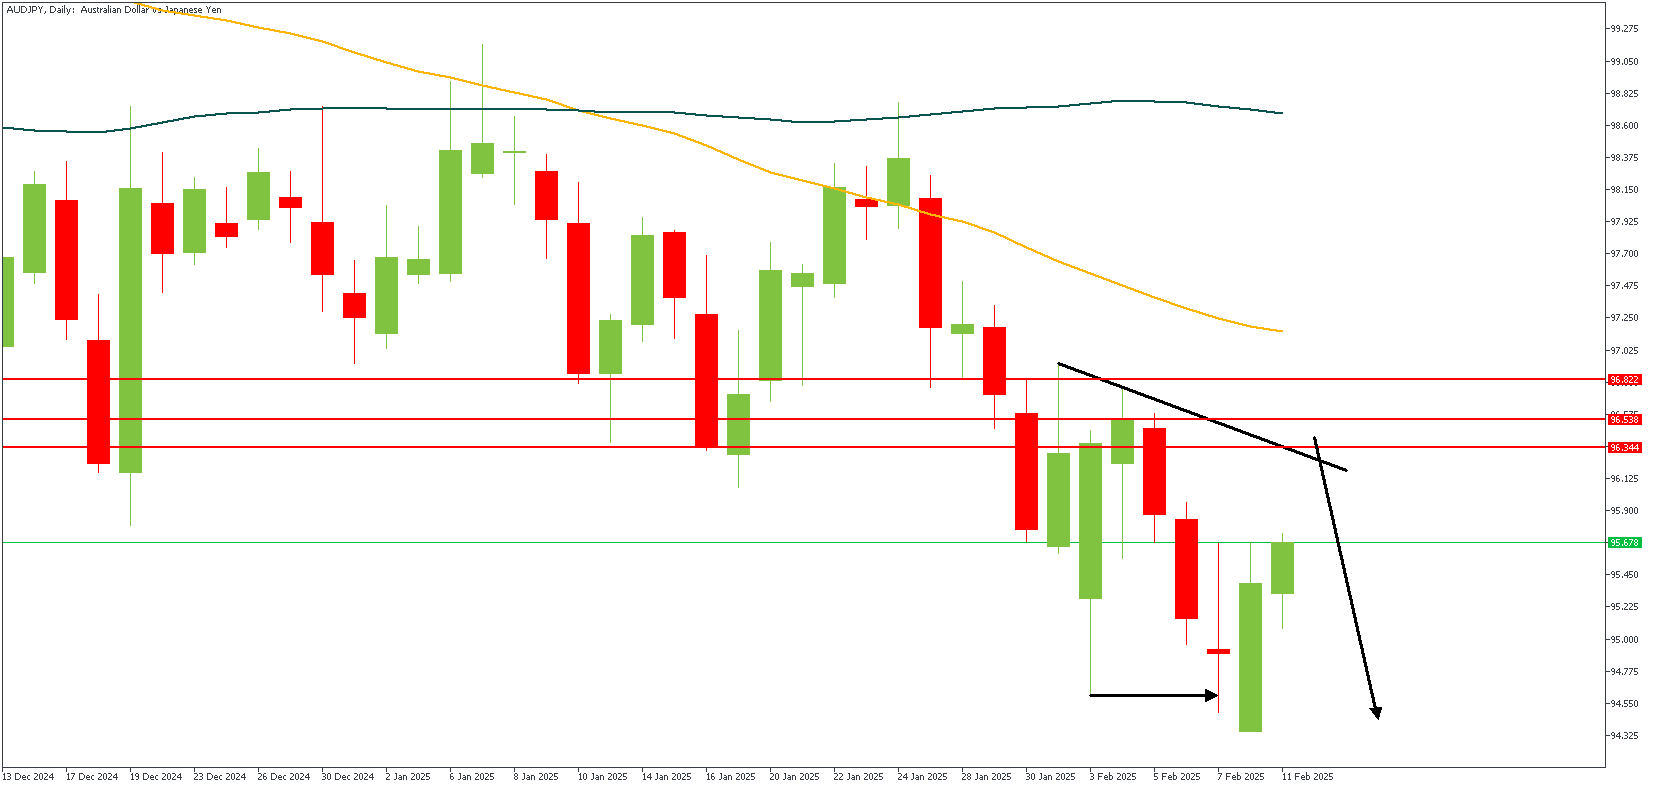
AUDJPY – D1 Timeframe
The price action on the daily timeframe chart of AUDJPY is approaching the resistance trendline, and the moving averages are currently in a bearish array. The recent low created a structure break, indicating the current trend is bearish. The bearish sentiment is the safer option, considering the additional confluence from the pivot zone.
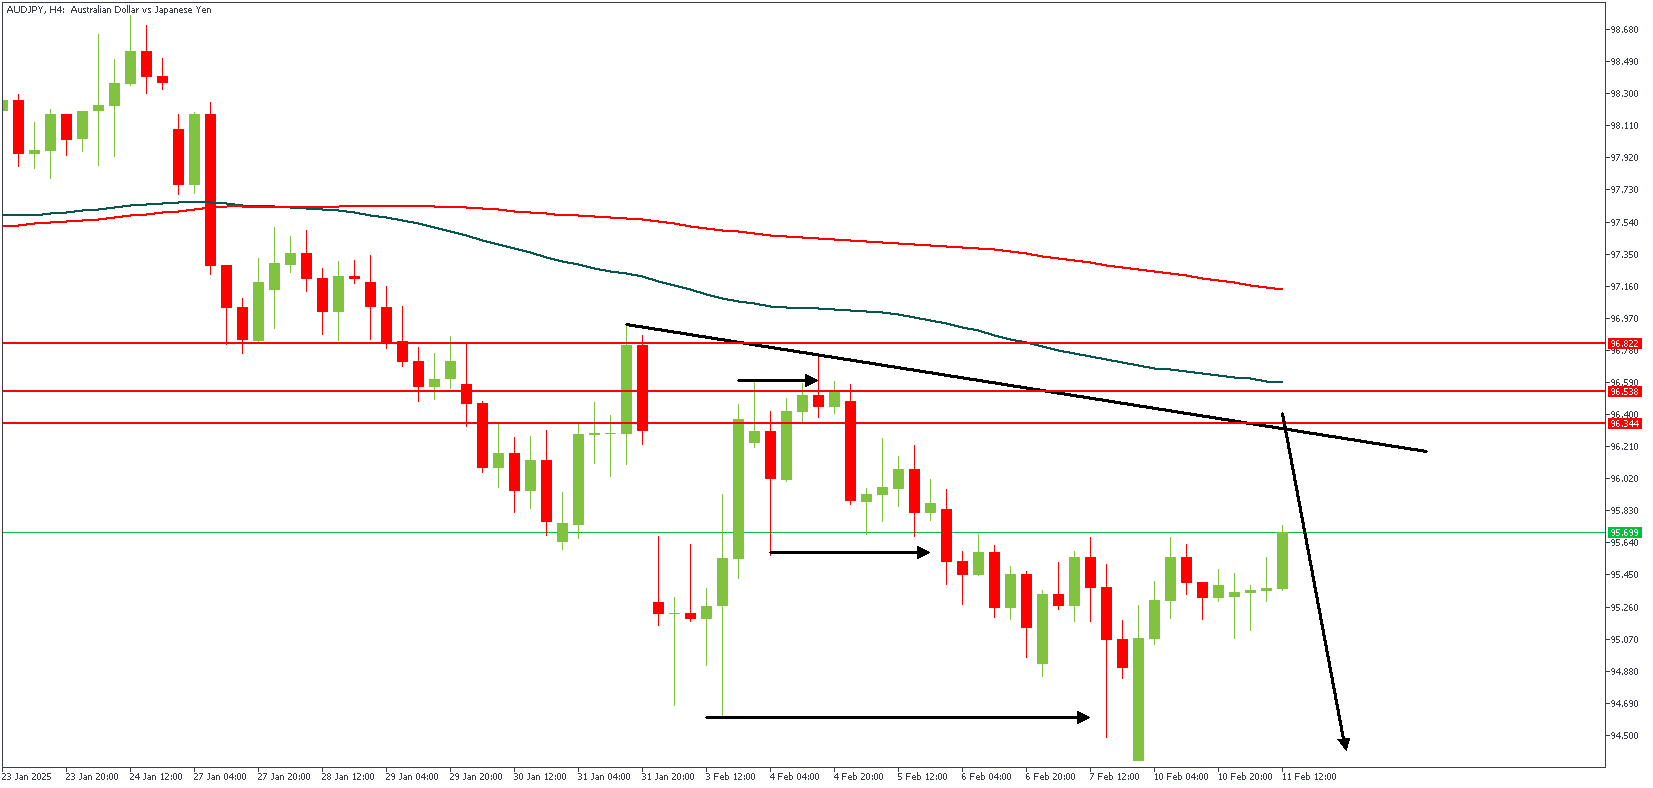
AUDJPY – H4 Timeframe
The 4-hour timeframe chart of AUDJPY breaks down the daily timeframe sentiment to reveal the supply zone of the SBR (sweep-break-retest) pattern buried within the daily timeframe pivot region. Further confirming the bearish sentiment.
Analyst’s Expectations:
- Direction: Bearish
- Target: 94.5
- Invalidation: 97.206
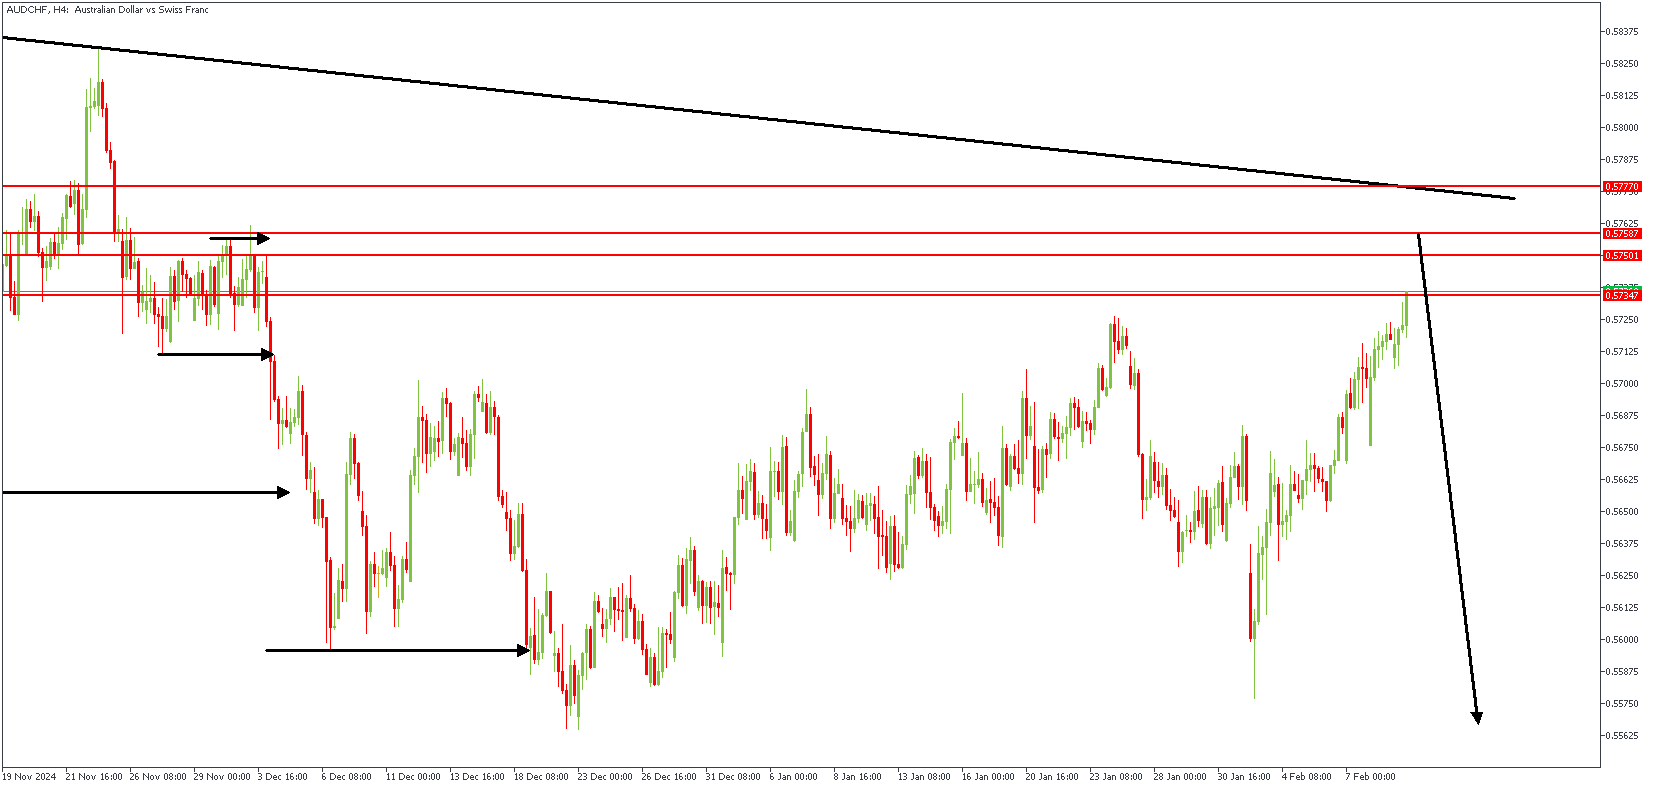
AUDCHF Technical Analysis
The AUDUSD pair is holding steady, with key support at 0.6087—its lowest level this year. If it drops below this, it could fall further to 0.6000, while resistance is around 0.6330 and 0.6549. The Relative Strength Index (RSI) suggests some buying interest, but the Average Directional Index (ADX) signals that the current trend may weaken. The Australian Dollar has gained ground as the US Dollar weakens, despite ongoing trade tensions between the US and China, which could impact Australia’s exports. For further economic clues, traders will watch Australia’s upcoming home loan data (12th Feb.) and inflation expectations (14th Feb.).
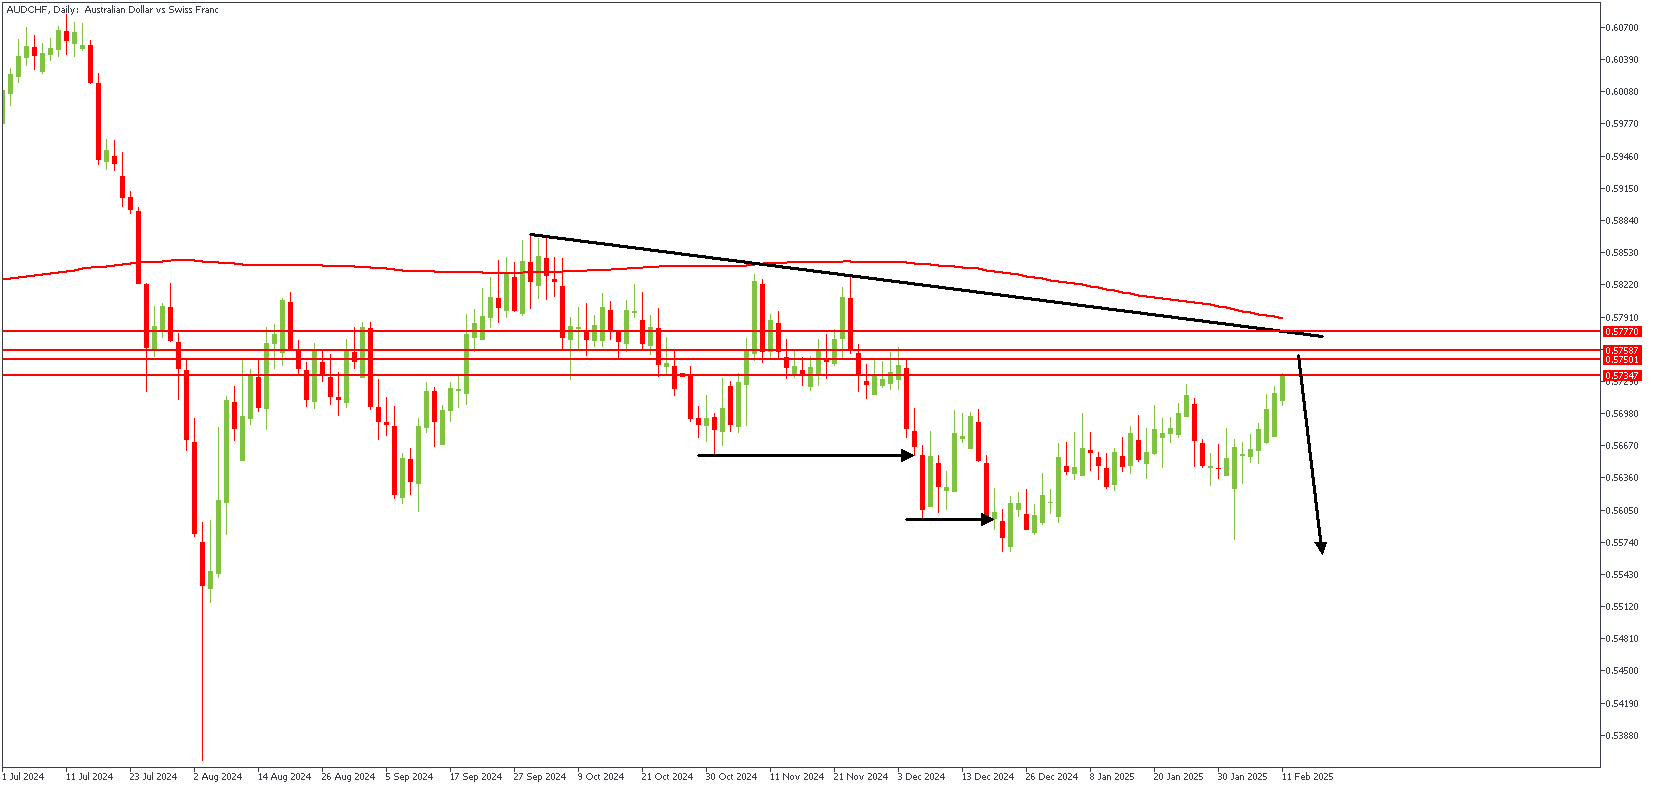
AUDCHF – D1 Timeframe
On the daily timeframe chart of AUDCHF, we see price currently approaching the trendline resistance and the pivot region. Interestingly, the supply region is nearby, thus increasing the likelihood of a bearish reaction from the highlighted zone.
AUDCHF – H4 Timeframe
The 4-hour timeframe chart shows the supply zone more evident, with expectations of a sweep of liquidity and a Fair Value Gap entry. With these confluences aligning with the daily timeframe sentiment, there’s sufficient argument for a bearish outcome.
Analyst’s Expectations:
- Direction: Bearish
- Target: 0.55875
- Invalidation: 0.57841
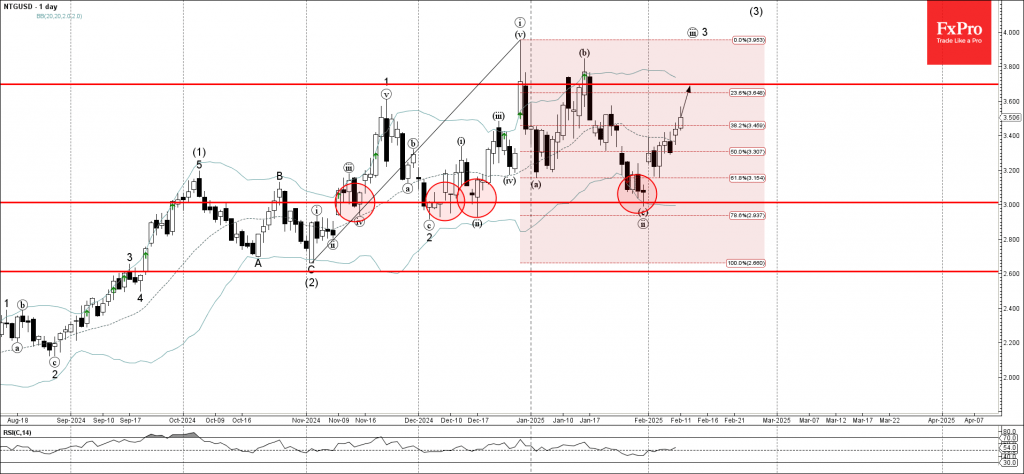
Natural Gas Wave Analysis
- Natural gas reversed from the support area
- Likely to rise to the resistance level 3.67
Natural gas continues to rise strongly inside the short-term upward impulse wave iii, which started earlier from the support area located between the round support level 3.0000 (which has been steadily reversing the price from November) and the lower daily Bollinger Band.
The upward reversal from this support area created the daily upward gap – which signals the strength of this support area.
Given the clear daily uptrend, Natural gas can be expected to rise to the next resistance level 3.67 (which has been reversing the price from December).
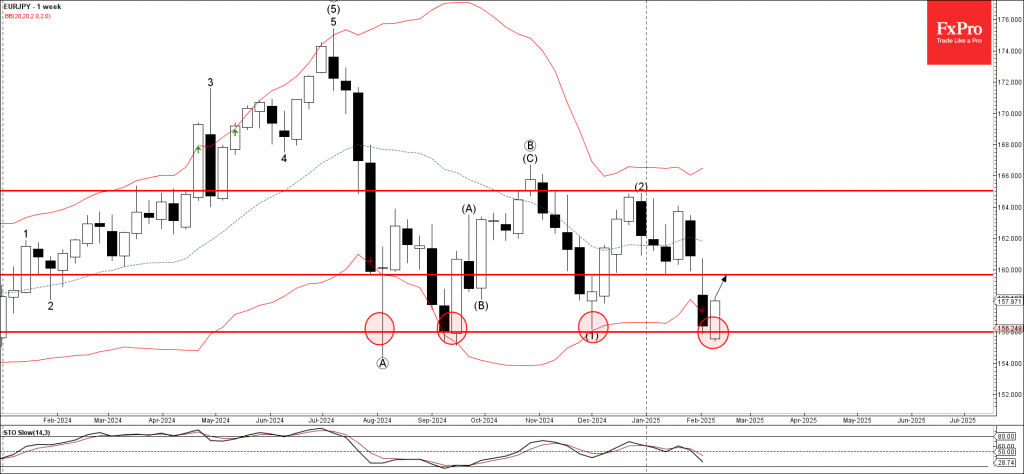
EURJPY Wave Analysis
- EURJPY reversed from the support area
- Likely to rise to the resistance level 159.65
EURJPY currency pair recently reversed up from the support area located between the key support level 156.000 (which has been steadily reversing the price from August of 2024 as can be seen below) and the lower weekly Bollinger Band.
The upward reversal from the support area stopped the previous weekly downward impulse wave (3) from last year.
Given the strength of the support level 156.000, EURJPY currency pair can be expected to rise to the next resistance level 159.65 (the former weekly low from January).
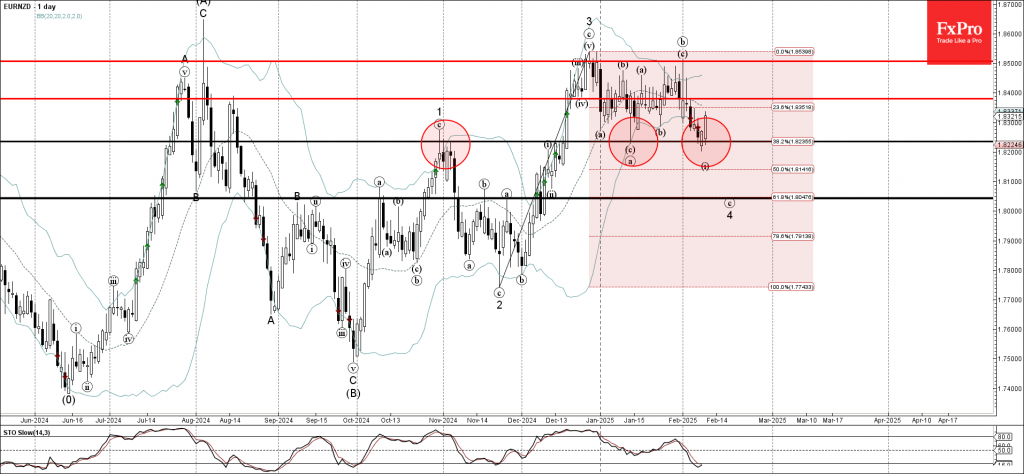
EURNZD Wave Analysis
- EURNZD currency pair reversed from the support area
- Likely to rise to the resistance 1.8380
EURNZD currency pair recently reversed up from the support area located between the pivotal support level 1.8235 (former monthly low from January), lower daily Bollinger Band and the 38.2% Fibonacci correction of the upward impulse from November
The upward reversal from this support area created the daily Japanese candlesticks reversal pattern Morning Star.
Given the multi-month uptrend and the oversold daily Stochastic, EURNZD currency pair can be expected to rise to the next resistance 1.8380.
Gold Price Eases from New Record High, Supportive Fundamentals Suggest Dips Likely Limited
Gold price dipped on Tuesday on partial profit taking, as traders reacted on overbought daily studies, against very supportive fundamentals.
The price spiked to new record high ($2942) earlier today as the latest set of tariffs on steel and aluminium imports in the US raised concerns of escalation of trade war, which could cause a massive negative impact on global economy.
On the other hand, today’s comments from Fed Chair Powell that the central bank is not in hurry to cut interest rates, as the economy remains in good shape and current monetary policy is adequate to stand further economic growth and potential rise in inflation may provide headwinds to metal’s price.
Wednesday’s release of US January CPI will be closely watched.
Today’s dip was so far limited with daily action shaped in Doji candle which signals indecision and suggests that more evidence will be needed to have clearer near term direction signal.
This also warns traders of extra caution while trading in this zone.
Initial support lays at $2880 zone (session low / 5DMA) followed by ascending daily Tenkan-sen ($2850) and $2805 (Fibo 38.2% of $2582/$2942 upleg).
On the flip side, projections at $2946/83 mark next targets ahead of key $3000 barriers.
Res: 2942; 2946; 2983; 3000
Sup: 2880; 2850; 2834; 2805