
Sample Category Title
US NFIB small business optimism drops as uncertainty rises, hiring challenges persist
NFIB Small Business Optimism Index declined to 102.8 in January, missing market expectations of 104.6 and falling from December’s reading of 105.1.
The decline reflects growing concerns among small business owners, as seven out of the 10 components of the index deteriorated, while only one improved. Additionally, the Uncertainty Index surged 14 points to 100, marking the third-highest reading in its history after two months of easing uncertainty.
NFIB Chief Economist Bill Dunkelberg highlighted while there is still "optimism regarding future business conditions," uncertainty is climbing. One major concern remains the persistent "hiring challenges," as businesses struggle to find qualified workers to fill vacancies. Capital investment plans are also being reconsidered.
Yen’s Rally Stalls But May Resume Soon
USD/JPY is consolidating near 151.96 after a temporary pause in the yen’s recent strength.
Key market factors
At the beginning of the week, the Japanese yen weakened against the US dollar as the greenback reacted to fresh US trade tariffs.
US President Donald Trump recently signed an executive order imposing a 25% tariff on steel and aluminium imports, with no exemptions for partner countries. This decision has triggered fears of a global trade war, which could, in turn, limit the Federal Reserve’s ability to cut interest rates further.
Despite this, the yen appreciated by 2% against the USD last week, driven by increasing market expectations that the Bank of Japan (BoJ) will continue its monetary tightening cycle.
BoJ policymaker Naoki Tamura reinforced this view last Thursday by suggesting that the central bank should move towards an interest rate of at least 1% in the second half of fiscal 2025. Recent Japanese economic data supports this hawkish stance, with rising wages and household spending providing a solid foundation for further rate hikes.
Technical analysis of USD/JPY
On the H4 chart, USD/JPY formed a consolidation range around 151.90 after a downward move. A break below this range is expected, targeting 148.80, with a potential continuation to 148.38. This level serves as a local target. Once the wave completes, a corrective move towards 151.90 is possible before the broader downtrend resumes, aiming for 145.50. The MACD indicator confirms this scenario, with its signal line below zero and sharply downwards, suggesting ongoing bearish momentum.
On the H1 chart, the market is developing a downward wave towards 148.40, with consolidation around 151.90. A downside breakout would confirm the continuation of the second phase of the decline. After reaching 148.40, a corrective move back to 151.90 could materialise. The Stochastic oscillator supports this outlook, with its signal line below 80 and sharply downward, indicating bearish pressure.
Conclusion
The Japanese yen’s rally has paused, but further gains remain likely, supported by expectations of continued BoJ tightening. Technical indicators suggest that USD/JPY may break lower towards 148.40, with further downside potential towards 145.50. The yen’s trajectory will depend on BoJ policy signals and further developments in US trade policy, particularly how global markets respond to Trump’s tariffs.
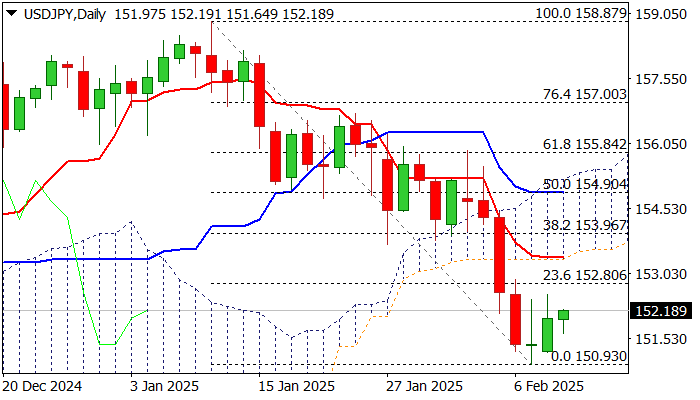
USD/JPY: Bears Taking a Breather Ahead of Key US Events
USDJPY remains constructive and ticks higher on Tuesday, on surprise slowdown in safe haven demand after President Trump imposed new set of tariffs on imports of metals.
Also, investors are taking a breather ahead of today’s testimony of Fed Chair Powell and Wednesday’s release of US inflation report for January, which should provide more details about inflation and further steps of the central bank on monetary policy.
Short term downtrend from 2025 peak at 158.87 (Jan 10) has found a footstep at the zone of important Fibo support (38.2% of 139.57/158.87 at 151.50), where a temporary base is forming.
Current bounce so far looks like a mild correction as daily studies are bearish, with recovery attempts facing strong resistances at 152.77 (converged 100/200DMA’s) and 153.40 (base of daily Ichimoku cloud, reinforced by daily Tenkan-sen).
Broader bears are expected to remain in play while these levels cap recovery and keep in play risk of fresh weakness, with sustained break of 151.50 (Fibo) and 150.93 (last week’s low) to signal bearish continuation.
Last week’s large bearish weekly candle additionally weighs, as the pair was in red for the four consecutive weeks and the action accelerated last week.
Res: 152.77; 153.40; 153.96; 154.90.
Sup: 151.50; 150.93; 150.00; 149.22.
Australian Dollar Drifting after Mixed Confidence Data
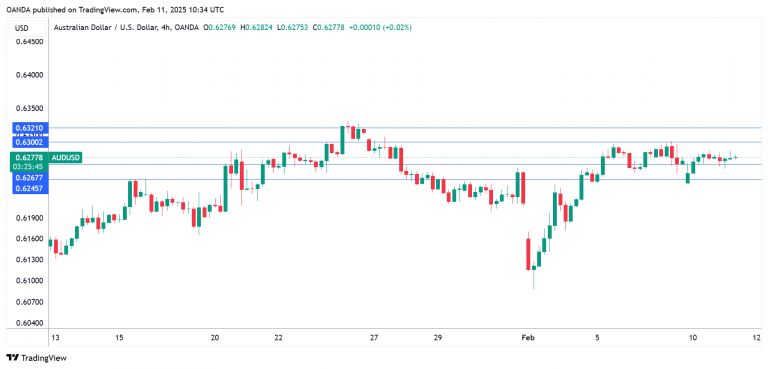
The Australian dollar is showing little movement on Tuesday. In the European session, AUD/USD is trading at 0.6279, up 0.05% on the day.
Australian business confidence jumps, consumer confidence stagnant
Australian confidence indicators were mixed on Tuesday. The Westpac consumer sentiment index climbed 0.1% in February to 92.2 points, which means a majority of the surveyed consumers were pessimistic about econmic conditions. The reading bounced back from a 0.7% decline in January but was shy of the forecast of 0.4%. Consumer confidence remains weak as consumers have been squeezed by high inflation and elevated interest rates. The survey noted that consumers have become more confident that the central bank will lower rates.
The National Australia Bank’s (NAB) business confidence index, which rose 6 points in January to +4. However, business conditions index dropped to +3 from +6 a month earlier, as profitability and employment weakened. The NAB survey noted that retail spending has improved and this trend would need to continue if business conditions were to improve.
The mixed confidence numbers come just one week before a crucial Reserve Bank of Australia meeting. A rate cut is virtually certain at the meeting, which would mark the RBA’s first rate cut since Nov. 2020. The RBA is yet to join the easing cycle which other major central banks have implemented as inflation has fallen.
The Federal Reserve is widely expected to continue to maintain interest rates at the March meeting. The US economy remains robust and the labor market has slowed gradually, which means there isn’t much pressure on Fed policy makers to lower rates in the coming months. Barring unexpected economic news, the Fed is expected to cut rates no more than one or two times in 2025.
AUD/USD technical
- AUD/USD tested support at 0.6267 earlier. Below, there is support at 0.6245
- There is resistance at 0.6299 and 0.6321.
Swing & Intraday Analysis: Key Levels for Trading AUDUSD
Fundamental Analysis:
The Reserve Bank of Australia will meet on February 17 and 18, and a rate cut is expected as recent inflation data shows that inflation is approaching the RBA's target faster than previously anticipated. This scenario puts pressure on the AUD as the Fed is not considering rate cuts in the short term, which will continue to support USD buying.
Technical Analysis
AUDUSD, Daily
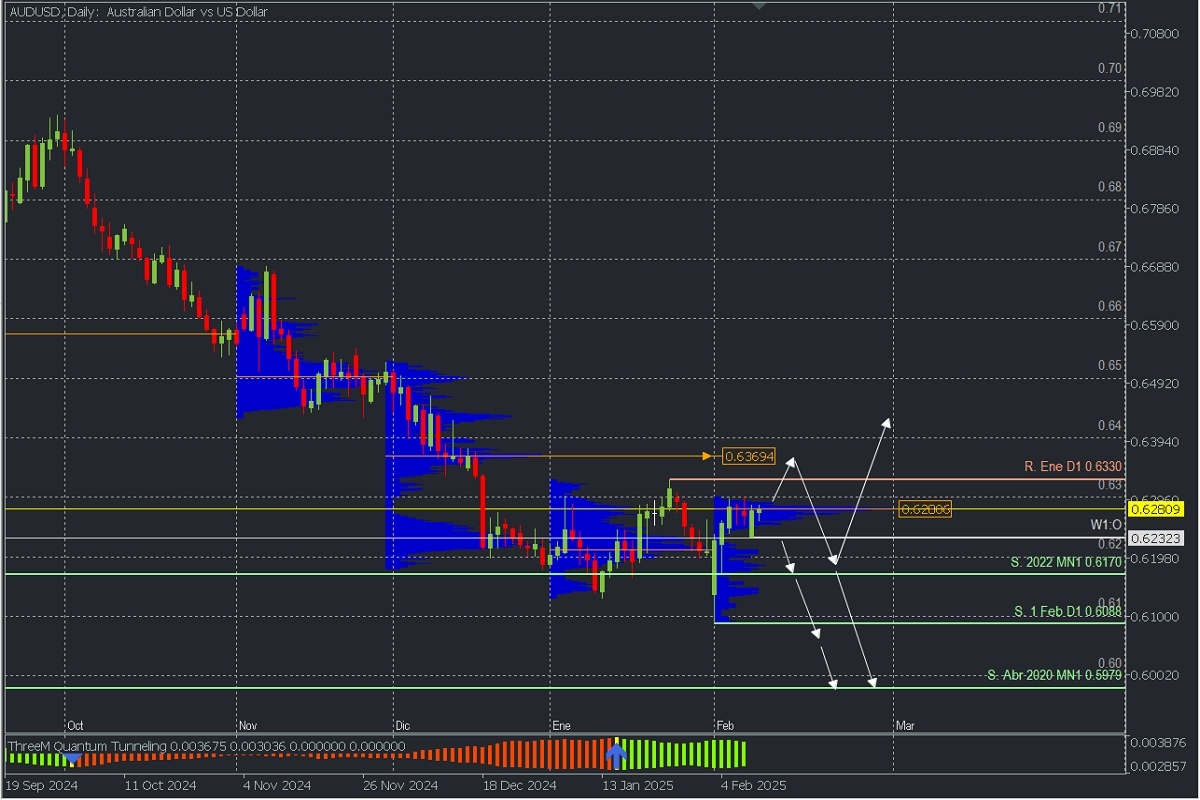
- Supply Zones (Sell): 0.6369 and 0.6280
- Demand Zones (Buy): 0.66
After breaking the 2022 support, the price is now at levels seen in April 2020, leaving daily support at 0.6088, which triggered the January high at 0.6330 as the last validated daily resistance. The current consolidation and correction are developing a volume concentration for February (not fixed until the month ends) around 0.6280, a potential supply zone that could trigger bearish activity early and renew selling towards 0.61 or the 2020 lows. This scenario will remain valid if the price does not break above this zone and the key resistance from January.
On the other hand, the potential rebound from the first break of the January resistance targets the macro supply zone in December around 0.6369, which is expected to be defended by bears to drive sales towards 0.62 at least, from where a bullish reversal or further bearish continuation will be assessed. The bearish continuation should break the 0.6088 support.
AUDUSD, H2
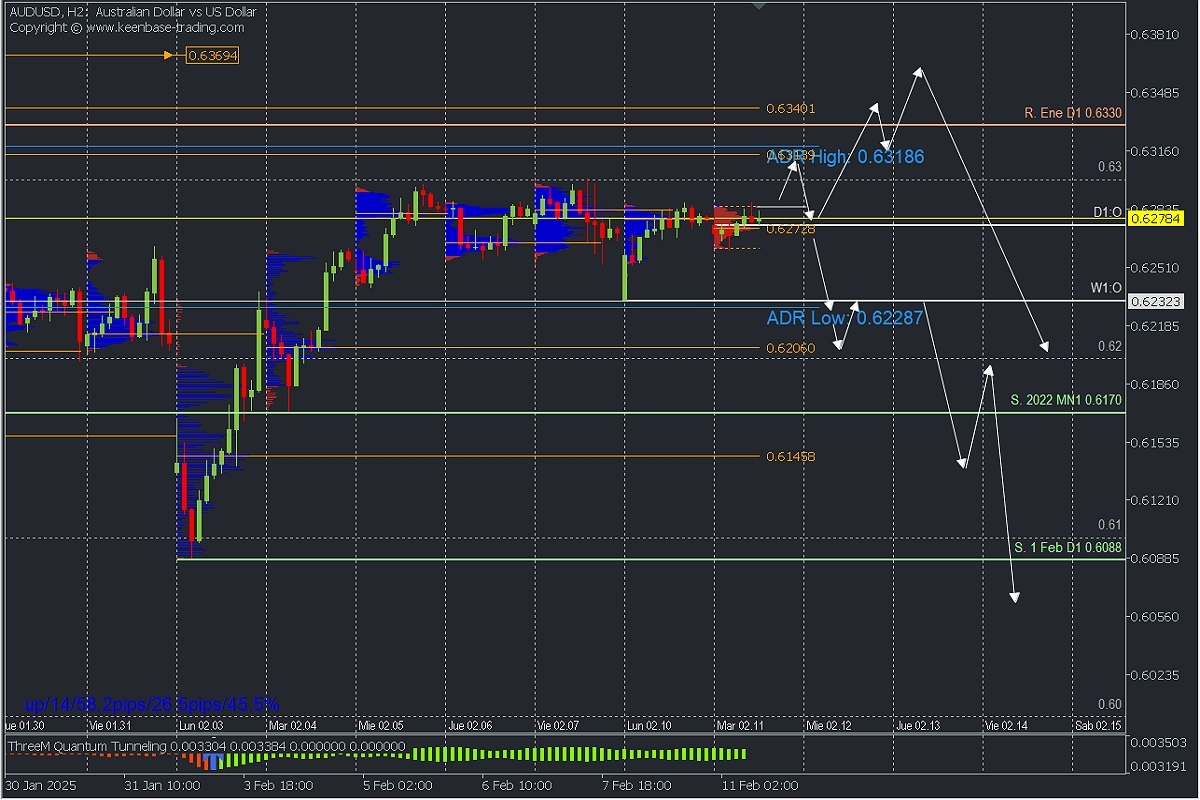
- Supply Zones (Sell): 0.6313, 0.6340, and 0.6369
- Demand Zones (Buy): 0.6272, 0.6206, and 0.6145
On an intraday basis, the price has consolidated for the fifth consecutive day below 0.63, with the last validated support at 0.6170. This implies that the correction will continue with an upward bias as long as this level is not broken.
In this sense, buying has struggled to break above the POC from the early sessions at 0.6272, but if we see a move above 0.6287, a rally towards the supply zone around 0.6318 is expected, where there is an uncovered POC and the average bullish range.
On the other hand, if the price drops below 0.6272, we do not rule out selling towards the weekly open (W1:O) at 0.6232 and, more extended, the uncovered POC at 0.6206, with potential for bearish continuation.
Technical Summary:
- Corrective Bullish Scenario: Buy above 0.6287 with targets at 0.63, 0.6318, and potentially 0.6340
- Bearish Continuation Scenario: Sell below 0.6272 with targets at 0.6232, 0.62, 0.6170, and 0.6145.
Always wait for the formation and confirmation of an *Exhaustion/Reversal Pattern (PAR) on M5, like the ones we teach here https://t.me/spanishfbs/2258 before entering any trades in the key zones we indicate.
*Uncovered POC: POC = Point of Control: It is the level or zone where the highest volume concentration occurred. If there was a bearish movement from this point, it is considered a sell zone and forms a resistance area. Conversely, if there was a bullish impulse, it is considered a buy zone, usually located at lows, thus forming support zones.
Crypto Market Stays Near the Lower Boundary
Market Overview
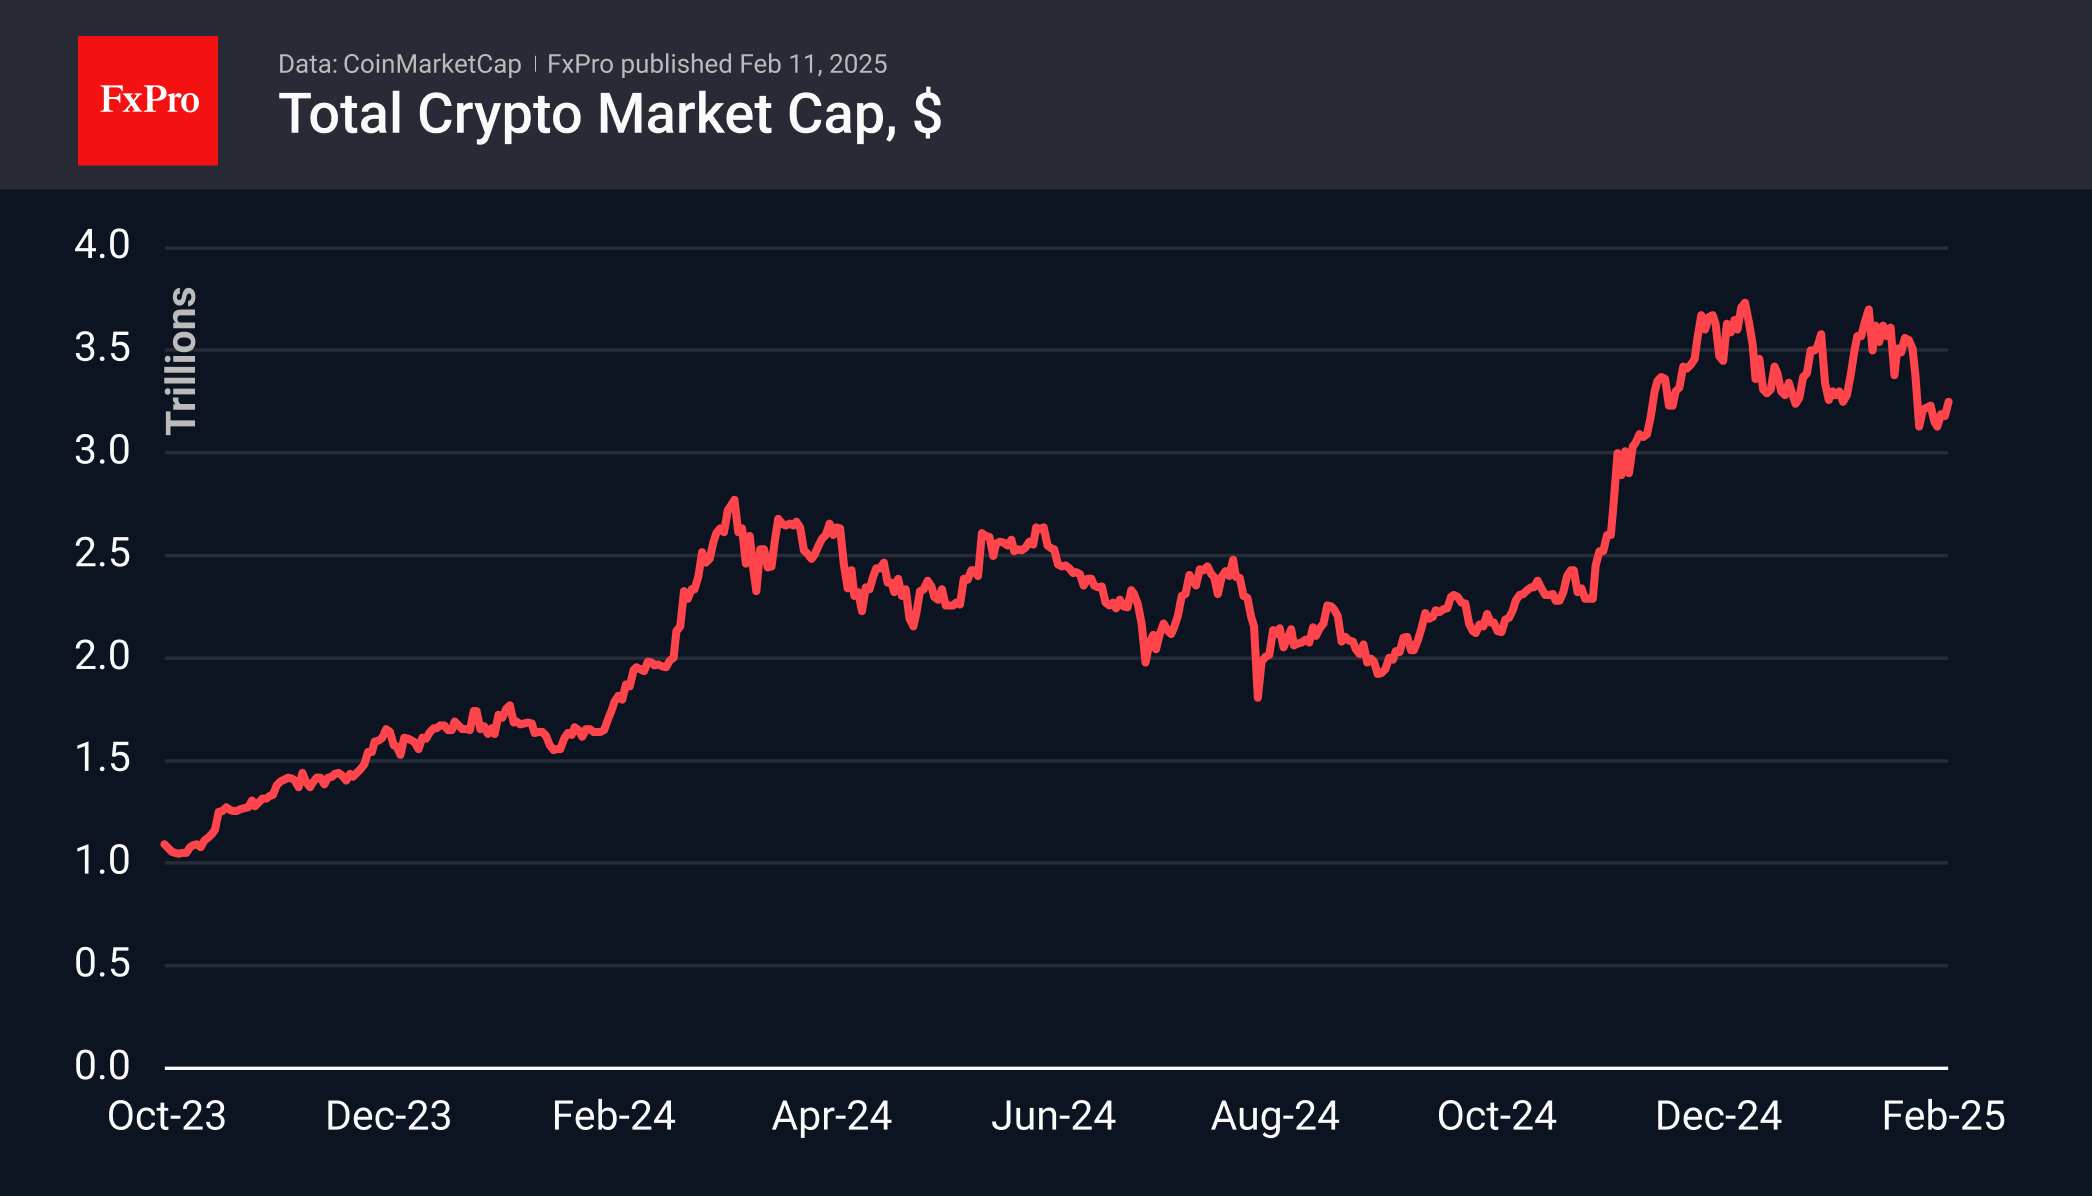
The total capitalisation of cryptocurrencies increased by 2.5% over the last 24 hours, moving away from the lower boundary of the local range. However, at $3.25 trillion, the market remains nearly unchanged from the previous week. Despite record highs in gold and European stocks, along with strong performance in U.S. securities, cryptocurrencies remain out of favour with buyers.
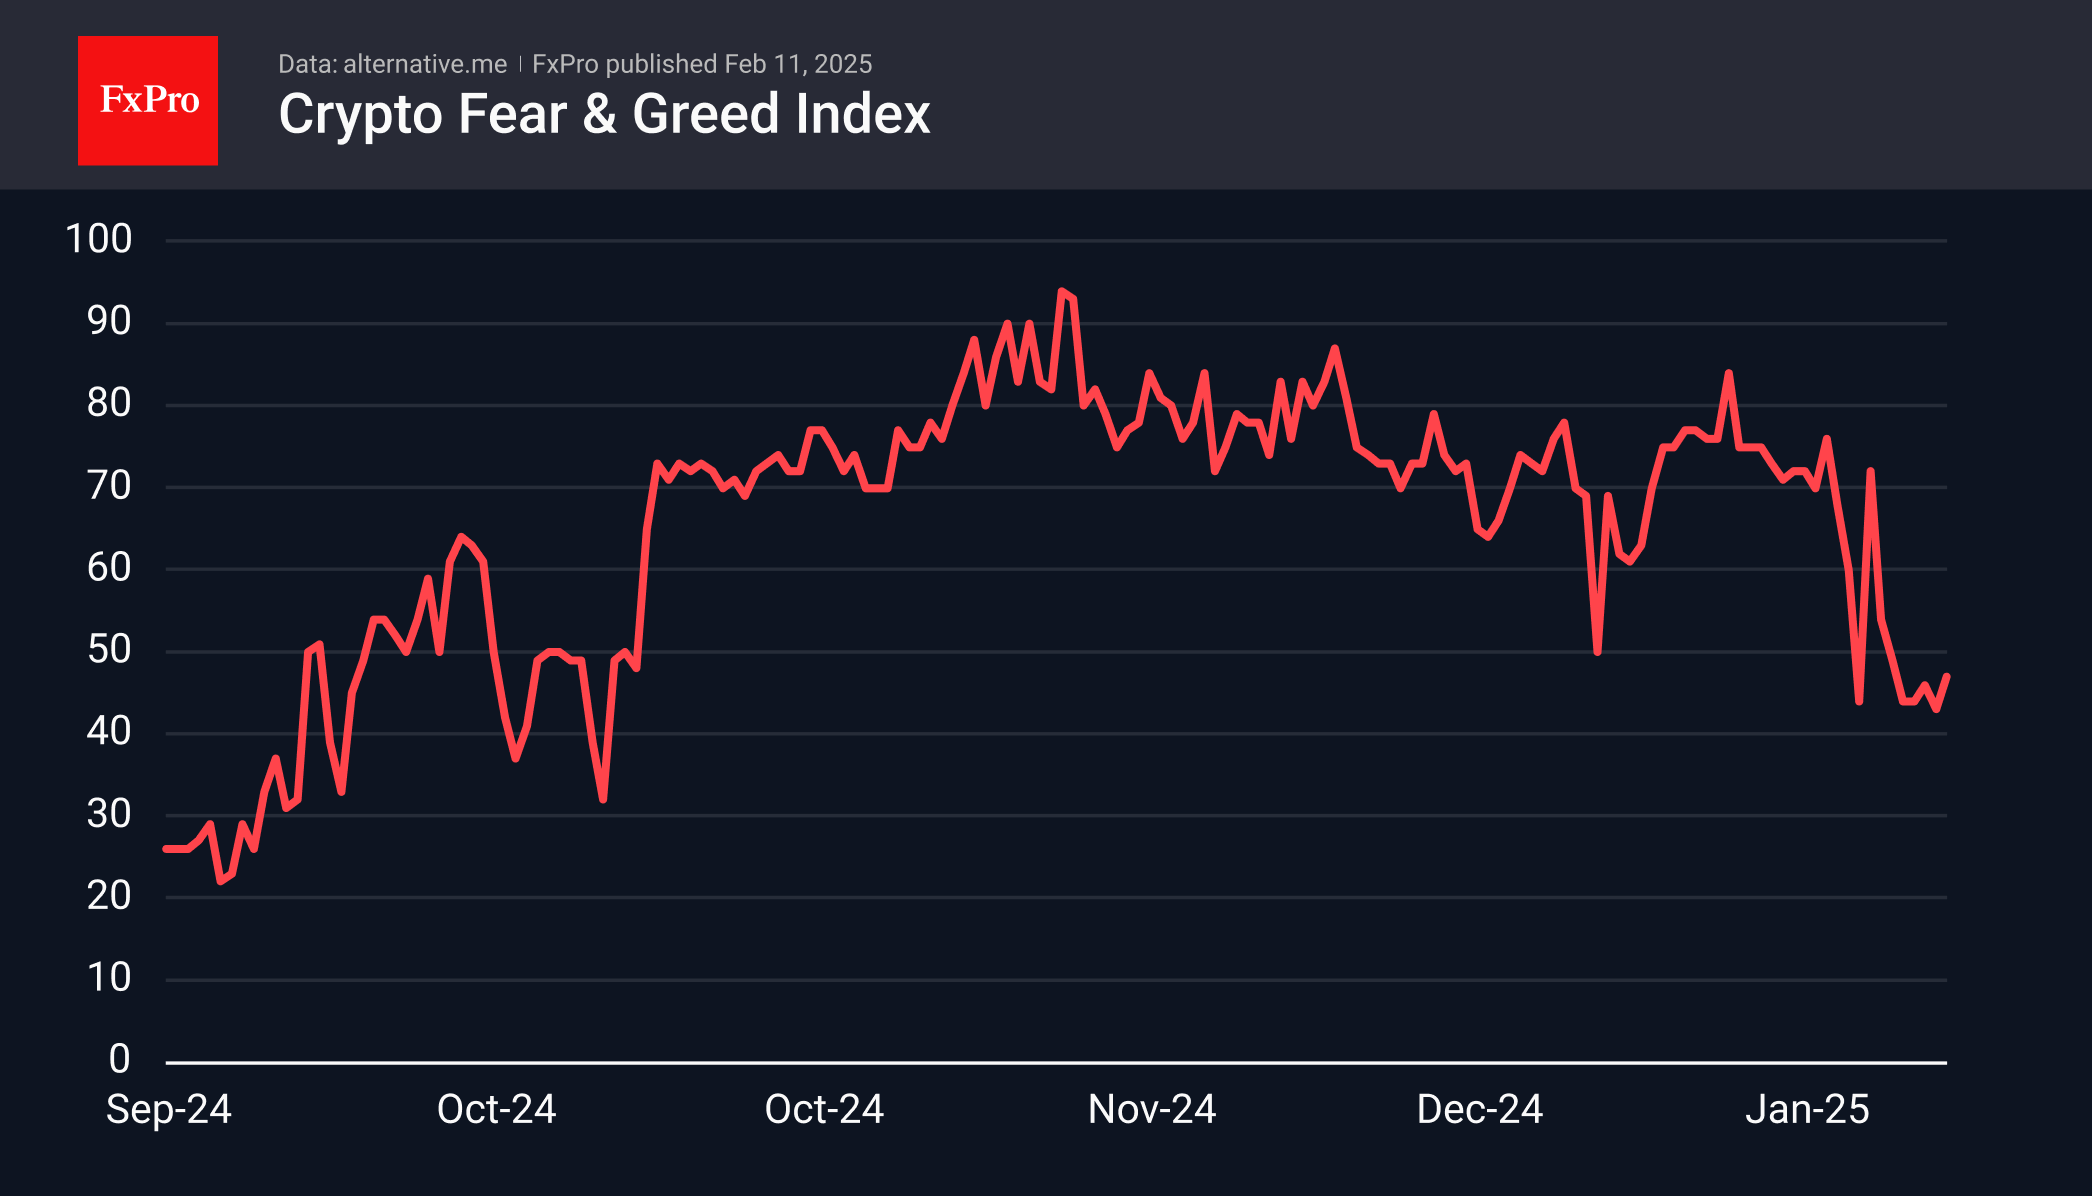
The cryptocurrency fear index was on the borderline between fear and neutral sentiment. There has been no quick recovery, and the lack of a dip in the fear zone has deterred some buyers from being active.
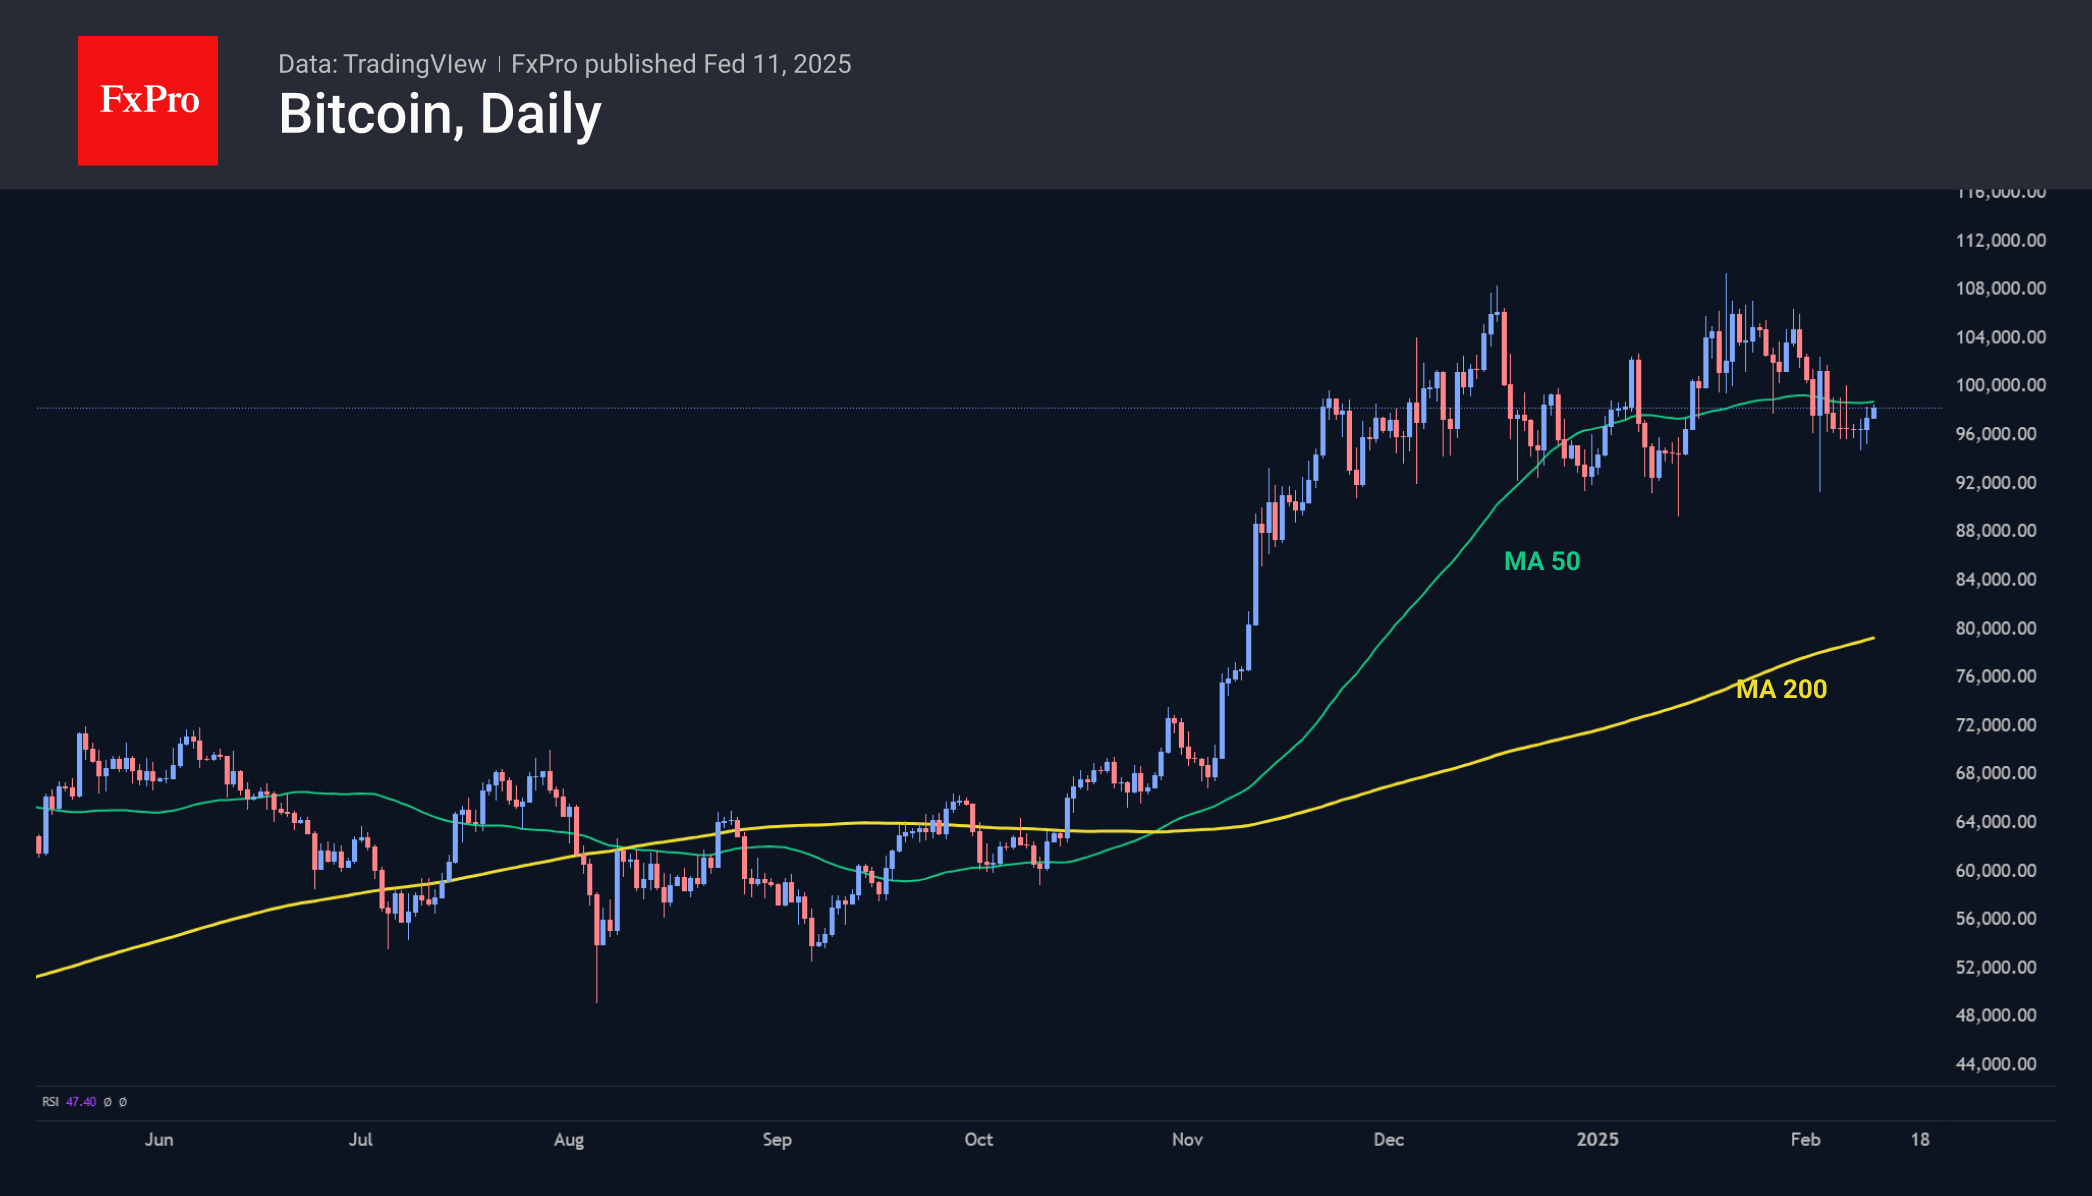
Bitcoin has traded below its 50-day moving average since early February and has stopped rising since mid-December, remaining within a long correction. A fall below 92,500 could trigger a deeper sell-off. However, given the positivity in other markets, there are signs that the decline is attracting new buyers.
News Background
According to CoinShares, global investment in crypto funds more than doubled last week to $1.26bn, with Bitcoin investments up $407m, Ethereum up a significant $793m, XRP up $21m, Solana up $11m, and Sui up $4m.
Ethereum took centre stage last week as its price dropped to nearly $2,100, prompting significant buying, according to CoinShares.
Tiger21 founder Michael Sonnenfeld said Bitcoin has become a capital preservation tool for wealthy investors. Among his network of ultra-wealthy investors, BTC holdings typically range from 1% to 3% of their portfolios. In the latest adjustment, Bitcoin’s mining difficulty rose by 5.61%, hitting a record high of 114.17T. Just two weeks ago, it saw its first decline since September 2024, driven by a cold snap in the U.S.
The Nasdaq exchange filed Form 19b-4 with the SEC to launch spot ETFs from CoinShares based on XRP and Litecoin. With the new instruments, the European issuing firm will expand its presence in the US market amid an expected softening regulatory environment.
GBP/USD Bears Regain Control
- GBP/USD returns to bearish territory after rejection from 1.2500.
- A move below 1.2350 could renew downside pressures.
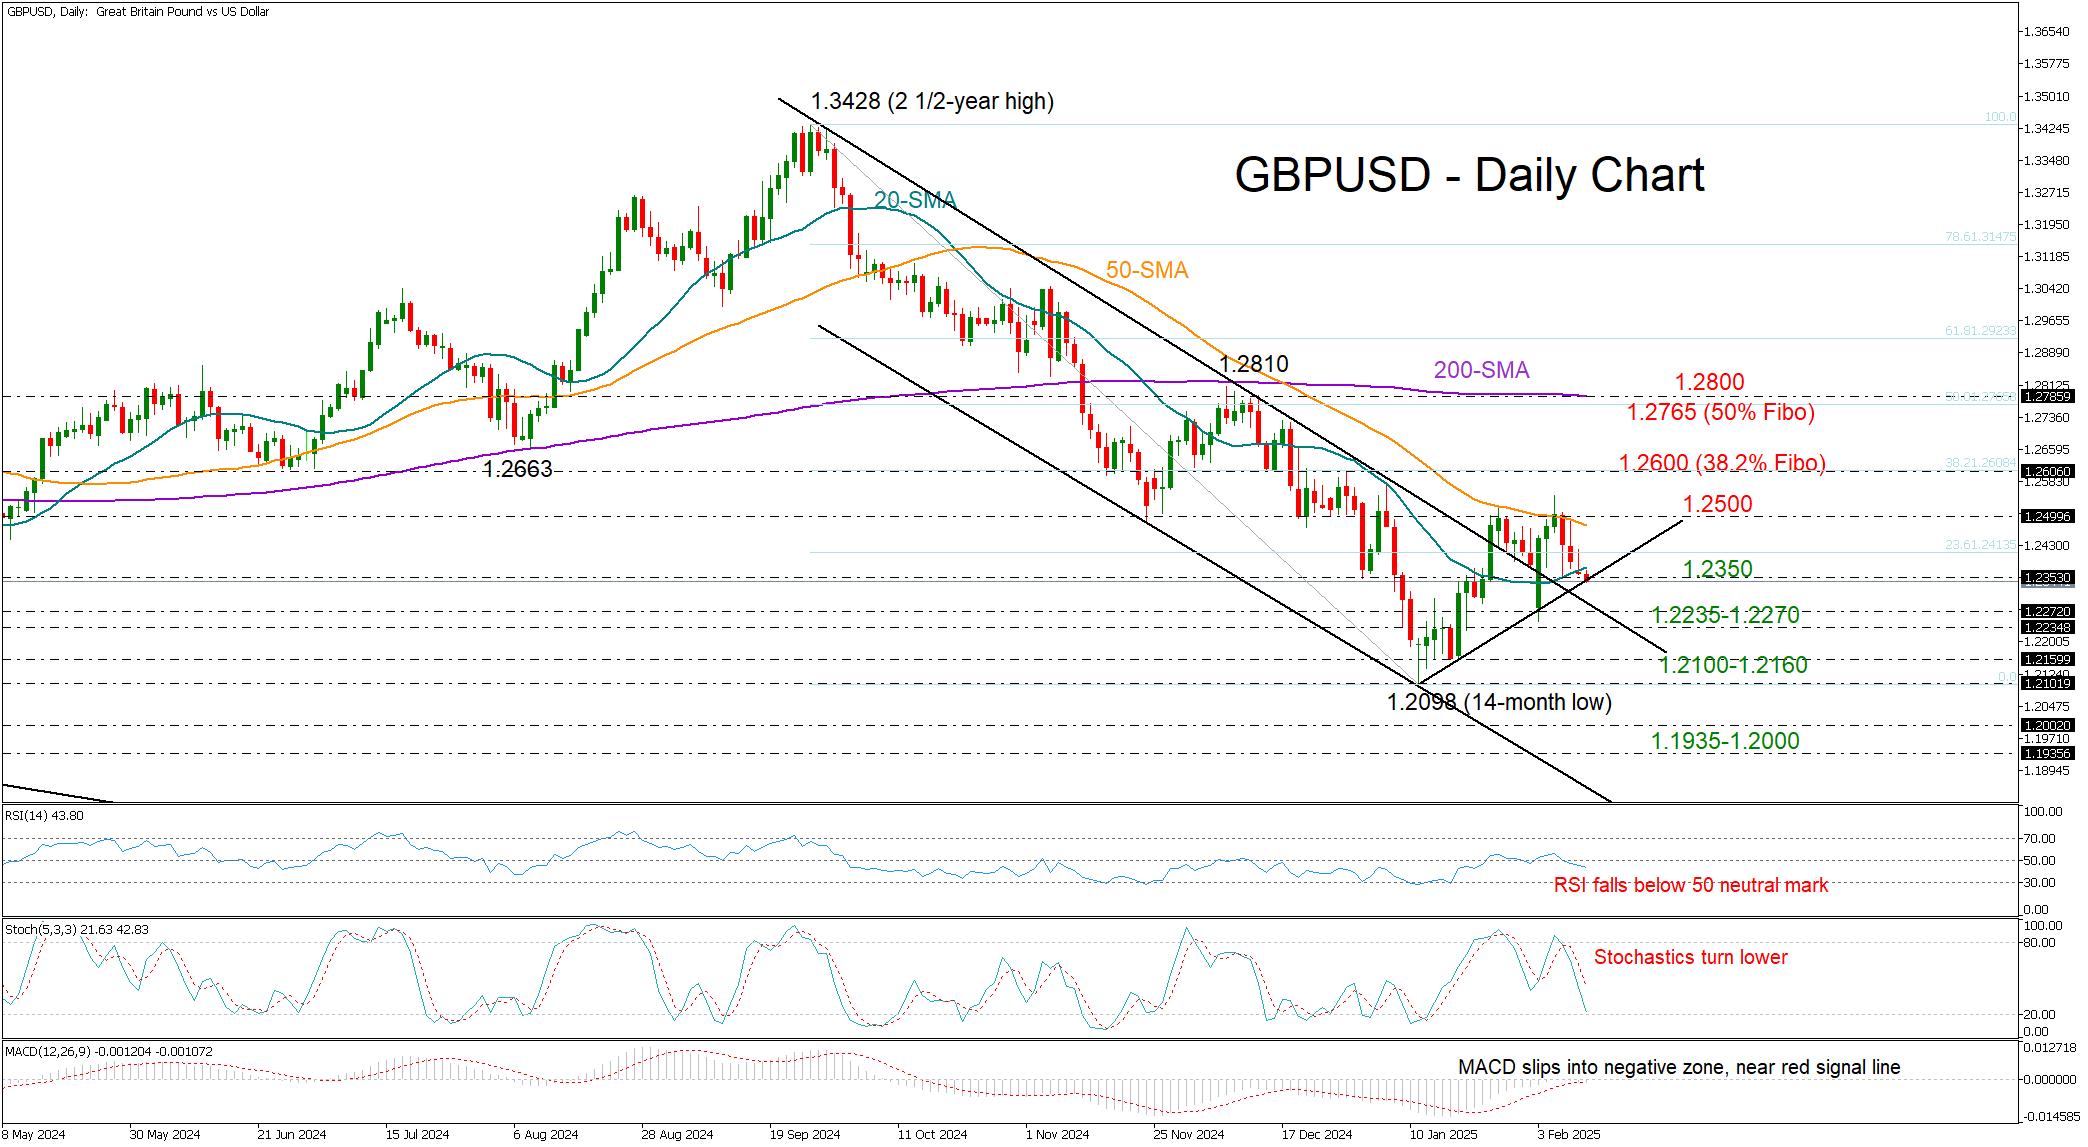
GBPUSD has taken a negative turn again after its strong bullish start to the month failed to break above the 1.2500 resistance and the 50-day simple moving average (SMA). The pair couldn't sustain levels above its 20-day SMA on Monday and is currently seeking support from a short-term trendline at 1.2350. With technical signals leaning to the bearish side, a continuation lower seems more likely as the Fed chief is heading to Capitol Hill for a two-day testimony.
Additional losses could initially pause within the 1.2235-1.2270 constraining zone. If selling interest persists, the price could challenge the bottom of its September-December downtrend at 1.2100-1.2160. Failure to pivot there could spark a decline towards the 1.2000 psychological level, with the 1.1935 territory, last seen in February-March 2023, also coming into sight.
Conversely, if the pair establishes a strong foothold near 1.2350 and climbs back above its 20-day SMA, it may stage another battle between its 50-day SMA and the 1.2500 barrier. A victory there could clear the way towards the 38.2% Fibonacci retracement of the September-December downtrend of 1.2600. A steeper rally could target the 50% Fibonacci level and the 200-day SMA within the 1.2765-1.2800 area.
In summary, GBPUSD is facing a bearish short-term outlook, with sellers waiting for a close below 1.2350 to target lower levels.
SPX Reacting Higher From Extreme Equal Legs Area
In this technical blog, we will look at the past performance of the 1-hour Elliott Wave Charts of SPX. We presented to members at the elliottwave-forecast. In which, the rally from 13 January 2025 unfolded as an impulse structure. And showed a higher high sequence favored more upside extension to take place. Therefore, we advised members not to sell the index & buy the pullback in 3, 7, or 11 swings. Based on Elliott wave hedging area looking to get 3 wave reaction higher at least. We will explain the structure & forecast below:
SPX 1-Hour Elliott Wave Chart From 2.01.2025
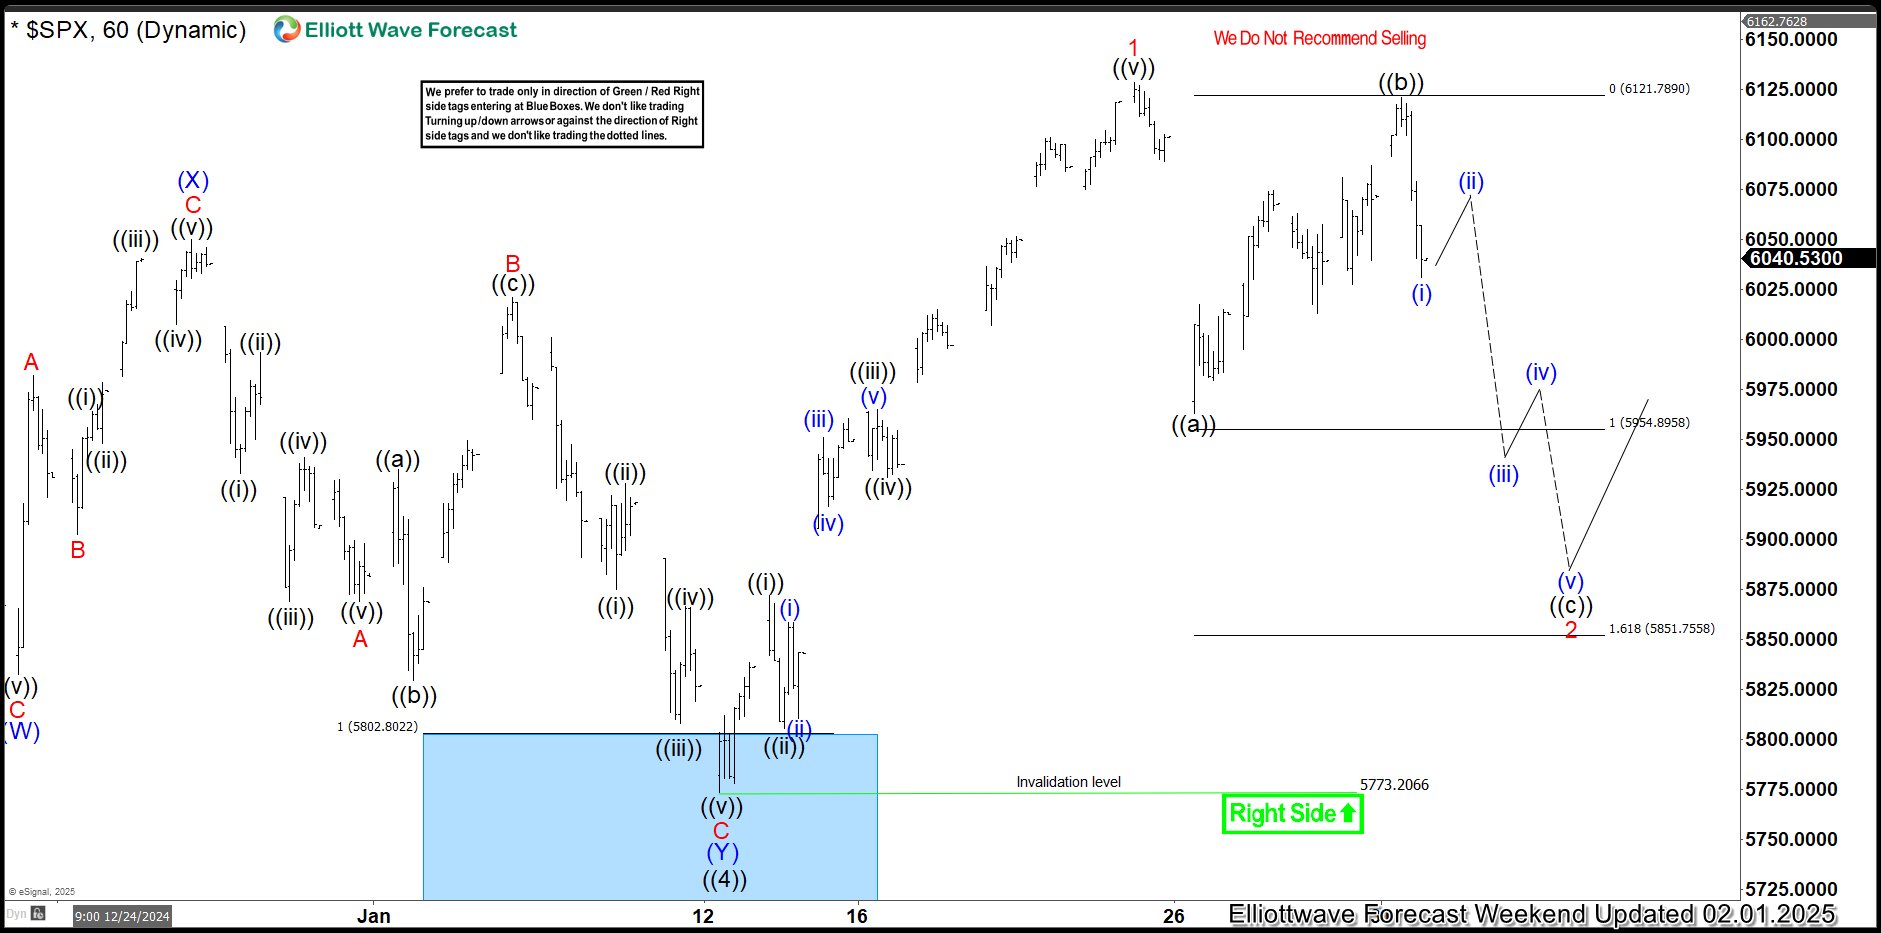
Here’s the 1-hour Elliott wave chart from the 2.01.2025 update. In which, the cycle from the 13 January low ended in wave 1 as an impulse structure at $6128.18 high. Down from there, the index made a pullback in wave 2 to correct that cycle. The internals of that pullback unfolded as Elliott wave zigzag structure where wave ((a)) ended at $5962.92 high. Then wave ((b)) bounce ended at $6120.91 high and wave ((c)) was expected to reach the Elliott wave hedging area at $5954.89- $5851.75 area. From there, buyers were expected to appear looking for next extension higher or do a 3 wave reaction higher at least.
SPX Latest 1-Hour Elliott Wave Chart From 2.11.2025
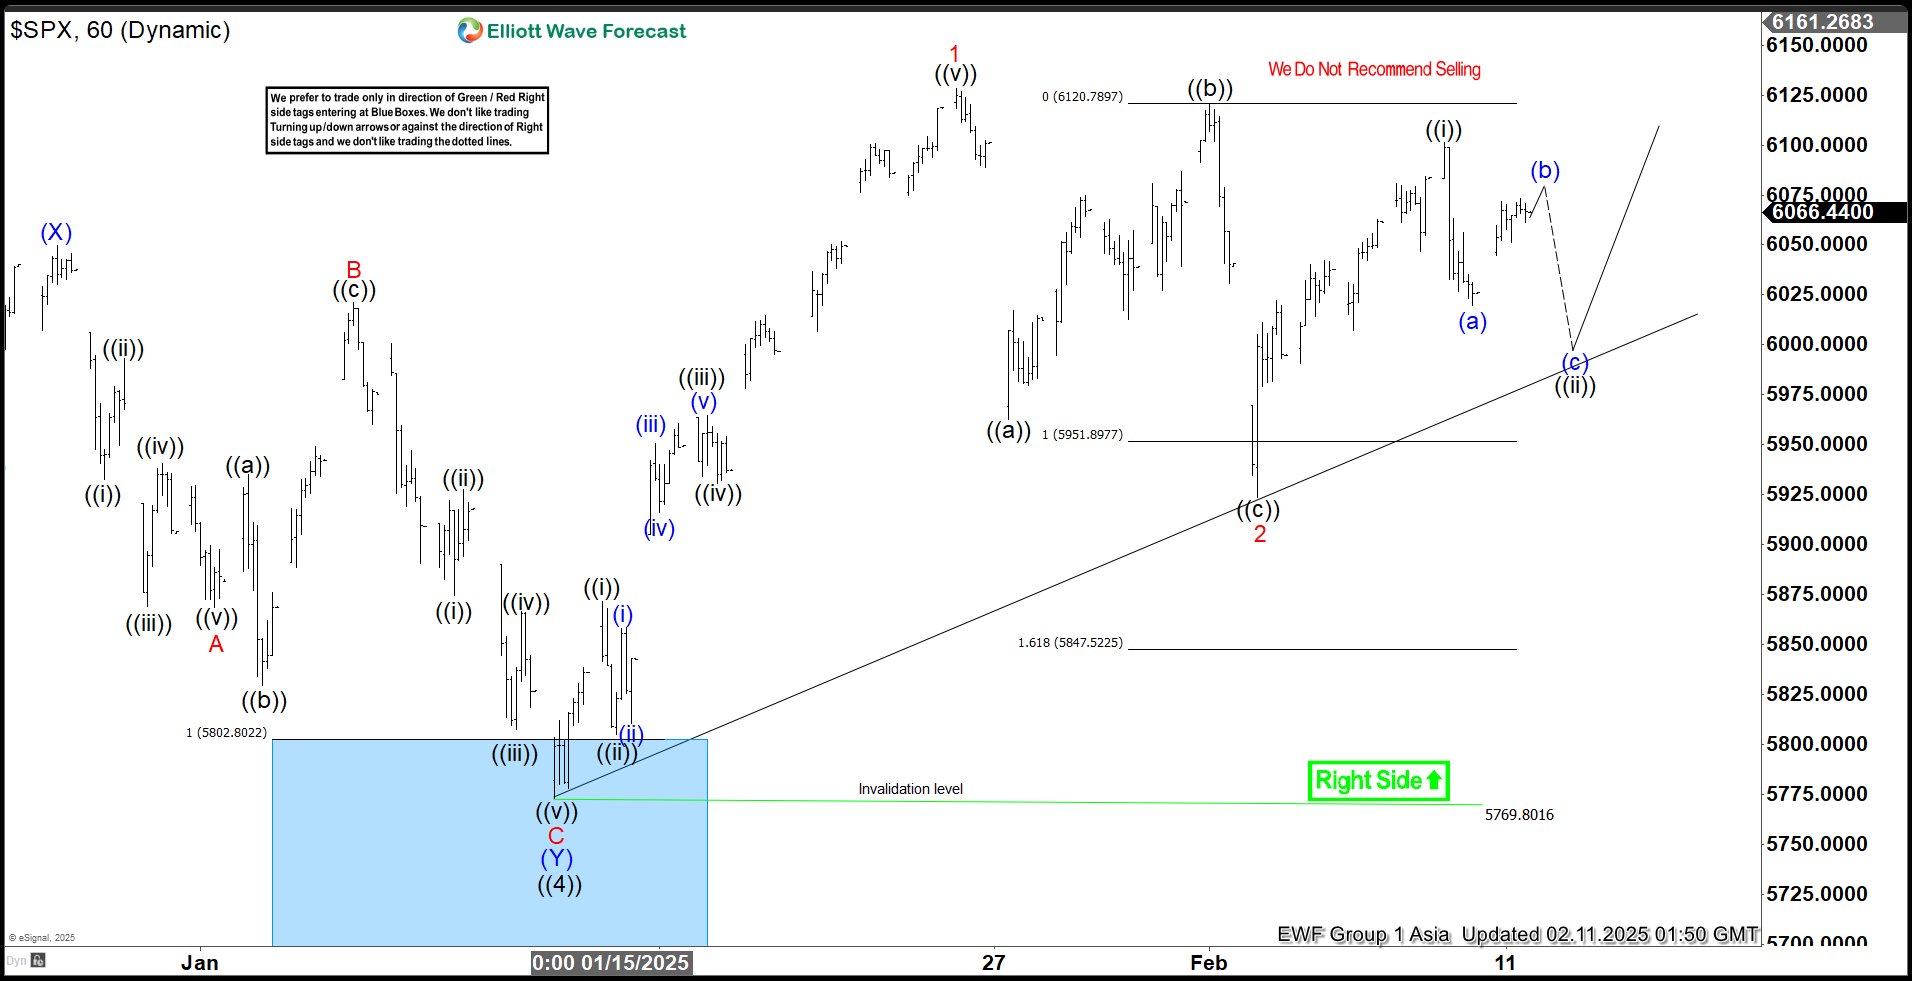
This is the latest 1-hour Elliott wave Chart from 2.11.2025 Asia update. In which the SPX is showing a strong reaction higher taking place, right after ending the zigzag correction within the equal legs area. Allowed members to create a risk-free position shortly after taking the long position. However, a break above $6128.18 high is needed to confirm the next extension higher & avoid double correction lower.
How Trump Influences Bitcoin’s Price
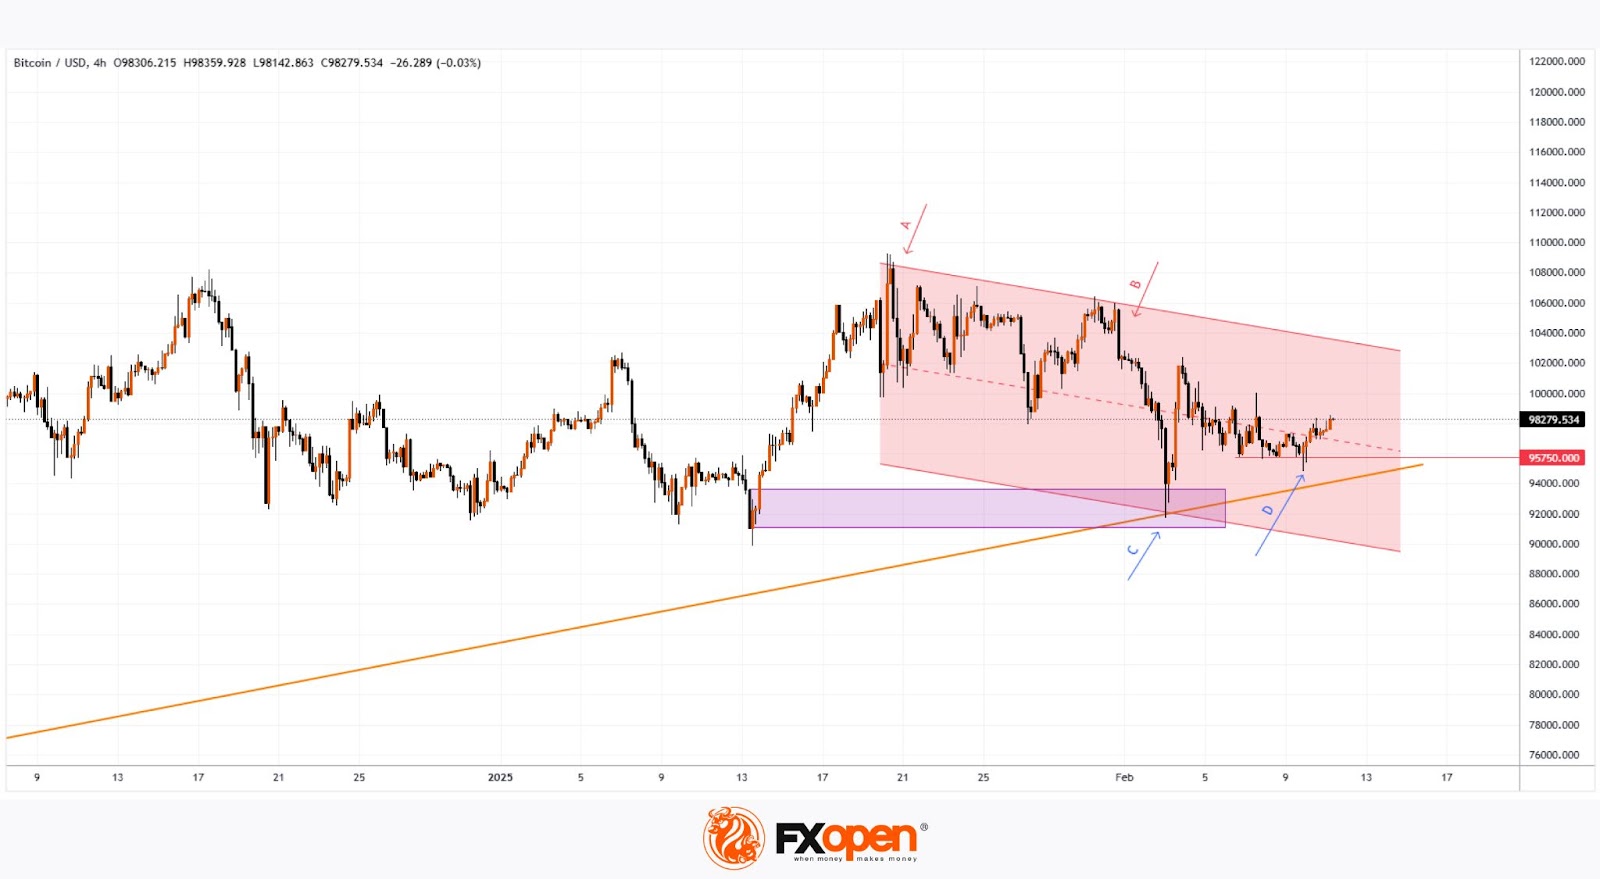
In a previous analysis of the BTC/USD chart titled "Bitcoin Holds Above $100K. For Now?", we hinted at the cryptocurrency market’s vulnerability to a downturn following heightened volatility triggered by Trump’s inauguration (Arrow A).
The BTC/USD chart shows that after this event:
→ B: Bitcoin’s price saw a sharp decline after Trump imposed high tariffs on Canada, China, and Mexico. Financial markets reacted with shock, causing BTC/USD to drop over 12% in just two days, leading to the largest liquidation event in cryptocurrency history.
→ C: Bitcoin later recovered as Trump delayed tariffs on Mexico and China. Additionally, market sentiment improved after the U.S. president announced plans to establish a sovereign wealth fund within a year. Forbes speculated that this fund could potentially be used by the U.S. government to acquire Bitcoin.
BTC/USD Technical Analysis
Bitcoin’s price movements indicate a bearish trend, highlighted by the red descending channel. However, signs of buying activity could offer hope to market participants:
→ A test of the Order Block (marked in purple).
→ February’s low may serve as a key support trendline (marked in orange), originating in 2024.
→ D: Bears failed to sustain the decline after breaking below the 95,750 level.
FXOpen offers the world's most popular cryptocurrency CFDs*, including Bitcoin and Ethereum. Floating spreads, 1:2 leverage — at your service. Open your trading account now or learn more about crypto CFD trading with FXOpen.
*Important: At FXOpen UK, Cryptocurrency trading via CFDs is only available to our Professional clients. They are not available for trading by Retail clients. To find out more information about how this may affect you, please get in touch with our team.
This article represents the opinion of the Companies operating under the FXOpen brand only. It is not to be construed as an offer, solicitation, or recommendation with respect to products and services provided by the Companies operating under the FXOpen brand, nor is it to be considered financial advice.
Potential Fallout of tariffs’ Flood Will Continue to Dominate Headlines Today
Markets
Yesterday US president Trump’s ‘announcement policy’ on tariffs continued to dominate market headlines as the president indicated that he was preparing broad-based tariffs of 25% on steel and aluminum. This could only be seen as a next step in the trade war escalation, with potentially ever growing side effects/fall-out both inside and outside the US. Still, the impact on markets remained limited. Whas it because the lack of concrete details yet? Was it market fatigue? At least the issue of a lack of details was (partially) ‘solved’ overnight. Trump ordered the tariffs to take effect next month and to apply to both metals, but the action will also be extended to downstream products. Trump also signaled tariffs on countries that have put levies on US goods. Cars and semiconductors are also on the administration’s radar for potential tariffs. As said, at least yesterday, markets just stood by and watched. US yields maintained their post-payrolls rise, changing 1-2 bps across the curve. The German yield curve steepened slightly (-2.2 bps 2-y; -0.6 bps 30-y). Chair Lagarde in an address before the EU Parliament repeated the message from the January policy meeting that disinflation is on track. Equities also still weren’t bothered by the flaring up of the tariffs rhetoric. US indices gained up to 0.98% (Nasdaq). The Eurostoxx 50 added 0.62%. The dollar gained modestly (Close DXY 108.3, EUR/USD 1.031).
Overnight, an interview of BoE MPC member Catherine Mann in the FT catches the eye. In the past, Mann of was seen as belonging to the hawkish camp, but last week she dissented in favour a 50 bps rate cut as she sees a weaking jobs market and slowing consumer demand dampening businesses pricing power. A 50 bps cut would have been a clear sign according to Mann that easier financial conditions are needed. Sterling this morning weakens slightly further to EUR/GBP 0.8335.
The potential fallout of the tariffs’ flood for sure will continue to dominate the headlines today. Still the impact on markets this morning remains very orderly. Asian equities are trading mixed to mostly modestly lower, as do US and European equity futures. The dollar also shows no clear trend (EUR/USD 1.0305, DXY 108.3). The eco data calendar in the US and Europe today still only contains second tier data. US NFIB small business sentiment won’t be a big issue for markets, but might be a pointer for sentiment in the domestic-oriented part of the economy. Fed’s Powell testifies before the Senate. He probably will sticks to the assessment of the January Fed meeting that a solid US economy/labour market and still too elevated inflation are a good reason for the Fed to wait and see upcoming developments. The US Treasury will sell $58 bln of 3-y notes tonight. After Friday’s post-payrolls rebound, the downside in US yields looks well protected. The dollar maybe still enjoys some ‘by default’ bid due to lingering uncertainty on global trade. Even so, for now this is not enough to break any important resistance levels.
News & Views
The Financial Times reports on an EU paper it has seen in which the EC plans for a radical budget overhaul for the next common budget (starting 2028). They call for a more ambitious budget in size and design to meet spending demands on defense and debt repayments. The commission is also looking to revolutionise the budget’s structure, bringing over 50 rigid spending programmes together into three main funds to provide more flexibility. A simplified budget would agree on a single plan for each country with key reforms and investments, giving national governments a bigger say in deciding projects. The creation of a European competitiveness fund to boost investment in key sectors and common projects and a revamped fund for foreign policy, to align strategic interests are the other pillars.
The British Retail Consortium said that retail spending accelerated at the start of 2025 following a disappointing 2024. Total sales were 2.6% Y/Y higher in January, down from +3.2% in December but significantly above last year’s 0.8% average. Details showed both food (+2.8% Y/Y) and non-food sales (+2.5% Y/Y) rising. Demand was solid even as the comparison base was rather low and as bouts of story weather put a temporary dampened on demand. BRC chief executive Dickinson warns though that retailers faced £7bn of extra costs later this year because of rising minimum wages, a new packaging levy and especially higher employer social security contributions: “many businesses will be left with little choice but to increase prices, and cut investment in jobs and stores".