
Sample Category Title
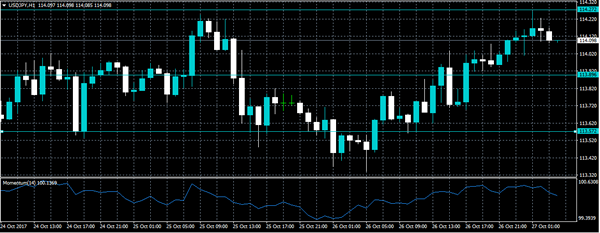
USDJPY Still Bullish Above 113.89
The U.S dollar continues to make higher daily price-highs against the Japanese Yen, with buyers pushing the USDJPY pair to 114.27 during today's Asian trading session. Global stock markets continue to move to record levels, which is helping to underpin investor's appetite for the USDJPY. The pair currently trades around the 114.10 level, ahead of the start of the European trading session.
The USDJPY pair remains bullish while trading above the 113.89 technical level. Further buying can be expected towards the 114.27 and 114.50 levels while price-action holds above 113.89.
Should the USDJPY decline below the 113.89 level for a sustained period, a further decline towards 113.57 and 113.23 levels should be expected.
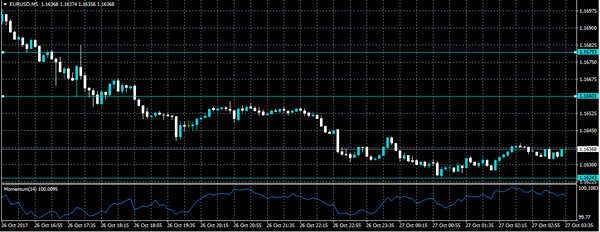
EURO Strongly Bearish Below 1.1660
The euro fell sharply against the U.S dollar, hitting 1.1624, following a more dovish than expected monetary policy statement from the European Central Bank. The euro sunk over 1.4 percent, as the ECB announced that they had a preference for open-ended quantitative easing. At present, the EURUSD pair trades around the 1.1638 level, ahead of the upcoming release of third fiscal quarter GDP figures from the U.S economy.
The EURUSD pair remains strongly bearish while trading below the 1.1660 technical levels. Further declines towards 1.1610 and 1.1580 should be expected while below this level.
Should intraday EURUSD buyers push price-action back above the 1.1660 level, the euro will likely move to test the 1.1679 and 1.1713 levels.
Markets Buzzing Ahead Of US Q3 Data
The global financial markets were buzzing ahead of an active Friday session. Less than 24 hours earlier, the European Central Bank (ECB) announced major changes to its bond-purchase program in a move that caught some traders by surprise.
Europe will see a light release schedule on Friday, including a German report on import prices and a French release on consumer confidence. Spain will also issue September retail sales figures at 07:00 GMT.
ECB Governor Peter Praet is scheduled to deliver a speech at 07:15 GMT, with investors keen on understanding the central bank’s justification for its latest policy move.
In the United States, the Commerce Department will issue its preliminary third-quarter GDP report at 12:30 GMT. The estimate is expected to show quarterly growth of 2.5% year-over-year, following a gain of 3.1% in Q2 that was the biggest in years.
Later in the day, the University of Michigan will release the final consumer sentiment index for October.
Meanwhile, energy traders will be keeping close tabs on the weekly rig count courtesy of Baker Hughes Inc.
Earlier in the day, the Japanese government said national consumer prices rose 0.7% annually in September, unchanged from the previous month. So-called core inflation, which strips away volatile food prices, rose by a similar amount.
Core inflation in Tokyo also strengthened to 0.6% annually in October, from 0.5% the previous month.
USD/JPY
In-line Japanese inflation data failed to lift the yen, with the USD/JPY continuing well north of 114.00. The pair was last seen trading at 114.13, having gained 0.1% from the previous session. The greenback is currently riding three-month highs against a basket of currencies that includes the yen. The USD/JPY is pushing further into bullish territory, but analysts say initial upside is likely to be capped around 114.50. However, the pair has made impressive gains over the past two weeks, signaling the return of the dollar bulls.
EUR/USD
The euro came undone on Thursday after the ECB extended its bond-purchase program. The EUR/USD exchange rate has plunged nearly 200 pips as a result, with prices now hovering near 1.1640. The common currency is now eyeing support levels as low as 1.1360, which corresponds with the 200-DMA. The market has clearly broken to the downside as traders evaluate the ECB’s latest shift in policy.
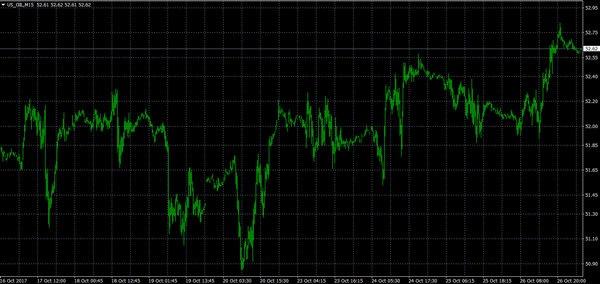
US OIL
Oil prices have been on a tear as of late, encouraged by supply-side optimism from the likes of OPEC. Saudi Arabia has signaled its preparedness to drain the supply glut well into 2018, helping crude prices recover to six-month highs. US oil prices are fast approaching $53 a barrel. The market appears primed for further upside, although the fundamentals could dictate short-term trends in investor appetite.
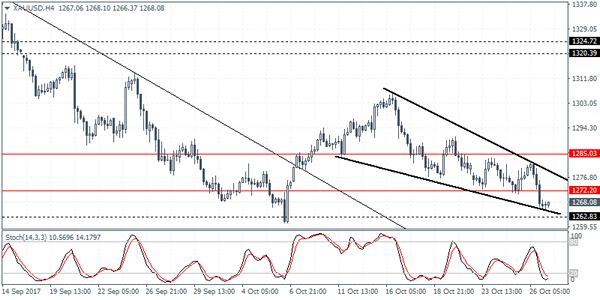
XAUUSD Intraday Analysis
XAUUSD (1268.08): Gold prices extended the declines yesterday as price closed below the 1272 level of support. Trading closer to the previous support established at 1262, gold prices could be at risk of further declines. However, price action could be seen pushing to the upside in the near term. A close above 1272 could signal an upside bias. This will validate the descending wedge pattern that has formed and could see gold prices rising towards the 1285.00 handle. Further gains are expected only above this level, but in the short term, price action is seen to remain range bound.
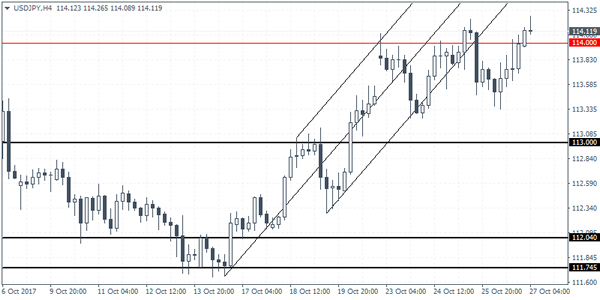
USDJPY Intraday Analysis
USDJPY (114.11): The USDJPY continues to consolidate within the ascending wedge pattern on the daily chart. Price action managed to reverse the intraday loses as the greenback closed higher on the day. With theprice at resistance, this level could be breached on a strong GDP print. Failure to do so could, however, increase the downside bias in the currency pair. On the 4-hour chart, theprice has managed to recover back to the previous resistance level near 114.00. However, a retest of 113.00 which serves as initial support is expected to be tested in the short term. Only a convincing close above 114.00 could see further gains in the currency pair.
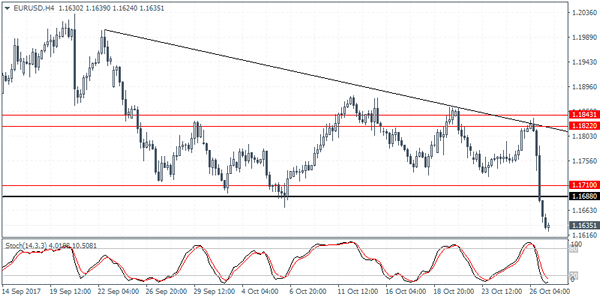
EURUSD Intraday Analysis
EURUSD (1.1635): The EURUSD declined strongly following the ECB meeting. The reversal came as EURUSD failed to break the resistance level near 1.1822 earlier in the day. Posting strong losses, EURUSD broke past the support level near 1.1710 - 1.1688. In the near term, we expect to see a possible pullback to this breached support level. If resistance can be established here, EURUSD could be seen declining to 1.1505 as the minimum downside target. This comes as price action has validated the descending triangle pattern.
Euro Slips As ECB Signals Tapering But Extends Bond Purchases By 9-Months
Investors sold the euro yesterday following the ECB's announcement of tapering its asset purchases to 30 billion euro a month starting January 2018 through September next year. The EURUSD fell over 1.4% on the day after investors saw that the ECB, despite tapering maintained a cautious stand.
The British pound was also seen coming under pressure as investor uncertainty grew on the prospects of a BoE rate hike next week. Thiscomes although the previously released GDP data was better than expected.
Looking ahead, the US preliminary GDP numbers will be coming out today. According to the economists polled, the US GDP is forecast to rise 2.5% on the quarter ending September. This comes after a 3.1% final revised GDP figures for the second quarter. However, various other estimates such as the Atlanta Fed's GDPNow and the NY Fed's Nowcast show a somewhat weaker GDP print.
Dollar Remains Supported Vs Yen Ahead Of US GDP
Key Highlights
- The US Dollar is placed nicely above the 113.20 support area against the Japanese Yen.
- There is a crucial bullish trend line forming with support at 113.50 on the 4-hours chart of USD/JPY.
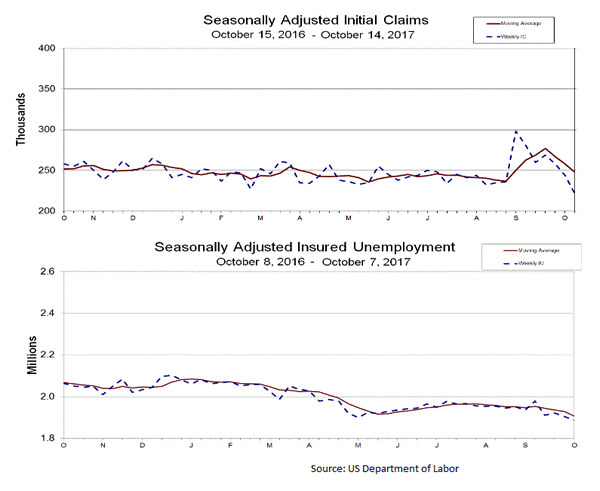
- The US Initial Jobless Claims for the week ending Oct 21, 2017 posted a rise from the last revised reading of 223K to 233K.
- Japan’s National Consumer Price Index in Sep 2017 posted a rise of 0.7% (YoY), similar to the market forecast.
USDJPY Technical Analysis
The US Dollar mostly traded in a broad range with bullish moves above 113.40 against the Japanese Yen. However, the USD/JPY pair remains in an uptrend as long as there is no close below 113.20-113.00.
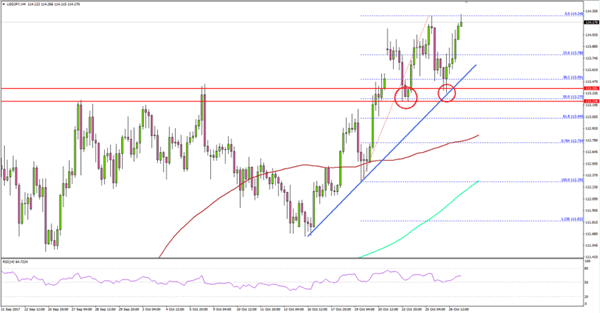
Looking at the 4-hours chart, there is a crucial bullish trend line forming with current support at 113.50. The pair recently tested the same trend line at 113.35 and recovered. It seems like the 113.30-20 support zone is very important since it coincides with the 50% Fib retracement level of the last wave from the 112.29 low to 114.24 high.
A close below 113.20 would ignite further declines back towards 112.75 and the 100 simple moving average (4-hour, red).
On the upside, an initial resistance is at 114.25 followed by the 114.50 level and finally 115.00.
US Initial Jobless Claims
Recently in the US, the Initial Jobless Claims for the week ending Oct 21, 2017 were released by the US Department of Labor. The forecast was slated for a rise from 222K to 235K.
The actual result was better than the forecast, as there was a rise in claims to 233K. However, the last reading was revised up from 222K to 223K. The 4-week moving average posted a decrease of 9.5K to 248,250 from the previous week’s revised average of 257,750.
The report stated:
The advance number for seasonally adjusted insured unemployment during the week ending October 14 was 1,893,000, a decrease of 3,000 from the previous week’s revised level. This is the lowest level for insured unemployment since December 29, 1973 when it was 1,805,000.
Overall, it seems like the USD/JPY pair remains in an uptrend as long as there is no close below the 113.20 support region.
Economic Releases to Watch Today
US Gross Domestic Product Q3 2017 (Preliminary) – Forecast 2.5% versus previous 3.1%.
US Personal Consumption Expenditures Prices for Q3 2017 (QoQ) – Forecast +1.2%, versus +0.3% previous.
US Core Personal Consumption Expenditures for Q3 2017 (QoQ) – Forecast +1.3%, versus +0.9% previous.
Trade Idea: EUR/JPY – Stopped profit and sell at 133.50
EUR/JPY - 132.85
Original strategy:
Bought at 133.20, stopped profit at 133.50
Position: - Long at 133.20
Target: -
Stop: - 133.50
New strategy :
Sell at 133.50, Target: 131.50, Stop: 134.10
Position: -
Target: -
Stop:-
Although the single currency rose marginally to 134.50, lack of follow through buying on break of previous resistance at 134.41 and the subsequent selloff dampened our bullishness and suggests a temporary top has possibly been formed there, hence consolidation below this level is seen with downside bias for test of 132.47 support, break there would add credence to this view, bring retracement of recent rise to 132.00, then towards support at 131.66 which is likely to hold from here.
In view of this, we are looking to turn short on recovery as 133.40-50 should limit upside and bring another decline later. Above 133.95-00 would defer and suggest the retreat from 134.50 has ended instead, however, still reckon said resistance at 134.50 would hold, bring further choppy consolidation later.
Our latest preferred count is that wave (ii) is ABC-X-ABC which ended at 123.33 and wave (iii) is unfolding with wave iii ended at 100.77, followed by wave iv at 111.57 and wave v as well as the wave (iii) has ended at 97.04, followed by wave (iv) at 111.43 and wave (v) has ended at 94.12 which is also the end of the larger degree v, this also implied the major wave (C) has also ended there, hence major correction has commenced from there with (A) leg unfolding in its lower degree wave c which has possibly ended at 145.69. Under this count, A-B-C wave (B) has commenced with A leg ended at 136.23, wave B at 143.79 and wave C has possibly ended at 149.79.
Our larger degree count is that the decline from 139.26 is wave (C) and is sub-divided into a diagonal triangle i-ii-iii-iv-v with wave i - 105.44, wave ii- 123.33, wave iii - 97.03, wave iv - 111.43, followed by the final wave v as well as the end of wave (C) at 94.12, this also mark the bottom of larger degree wave B. Under this count, major rise in wave C has commenced as an impulsive wave with minor wave III ended at 145.69, wave V is still in progress for further gain to 150.00. Having said that, this so-called wave V could well be the first leg of larger degree 5-waver wave C and this wave C should bring at least a retest of wave A top at 169.97 (July 2008).

Trade Idea: AUD/USD – Sell at 0.7720
AUD/USD – 0.7641
Original strategy:
Sold at 0.7875, met target at 0.7700
Position: - Short at 0.7875
Target: - 0.7700
Stop:-
New strategy :
Sell at 0.7720, Target: 0.7550, Stop: 0.7780
Position: -
Target: -
Stop:-
As aussie has remained under pressure after recent anticipated selloff, adding credence to our view that recent decline from 0.8125 top is still in progress and further weakness to 0.7600 is likely, however, near term loss of downward momentum should prevent sharp fall below 0.7550 and reckon 0.7500 would hold from here, bring rebound later.
In view of this, we are looking to reinstate short on recovery as 0.7715-20 should limit upside and bring another decline. Above previous support at 0.7770 would defer and suggest a temporary low is possibly formed, bring rebound to 0.7800 and then towards 0.7825-35 later.
On the 4-hour chart, recent upmove from 0.7329 is unfolding as an impulsive rise with wave 3 as well as smaller degree wave (iii) extending, only minor wave v of (iii) has ended at 0.8125, hence bullishness remains for this move to extend headway to 0.8200, then towards 0.8300, however, reckon upside would be limited to 0.8400 and the final wave 5 should falter below 0.8500, bring correction later.
