Sample Category Title
US Bond Yields Rip
US Bond Yields Rip
Bond yields surged after a strong ADP report which surprised to the upside, reporting a 298k gain in private payrolls in February. On cue, the USD jumped across the board. Oil prices, on the other hand, slid on gushing US crude oil inventories, which printed another record today, representing an upsurge of 8.2 million barrels over last week's print.
Overnight, the US dollar hesitated on the initial move made on US Treasuries earlier in the week, and with a stellar ADP pointing the way to a strong NFP on Friday, US dollar bulls went on the offensive as surging US Bond Yields put the USD back in vogue.
Australian Dollar
The AUD got smacked with the ugly stick in the lead up to the ADP report, due to weaker than expected Chinese trade data and it's damaging effects on the global growth story line and commodity prices.
The 3 C's (commodity prices, carry trade and China) have turned to negative, and as such, the near-term outlook for the Aussie dollar is pivoting south. I expect the markets to re-engage short AUDUSD positions after the break of the .7550 level and I also expect any near-term rallies to be faded.
Storm clouds are building on the AUD horizon, and according to my weather map, a perfect storm is developing, more so with US yields looking poised to make higher highs.
Commodities
In the broader equity markets, lower commodity prices weighed on the shares of energy and mining companies, offsetting any gains for the financial services sector, as bond yields climbed.
The commodity bloc currencies have not received a boost from oil prices, which tumbled on the latest inventories reports. WTI toppled sharply from 53 to just above the critical 50.00 per barrels. Moreover, while the stronger US dollar has not helped, the ferocity of the move suggests that speculative longs were trimming, which could accelerate on a break of the psychological $50.0 level.
Japanese Yen
Dollar bulls who were lacking conviction early this week are in catch up mode ahead of the NFP, which is being viewed as the precursor to a Fed rate hike next week. The surge in US fixed income markets, with US 10 year yields moving in on the 2.60% level, this has sent the market scurrying for top side dollar exposure. While the stop side technical structures (114.75-115) have remained intact, US bond yields are set to rip even higher, so it is only a matter of course before we test the 115 level.
I suspect only a lower than expected NFP will topple the dollar apple cart, but this is highly improbable, as significant topside ADP surprises usually signal the NFP beating consensus. Longer term players, however, will probably be tempered by the US hawkish stance on trade policy. Still, there are many moving parts in these equations.
Euro
It is interesting that German ten-year yields rose ahead of tonight's ECB meeting. Perhaps it is a sign that investors are getting fidgety about a possible change in ECB policy rhetoric. While it is not impossible that the ECB would follow the new Fed hawkish playbook, I suspect the ECB will call the play which errs on the side of caution and keeps policy accommodative in the face of rising political uncertainty. But for the EUR short players, it all boils down to whether or not the market buys into the Draghi's expected dovish lean in the face of improving macro and inflation outlooks in Europe
EM Asia
China is seen as one the primary drivers for ASEAN EM risk sentiment, and with the economy looking stable, and with PMI indexes all pointing up, ASEAN currencies are insulated from much of the Fed headline risk. With recent China trade data coming in below expectations, coupled with surging US bond yields, expect ASEAN local units to trade with heavy bias over the near term.
The Malaysian Ringgit should get hit from both sides as oil prices plummet and surging US yields weigh on the unit near term.
US 10yr Yield, 3% Target Over Next Few Months Remains
Near term US 10 year note yield outlook:
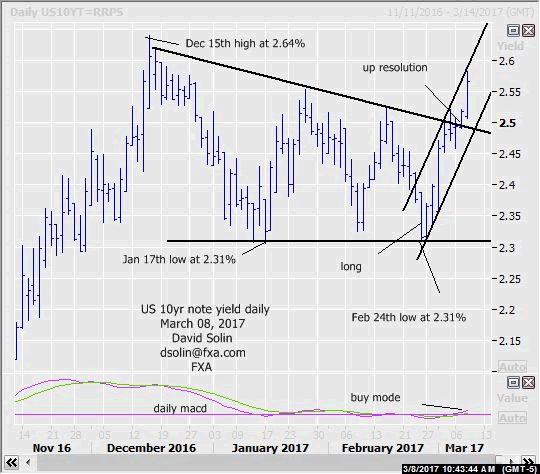
In the Mar 1st email, affirmed the bullish view of a large triangle/pennant forming since Dec 15th high (seen as a continuation pattern) with an upside resolution and gains above that 2.64% high. The market has indeed since resolved higher from the ceiling of the triangle (currently at 2.47/49%, now support) and with gains above that 2.64% favored ahead. Note too that technicals are bullish (see buy mode on the daily macd) and longer term view of gains toward the 3% area (see longer term below) add to this positive view. Also, triangles often resolve rapidly and raises some potential further, sharp gains directly ahead. Nearby resistance is seen at that Dec 15th high at 2.63/65%. Support is seen at the broken ceiling of the triangle (currently at 2.47/49%) and the base of the bullish channel from the recent lows (currently just below at 2.43/45%). Nearby resistance is seen at the ceiling of that channel (currently at 2.58/60%) and that 2.64/66% high. Bottom line: did indeed resolve higher from the triangle since Dec with further gains (potentially sharp) above that 2.64% peak ahead.
Strategy/position:
Still long from the Feb 24th buy at 2.34% and for now would stop on a close .02 back below the ceiling of the triangle. But will want to switch to a more aggressive, trailing stop on new highs above 2.64% to maintain a good risk/reward in the position.
Long term outlook:
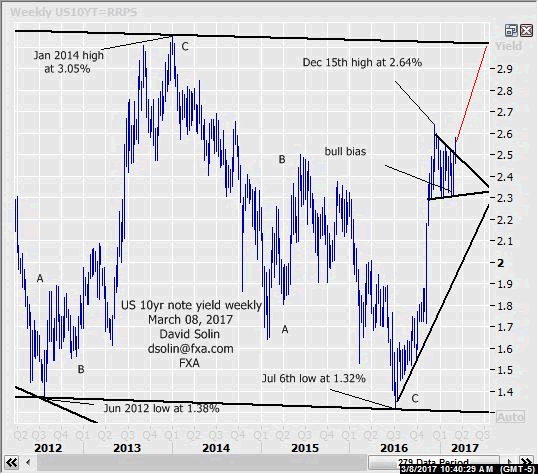
No change in the longer term bullish view with gains (potentially rapid) toward the 3.00/3.10% area still favored. In the very long term, the market is seen in process of a huge "complex" correction/extended period of wide ranging since the June 2012 low at 1.38%, and with gains to the 3.00/3.10% ceiling/Jan 2014 still favored ahead. Note too as discussed above, triangles often resolve sharply and raises the potential that such gains may be relatively rapid ahead (next few months, see in red on weekly chart/2nd chart below). For those familiar with Elliott Wave analysis, the market seen forming a large "flat" type correction. These patterns break down to a series of 3-3-5 waves and explains that 3 wave decline from the Jan 2014 high at 3.05% to the slight new low on July 2016 at 1.32% (A-B-C). And finally from a very long term standpoint, such gains back toward 3.00/10% (and even slightly above) may be more limited and part of a very major topping and versus the start of a more significant upmove. But at this point, don't want to get too far ahead of ourselves so suffice to say that gains over the next few months toward that 3.00/10% is favored and will be looking to reassess at that time. Bottom line : gains toward 3.00/10% still favored and move may be relatively rapid (few months).
Strategy/position:
Also switched the longer term bias to bullish on Feb 24th at 2.34%.
Current:
Nearer term : reached target from Jan 22nd email at 2.34% on Feb 24th. .
Last : short Feb 2nd at 2.47%, took small profit Feb 22nd at 2.42%s (.05 profit).
Longer term: bullish bias Feb 24th at 2.34% for a potentially rapid move to 3.05% (next few months).
Last : bear bias Nov 23rd at 2.54% to neutral Jan 13th at 2.40%.
German DAX Could Face A Potential Breakdown
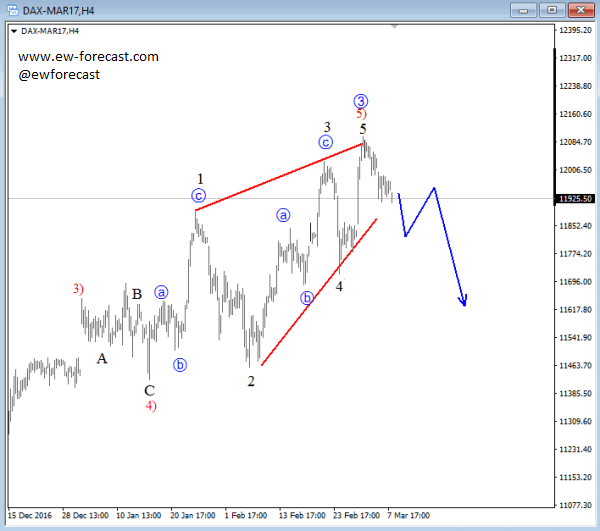
German DAX has been trading higher last week but it stopped at the upper side of an ending diagonal where it may be an important reversal for the next few days. In fact we see a nice decline at the moment back below 11970 which suggests that top can be put in place. Further weakens and break below wave 4 may even cause a decline back to 11400 area this month.
German DAX, 4H
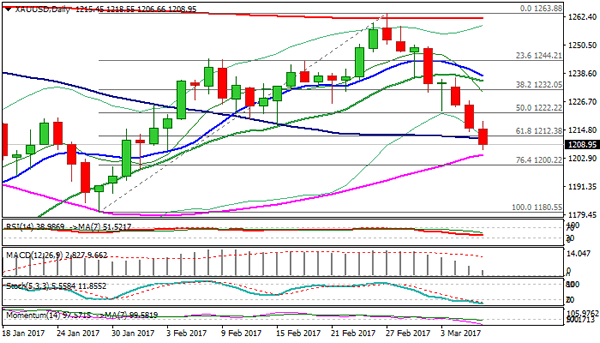
Gold – Extended Bears Took Out Strong Support at $1212
Spot Gold remains under strong pressure on increased expectations of Fed rate hike next week.
Today's extension of past two-days strong fall took out important support at $1212 (Fibo 61.8% of $1180/$1263 upleg, reinforced by 100SMA).
Daily close below here is needed to confirm bearish continuation that eyes immediate support at $1204 (55SMA) and psychological $1200 level (also Fibo 76.4% retracement).
Further downside would look for $1191 (top of daily Ichimoku cloud that twisted on 02 Mar) that may attract extended weakness on break.
Strongly oversold slow stochastic suggests that bears may run out of stem on approach to $1200 support, however, strong bearish sentiment is expected to limit upside action, with $1212 marking immediate barrier and former strong support at $1222, now reverted to resistance, seen ideally capping.
Res: 1228; 1238; 1243; 1250
Sup: 1222; 1216; 1212; 1203
USDJPY – Has it Got a New Lease of Life?
Just as it looked as though USDJPY was sleepwalking into bearish territory, it would appear the pair has found a new lease of life just in the nick of time.
Following in the footsteps of EURJPY and GBPJPY, it looked as though USDJPY was about to break below the Ichimoku cloud, taking it into bearish territory for the first time since the start of October (barring a brief dip below on 9 November).
Instead the pair could be heading higher once again having rallied off the bottom of the cloud to trade around 0.5% higher on the day and 100 pips up off the lows.
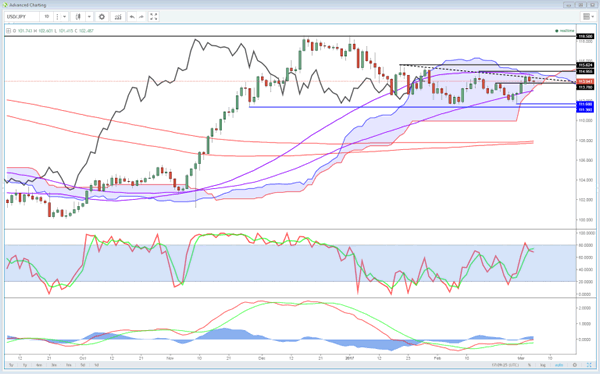
Whatever the trigger for the move - weaker GDP data from Japan overnight, weaker economic sentiment figures, stronger global risk appetite on the day - the only question that matters is whether it's sustainable or a short term shot in the arm that precedes a break below the cloud?
The first sign that the rally may have found new life again is the break of a short term trend line - 19 January highs - although this in itself is far from a clear signal. A much stronger sign would come from a break above 115 which would see the pair move back above the cloud and take out the 15 February and 3 March peaks and end the series of lower highs in the process.
More broadly speaking, the pair has been roughly range-bound since near the start of the year, with the upper end around 115.50 and lower around 115.50. A break out of this would be a clear sign that the pair has broken out of the consolidation period.
Should this be a break higher then we could be headed back towards 118.50 - which given the fundamental backdrop may make sense - while a break below the cloud would suggest further consolidation at best or a much broader sell-off at worst. The latter still seems quite unlikely at the moment.
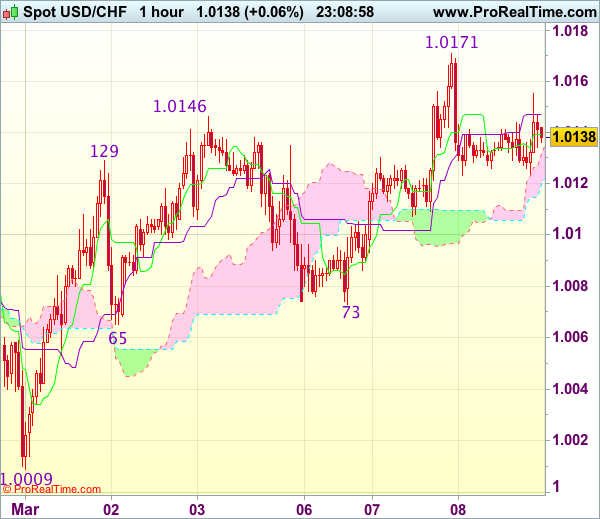
Trade Idea Wrap-up: USD/CHF – Buy at 1.0080
USD/CHF - 1.0143
Most recent candlesticks pattern : N/A
Trend : Near term up
Tenkan-Sen level : 1.0139
Kijun-Sen level : 1.0132
Ichimoku cloud top : 1.0147
Ichimoku cloud bottom : 1.0120
Original strategy :
Buy at 1.0080, Target: 1.0200, Stop: 1.0045
Position : -
Target : -
Stop : -
New strategy :
Buy at 1.0080, Target: 1.0200, Stop: 1.0045
Position : -
Target : -
Stop : -
Dollar’s retreat after yesterday’s rise to 1.0171 suggests top has been formed and consolidation below this level would be seen and pullback to 1.0105-10 cannot be ruled out, however, reckon downside would be limited to support at 1.0073 and bring another rise later, above said resistance at 1.0171 would confirm recent erratic upmove from 0.9861 has resumed for further gain towards 1.0200-10 but overbought condition should prevent sharp move beyond previous chart resistance at 1.0248, risk from there is seen for a retreat later.
In view of this, would not chase this rise here and would be prudent to buy dollar on pullback as support at 1.0073 should limit downside. A drop below 1.0065 support would abort and signal top is formed instead, risk weakness to 1.0040-45 but reckon support at 1.0009 would remain intact.
Trade Idea Wrap-up: GBP/USD – Stand aside
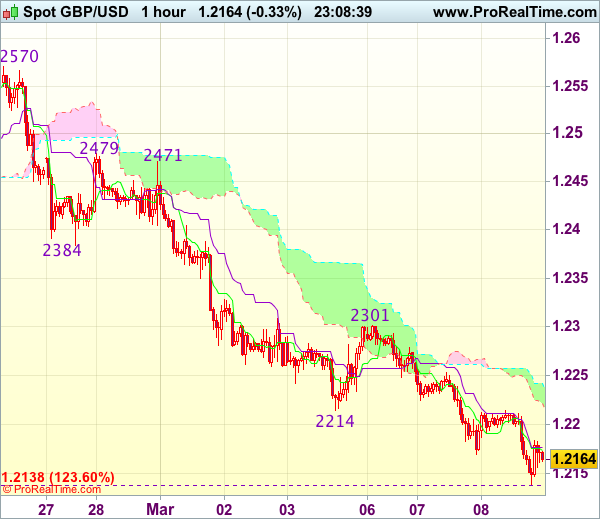
GBP/USD - 1.2157
Most recent candlesticks pattern : N/A
Trend : Near term down
Tenkan-Sen level : 1.2174
Kijun-Sen level : 1.2177
Ichimoku cloud top : 1.2242
Ichimoku cloud bottom : 1.2222
New strategy :
Stand aside
Position : -
Target : -
Stop : -
Although cable has fallen again after brief recovery and near term downside risk remains for recent decline to extend further weakness to 1.2120-25 (50% projection of 1.2479-1.2214 measuring from 1.2301), loss of near term downward momentum should prevent sharp fall below 1.2100 and reckon 1.2070-75 would hold from here, risk from there has increased for a rebound to take place later.
In view of this, would not chase this fall here and would be prudent to stand aside in the meantime. Above 1.2180-85 would bring test of 1.2210-15, however, break there is needed to signal an intra-day low is formed, bring correction to 1.2245-55 but price should falter well below resistance at 1.2301 and bring another selloff.
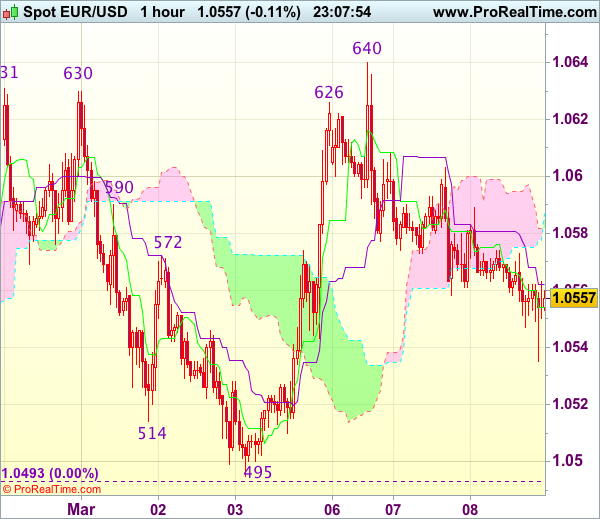
Trade Idea Wrap-up: EUR/USD – Buy at 1.0525
EUR/USD - 1.0557
Most recent candlesticks pattern : N/A
Trend : Sideways
Tenkan-Sen level : 1.0554
Kijun-Sen level : 1.0562
Ichimoku cloud top : 1.0587
Ichimoku cloud bottom : 1.0582
Original strategy :
Buy at 1.0525, Target: 1.0625, Stop: 1.0490
Position : -
Target : -
Stop : -
New strategy :
Buy at 1.0525, Target: 1.0625, Stop: 1.0490
Position : -
Target : -
Stop : -
Although the single currency has remained under pressure after retreating from 1.0640 and near term downside risk remains for weakness, reckon downside would be limited to 1.0525-30 and bring another rebound later, above 1.0600-05 would bring test of said resistance at 1.0640 but break there is needed to extend the erratic rise from 1.0493 low for retracement of early decline to 1.0660-65 (50% Fibonacci retracement of 1.0829-1.0493) and possibly towards resistance at 1.0680, however, price should falter well below 1.0700-05 (61.8% Fibonacci retracement).
In view of this, we are looking to buy euro on dips. Below 1.0510 would abort and risk retest of 1.0493 but only break there would shift risk back to the downside and signal recent decline from 1.0829 has resumed for further selloff to 1.0470 and then towards previous support at 1.0454.
Trade Idea Wrap-up: USD/JPY – Buy at 114.20
USD/JPY - 114.51
Most recent candlesticks pattern : N/A
Trend : Near term up
Tenkan-Sen level : 114.20
Kijun-Sen level : 114.19
Ichimoku cloud top : 114.16
Ichimoku cloud bottom : 113.92
New strategy :
Buy at 114.20, Target: 115.20, Stop: 113.85
Position : -
Target : -
Stop : -
As the greenback found renewed buying interest at 113.61 and has staged a strong rebound, suggesting the rise from 111.69 is still in progress and may extend further gain towards previous chart resistance at 114.96, however, break there is needed to signal early erratic rise from 111.59 low has resumed and extend gain towards another previous resistance at 115.38 but price should falter below previous resistance at 115.62, bring retreat later.
In view of this, we are looking to buy dollar on pullback as the Kijun-Sen (now at 114.19) should limit downside and bring another rise later. Below 113.95 support would signal an intra-day top is formed instead, risk weakness towards said strong support at 113.56-61 which is likely to hold from here.

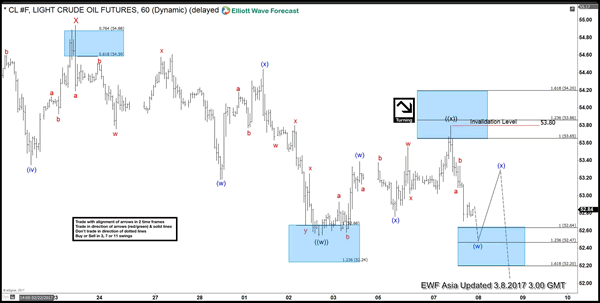
Crude Oil (CL_F) Short-term Elliott Wave View
Short term Elliottwave view in Crude Oil (CL_F) suggests that the instrument is currently correcting cycle from 11/14/2016 low (42.21) in 3, 7, or 11 swing before the next leg higher. The decline starting from 2/23 high (54.94) is unfolding as a double three Elliottwave structure where wave ((w)) ended at 52.54 and wave ((x)) ended at 53.80. Near term focus is on 52.47 – 52.64 area to complete wave (w) of ((y)), then Crude Oil should bounce in wave (x) of ((y)) before turning lower again towards as low as 49.34 – 50.41 area, provided that pivot at 53.8 high remains intact. We don't like selling the proposed pullback and expect the next buying area of 49.34 – 50.41 to find dip buyers for the next leg higher or at least a 3 waves bounce.
CL_F 1 Hour Chart