Sample Category Title
EUR/USD Sharp Decline
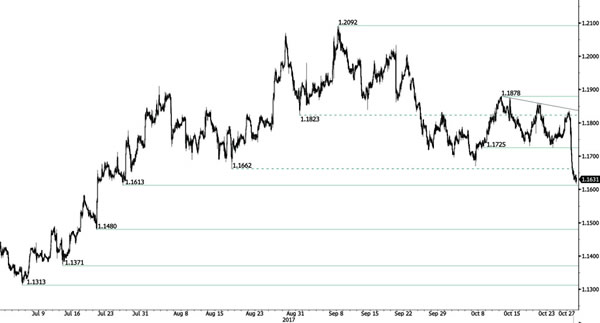
EUR/USD has broken support at 1.1725 (23/10/20107 low) which has triggered bearish extension to strong support given at a distance at 1.1613 (26/07/2017 low). Key resistance is located at 1.1878 (12/10/2017 high). Expected to show renewed short-term consolidation.
In the longer term, the momentum is now turning largely positive. We favour a continued bullish bias. Key resistance is holding at 1.2252 (25/12/2014 high) while strong support lies at 1.0341 (03/01/2017 low).
EUR/JPY Elliott Wave Analysis
EUR/JPY - 133.00
Although the single currency briefly broke above previous resistance at 134.41, lack of follow through buying and the subsequent retreat from 134.50 suggest consolidation below this level would be seen with mild downside bias for weakness to 132.45-50, then 132.00, however, a break of previous support at 131.66 is needed to signal top has been formed there, bring retracement of recent upmove to 131.00, then towards another previous support at 130.62, having said that, reckon 130.00 would hold from here, bring rebound later.
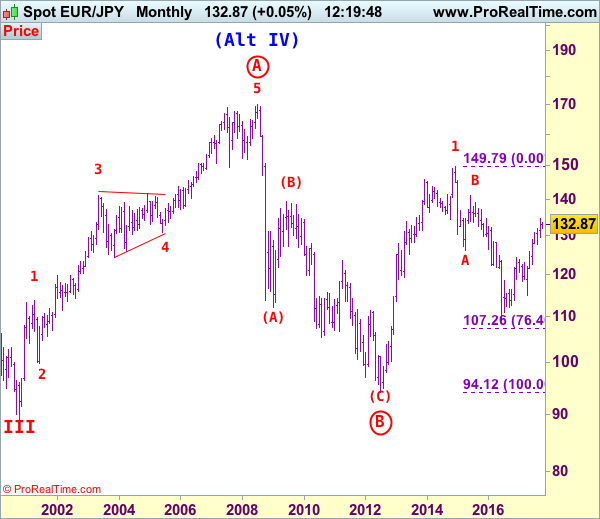
The daily chart is labeled as attached, early selloff from 169.97 (July 2008) to 112.08 is wave (A) of B instead of end of entire wave B and then the rebound from there to 139.26 is wave (B), hence, wave (C) has possibly ended at 94.12 with a diagonal triangle as labeled in the daily chart, hence upside bias is seen for further gain. Recent rally above indicated retracement level at 116.69 (50% Fibonacci retracement of the intermediate fall from 139.26-94.12) adds credence to this view and signal major reversal has commenced but first leg of this wave C has possibly ended at 149.79, hence wave 2 has commenced with wave A ended at 126.09, followed by wave B at 141.06, wave C commenced and could have ended at 109.49, indicated upside targets at 126.00 and 130.00 had been met and further gain to 135.00 would follow.
On the upside, whilst initial recovery to 133.50-60 cannot be ruled out, reckon 134.00 would hold and bring another retreat. Only break of said resistance at 134.50 would abort and signal recent upmove has resumed and extend further gain to 135.00, however, loss of upward momentum should prevent sharp move beyond 136.00-10 and reckon 136.95-00 would hold, price should falter well below 138.45-50 (1.618 times extension of 109.49-124.10 measuring from 114.85), bring correction later.
Recommendation: Sell at 133.50 for 131.50 with stop below 134.50.
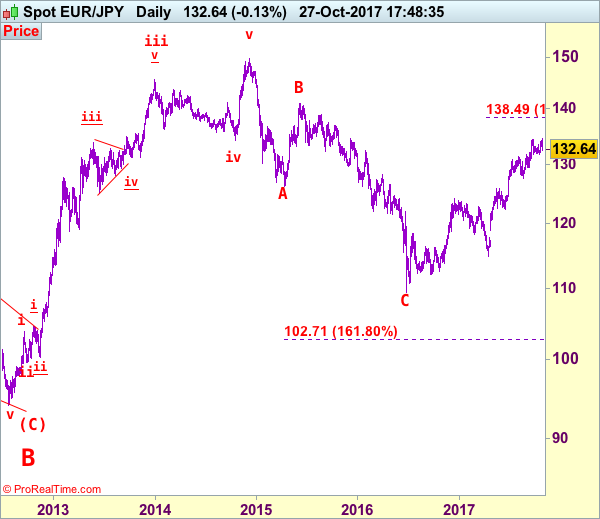
To re-cap the corrective upmove from the record low of 88.93 (18 Oct 2000), the wave A from there is subdivided as: 1:88.93-113.72, 2:99.88 (1 Jun 2001), 3:140.91 (30 May 2003), 4:124.17 (10 Nov 2003) and 5 ended at record high of 169.97 (21 Jul 2008). The brief but sharp selloff to 112.08 is viewed as a-b-c x a-b-c wave (A) of B. The subsequent rebound to 139.26 is (B) of B and (C) of (B) has possibly ended at 94.12 and in any case price should stay well above previous chart support at 88.93, bring rally in larger degree wave C towards 150.00.
USD/CHF Elliott Wave Analysis
USD/CHF – 0.9952
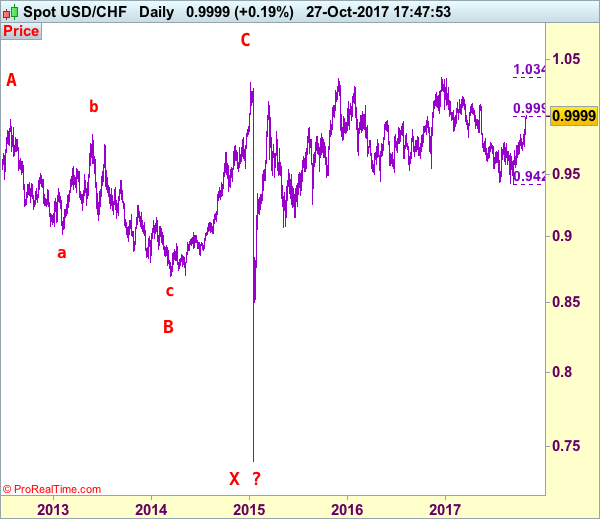
The greenback has surged again after last week’s breach of previous resistance at 0.9837 (now support), adding credence to our bullish view that low has been formed at 0.9421 and upside bias remains for this rise from there to extend further gain to 0.9990-00 (61.8% Fibonacci retracement of 1.0344-0.9421), then towards 1.0050, however, near term overbought condition should prevent sharp move beyond 1.0100 resistance, risk from there is seen for a retreat to take place later.
Our preferred count on the daily chart is that early selloff to 0.9630 is an end of the larger degree wave III and major correction is unfolding from there with a leg ended at 1.2298 (Nov 2008 with (a): 1.0625, (b):1.0011 and (c):1.2298), wave b ended at 0.9910 with (a): 1.0370, (b): 1.1967, (c): 0.9910. The rise from there to 1.1730 is the wave c which also marked the end of wave IV and wave V has possibly ended at 0.7068.
On the downside, whilst initial pullback to 0.9900-05 cannot be ruled out, reckon renewed buying interest would emerge around 0.9865-70 and bring another rise later. Below previous resistance at 0.9837 (now support) would defer and risk correction to 0.9795-00 but downside should be limited to 0.9755-60 and support at 0.9737 should remain intact, bring another rise. Only a drop below 0.9737 would signal top is formed instead, bring test of key support at 0.9705 which is likely to hold from here.
Recommendation: Buy at 0.9575 for 0.9775 with stop below 0.9475.
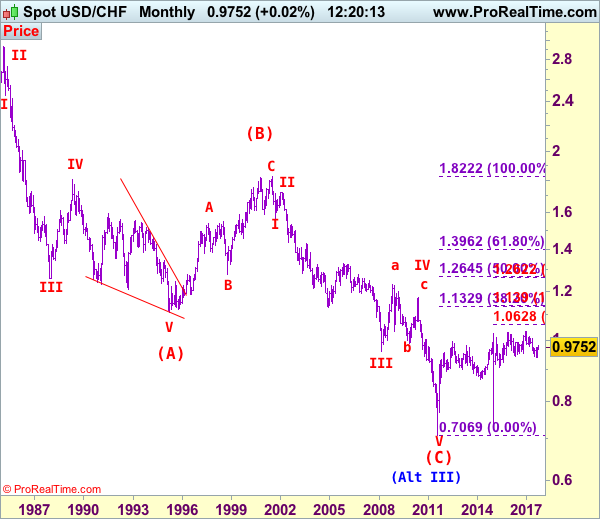
Dollar's long-term downtrend started from 2.9343 (Feb 1995) and it was unfolding as a (A)-(B)-(C) with (A): 1.1100, (B): 1.8310 (26 Oct 2000), then followed by another impulsive wave (C) with wave III ended at 0.9630 (Mar 2008). Under this count, correction in wave IV has possibly ended at 1.1730 and wave V already broke below support at 0.9630 and met indicated downside target at 0.7500 and 0.7400. The reversal from 0.7068 suggests the wave V has possibly ended and the breach of resistance at 0.9595 add credence to this view and indicated upside target at 1.0000 had been met, however, the sharp retreat from 1.0296 to 0.7401 suggests choppy trading would be seen but price should stay above said record low at 0.7068.
Technical Outlook: SPOT GOLD – Bears Eye Key Support At $1260, Broken 100SMA To Cap Corrective Upticks
Spot Gold is consolidating within narrow range above fresh three-week low at $1264 on Friday.
Increased risk appetite for dollar and equities keeps gold under pressure.
Bear-leg from $1306 closed below $1271 (Fibo 76.4% of $1260/$1306 upleg) after strong bearish acceleration on Thursday that opened way towards key supports at $1260 (06 Oct low / 200SMA).
Near-term price action may stay in directionless mode ahead of release of US GDP data, due later today, which could give fresh direction signal, depending on release.
Overall structure is bearish and favors further downside on sustained break below $1260 pivot, with corrective upticks expected to face strong headwinds from broken 100SMA ($1275) which is expected to ideally cap.
Only sustained break here would sideline immediate bears for stronger correction.
Res: 1269, 1271, 1275, 1277
Sup:: 1264, 1260, 1251, 1249
ECB Hammers The Euro, USD To Shine Again
USD clicking on all cylinders
Today we will get US 3Q GDP read. On the balance softer retail inventories were offset by stronger wholesalers’ inventories which suggest that GDP should track near 2.8% q/q significantly above the market read of 2.6% q/q. Pending home sales were flat in September after declining to 2.8% in August due to weaker activity in areas hit by Hurricanes Harvey and Irma. Overall solid reads will reinforce the December 25bp hike and increase the likelihood that the Philip curve will kick-in. Faster growth accelerations, tighten labor markets (next week payrolls are likely to risen sharply after September weather disruptions) will rise inflation outlook closer to 2.0%. A read of this level will clearly catch the doubters flatfooted as after nearly 10 years Fed projections and hard date will have finally converged.
The repricing of the US yield curve, which has already begun, as 10-yr yield risen to 2.47%, will likely quicken. Shift higher in US rates will further rotate investors from EM and low yielding G10 into USD. EUR is especially vulnerable since the positon was extended and hope of a hawkish ECB has been significantly withdrawn as policy interest rates are unlikely to increase until 2019. In regards to the fed and policy stability, speculation is that Trump has eliminated Yellen and Warsh narrowing the field down to Powell and Taylor for Fed Chair. Given Powell’s dovish stance and long relationship with Republican stalwarts he has the highest chance of securing the post. Trump is expected to announce the decision by Nov. 3rd. we suspect this result will be viewed positively by markets as a continuation of slow and gradual monetary strategy.
ECB meeting: Very loose monetary policy continues in 2018
The ECB meeting disappointed markets as they were expecting a more hawkish stance from the ECB. Even though it was priced in that the QE would be largely extended, the bond purchase program will now be extended until next September, the amount has only been cut in half. In other words the ECB will inject 270 billion euros in the market for the first nine months of 2018. This has to be compared with the 720 billion euros that have been injected this year. The ECB current monetary policy is then going to continue to be massive. The monetary policy divergence between the US and Europe is set to widen.
The EURUSD took a hit, as markets were awaiting a stronger adjustment of the monetary policy. The pair lost almost two figures from 1.18 to 1.16 after the press conference. Draghi appeared very cautious by saying that the end of the QE would require some more time despite his optimism regarding the Eurozone recovery. The end of the QE easing is definitely not for now and markets punished the single currency. More downside on the euro appears now very likely.
Trade Idea: GBP/USD – Sell at 1.3170
GBP/USD – 1.3096
New strategy :
Sell at 1.3170, Target: 1.3000, Stop: 1.3230
Position: -
Target: -
Stop:-
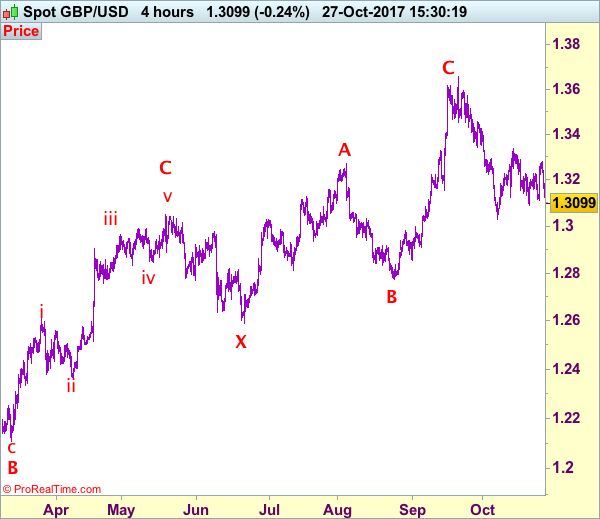
Sterling ran into resistance at 1.3279 and has dropped sharply, price just broke below previous support at 1.3110 and 1.3088, signaling the rebound from 1.3027 has ended at 1.3338, hence bearishness is seen for retest of 1.3027, however, break there is needed to confirm early decline from 1.3658 top has resumed for further fall to psychological support at 1.3000 first.
In view of this, we are looking to sell cable on recovery as 1.3170-80 should limit upside and bring another decline later. Above 1.3220-25 would defer and prolong choppy consolidation, risk rebound to indicated resistance area at 1.3279-87 which is likely to hold from here. Our preferred count is that (pls see the attached chart) the wave IV is unfolding as a complex double three (ABC-X-ABC) correction with 2nd wave B ended at 1.2774, hence 2nd wave C could have ended at 1.3658.
Our preferred count on the daily chart is that cable's rebound from 1.3500 (wave (A) trough) is unfolding as a wave (B) with A ended at 1.7043, followed by triangle wave B and wave C as well as wave (B) has ended at 1.7192, the subsequent selloff is the larger degree wave (C) which is still unfolding with minor wave (III) of larger degree wave 3 ended at 1.1986, hence wave (IV) correction is in progress which could either be a triangle wave (IV) of a complex formation but upside should be limited to 1.3500 and price should falter well below 1.4000, bring another decline in wave (V) of 3 for weakness to 1.1500, then 1.1200.
Trade Idea: GBP/JPY – Stopped profit and sell at 150.00
GBP/JPY - 149.20
Original strategy:
Bought at 149.50, stopped profit at 149.70
Position: - Long at 149.50
Target: -
Stop: - 149.70
New strategy :
Sell at 150.00, Target: 148.00, Stop: 150.60
Position: -
Target: -
Stop:-
Although rose to 151.40 (just missed our upside target with 10 points), the subsequent retreat together with the breach of previous support at 149.15 suggest the rebound from 146.95 has ended there and consolidation with downside bias is seen for weakness to 148.50, then 148.00, however, break of support at 147.80 is needed to retain bearishness and signal another leg of decline from 152.85 top is underway for further fall towards said support at 146.95.
In view of this, we are looking to sell sterling on recovery as 150.00-10 should limit upside and bring another decline later. Above 150.50-60 would prolong consolidation and bring rebound to 151.00 but said resistance at 151.40 should hold. Only a break of this resistance would revive bullishness and extend the rebound from 146.95 towards 151.90-00 first.
Our preferred count is that larger degree wave V with circle is unfolding from 251.12 with wave (I) 219.34, (II): 241.38 and wave (III) is subdivided into 1: 192.60, 2: 215.89 (23 Jul 2008) and wave 3 ended at 118.87 earlier in 2009. The correction from there to 162.60 is wave 4 which itself is a double three and is labeled as first a-b-c ended at 151.53, followed by wave x at 139.03, 2nd a ended at 162.60, 2nd b at 146.75 and 2nd c leg of wave 4 ended at 163.00. Therefore, the decline from 163.00 to 116.85 is now treated as wave 5 which also marked the end of larger degree wave (III), hence wave (IV) major correction has commenced for retracement of the wave (III) from 241.38 and upside target at 183.95-00 (50% Fibonacci retracement of the wave (II) from 241.38) had been met, a drop below 160.00 would suggest wave (IV) has ended at 195.85, bring decline in wave (V) for initial weakness to 130 (already met) and 120.

Euro Continues To Tumble, US GDP In Focus
It has been another interesting week for global markets, as investors continued to wrestle with the Catalonia crisis, bumpy Brexit negotiations, and uncertainty around who will become the next Fed Chair. The main highlight was on Thursday, when the European Central Bank moved forward with a 'dovish taper', a move that is seen as the first step to ending easy money.
Stock markets seem to have started on a positive note this morning, with shares in Asia venturing higher, following Wall Street’s gain overnight. European stocks found support in the ECB’s dovish taper on Thursday, and could remain buoyed during today’s trading session.
Euro tumbles on 'dovish taper'
The Euro was under intense selling pressure on Thursday, after the European Central Bank announced that it would taper its bond-buying to €30 billion, from €60 billion, beginning in January 2018.
While the central bank said that the purchases would be extended until at least September 2018, it is worth noting Mario Draghi’s comment that, 'if the outlook becomes less favourable', or if no progress is made towards the ECB’s inflation target, QE could be increased in terms of size and duration. Market players simply digested these comments as dovish, resulting in the Euro tumbling against the Dollar and other majors.
Catalonia will be back in the spotlight today, as the Spanish Senate in Madrid prepares to approve Minister Mariano Rajoy’s request to trigger Article 155, which will allow Madrid to suspend Catalonia’s regional autonomy. While the outcome of such a development remains unpredictable, the uncertainty is likely to punish the Euro.
Taking a look at the technical picture, the EURUSD has turned bearish on the daily charts. The breakdown below 1.1680 has triggered a decline towards 1.1600 and 1.1500, respectively.
Sterling shows true colours
It is remarkable how Sterling has already erased gains from the better-than-expected UK GDP report, released mid-week.
The culprit behind the currency’s sharp decline was a government survey showing UK retail sales plunging at their fastest pace in eight years. Thursday’s CBI survey showed that UK retail sales plummeted to -36 in October, as the unsavoury combination of rising inflation and subdued wage growth sapped consumer spending power. With the repeated story of wage growth failing to keep up with inflation, consumers are feeling the pinch, and this is likely to weigh heavily on sentiment.
From a technical standpoint, the GBPUSD has extended losses during Friday’s trading session with prices trading around 1.3100 as of writing. Sustained weakness below 1.3150 may open a path towards 1.3050 and 1.3020.
Dollar higher ahead of US GDP
The Dollar aggressively appreciated against a basket of major currencies on Thursday, after Congress cleared a procedural path forward for a Republican tax bill.
It has been an incredible week for the king Dollar, as renewed optimism over Trump’s proposed tax reforms and speculation over the new Fed Chair potentially being a hawk, supported the currency. Much attention will be directed towards the first estimate of the third quarter US GDP growth, due to be released this afternoon. A figure that is above market expectations is likely to support the dollar further.
From a technical standpoint, the dollar Index is turning bullish on the daily charts. A solid breakout above 95.00 may encourage a further incline higher towards 95.30 and 96.00, respectively.
Commodity spotlight – Gold
Gold plummeted to a three-week low, below $1267 on Thursday, amid a resurgent US Dollar.
With the Dollar set to appreciate further, as market players become increasingly optimistic over Trump’s proposed tax reforms, further punishment could be in store for the yellow metal. Taking a look at the technical picture, a solid breakdown and weekly close below $1267 may encourage a further decline towards $1260 and $1250
Technical Outlook: USDJPY Remains Stuck In 114 Zone Despite Posting New High
The pair returned to 114.00 zone after spiking to fresh high at 114.31 on Friday, where rally stalled just ahead of 114.33 barrier (Fibo 61.8% of 118.66/107.31 fall), signaling further hesitation. The price holds tall for now but risk of pullback remains as slow stochastic is hovering around overbought zone border and could generate bearish signal on sustained reversal.
In addition, 14d momentum is in sideways mode and not tracking the price on daily chart which could be also seen as negative signal.
Extended dips towards higher base at 113.24 (reinforced by rising 10SMA) should not be very harmful for bulls, but close below here would be considered as bearish signal, with extension and close below 20SMA (112.89) to confirm reversal.
Otherwise, near-term focus is expected to remain at the upside for final push through pivotal barriers at 114.33 and 114.36/49 (07 May/09 July highs), to signal bullish continuation.
Res: 114.23, 114.33, 114.49, 115.00
Sup: 113.92, 113.43, 113.24, 112.89
Technical Outlook: GBPUSD Tracks Euro, Extends Weakness Into Second Day
Cable is firmly in red on Friday and cracked support at 1.3087 (20 Oct spike low) on extension of Thursday's strong fall.
Sterling tracked the Euro which was slammed by dovish ECB and has fully reversed 1.3087/1.3278 upleg after recovery action was repeatedly capped under the top of thickening daily cloud. Daily techs returned to bearish mode and favor further weakness with strong supports at 1.3059 (100SMA) and 1.3026 (06 Oct low), coming under increased pressure.
The pair looks for close below 1.3110 (broken Fibo 61.8% of 1.2773/1.3655 rally) for initial bearish signal, with further negative signals seen on sustained break below 1.3059/26. This would open psychological 1.3000 support for test and could trigger further bearish acceleration on close below 1.3000 handle.
Broken 55SMA caps today's action and marks initial resistance at 1.3159, followed by converged 10/20SMA (1.3181/93) which guard key barrier at 1.3214 (daily cloud base). With no releases from the UK scheduled today, focus turns towards US GDP data.
US Gross Domestic Product is expected to rise 2.5% in Q3 which is seen as slowdown in comparison to Q2 growth by 3.1%, and the dollar may come under pressure on weaker than expected release, which would give a break to pound's bears.
Res: 1.3110, 1.3159, 1.3181, 1.3214
Sup: 1.3059, 1.3026, 1.3000, 1.2981