Sample Category Title
GBPUSD Maintains Neutral Bias In The Short Term Between 1.31-1.33
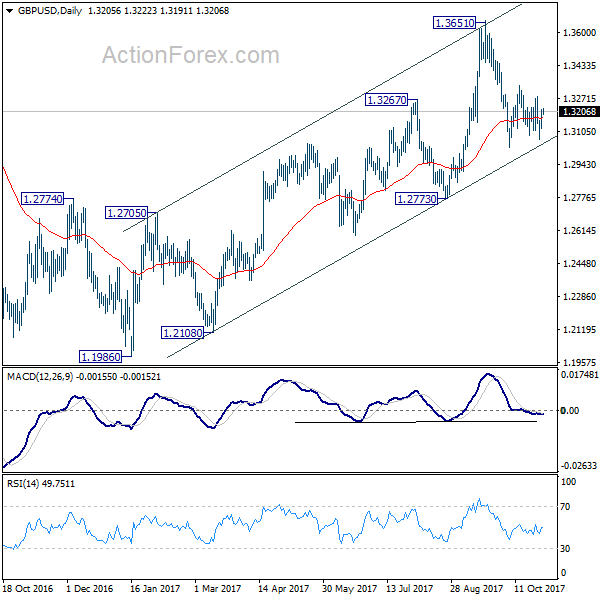
GBPUSD maintains a neutral bias in the short term and has been trading sideways in the 1.31 to 1.33 range during the past 3 weeks.
Technical indicators on the daily chart are neutral, suggesting that broader range trading will continue for now. RSI and MACD are both moving sideways and are slightly in bearish territory.
Based on Fibonacci analysis, the current range is between the 32.8% and 61.8% Fibonacci retracement levels of the upleg from 1.2773 and 1.3656.
The pair has managed to trade above the key 1.3000 level since declining from the September 20 high. This looks like a strong support level, which if broken to the downside would bring weakness in the market and put the focus on the 1.2773 low.
To the upside, prices need to clear 1.3319 (38.2% Fibonacci) and make a firm break of 1.3448 (23.6% Fibonacci) in order to see a re-test of the 1.3656 high. At this stage, GBPUSD would resume the uptrend that started from 1.2773.
The neutral bias is expected to continue in the short-term. The market needs a catalyst to break out of either side of the current range in order to see a significant move either above 1.33 or below 1.30 in the near term.
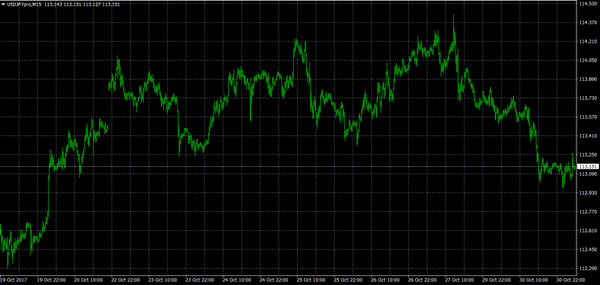
USDJPY Further Bearish Below 113.33
The U.S dollar continues to move lower against the Japanese Yen, as the U.S dollar index remains under selling pressure, following the Russian collusion story surrounding the Trump administration. The USDJPY pair currently trades around the 113.20 level, after the Bank of Japan announced no change in monetary policy in today's policy meeting. Investors now await the release of Consumer Confidence data from the U.S economy.
The USDJPY pair remains intraday bearish while trading below the key 113.33 level. Further declines towards 112.90 and 112.27 should be expected while trading below the 113.33 level. Extended intraday support is found at the 111.79 level.
Should the USDJPY trade back above the 113.33 level, further buying should be expected towards the 113.57 and 113.89 levels.
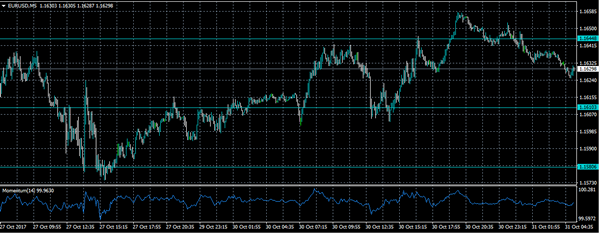
EURO Bearish While Trading Below 1.1644 Level
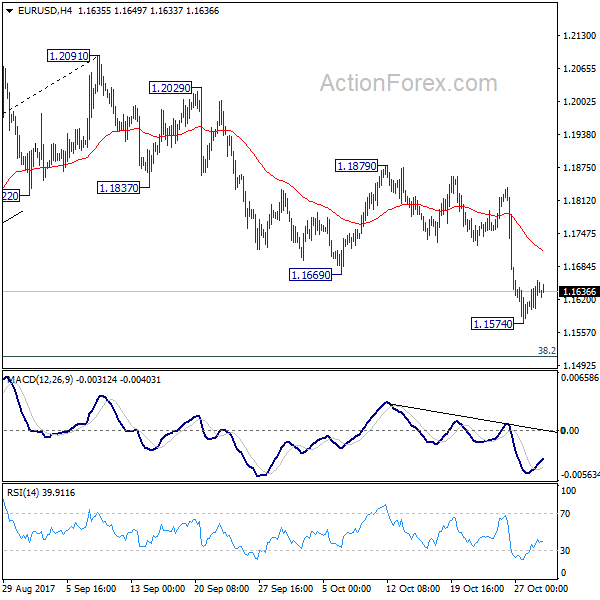
The euro continues to remain under selling pressure against the U.S dollar, despite rallying to 1.1658 during late Monday trading. The EURUSD pair currently trades around the 1.1630 level, as traders await a raft of high-impact economic data coming out from the eurozone today. During the European trading session, we see the release of key Eurozone Inflation, Gross Domestic Product and Unemployment figures for the month of October.
The EURUSD sellers retain intraday control of the pair while price-action trades below the 1.1644 technical level. Further declines while below this key level can be expected towards the 1.1610 and 1.1580 support zones.
Should intraday EURUSD move price-action above the 1.1644 level for a sustained period, further bullish advancement can be expected towards the 1.1680 and 1.1713 resistance points.
All Eyes On Eurozone GDP
Eurozone data will dominate headlines on Tuesday, culminating in a quarterly GDP report that is expected to reaffirm the region's healthy recovery.
The European Commission's statistical agency will release preliminary third-quarter GDP figures at 10:00 GMT. The report is expected to show quarterly growth of 0.5%, following a gain of 0.6% in April-June. In annualized terms, this should translate into a 2.4% growth pace.
At the same time, the European government will report on unemployment and consumer inflation. Joblessness in the 19-nation euro is forecast to fall to 9% in September from 9.1% the previous month.
Meanwhile, the consumer price index (CPI) is projected to fall to 1.4% annually in October, down from 1.5% the previous month.
Italy will also release its latest batch of inflation data on Tuesday, while Greece will report on retail sales for the month of August.
Earlier in the day, the Bank of Japan (BOJ) voted to keep monetary policy on hold in a decision that was widely expected by market participants. The BOJ has held its main interest rate at -0.1% since early 2016 in support of its growth and inflation targets. With Prime Minister Shinzo Abe winning re-election in convincing fashion, investors can expect Abenomics to continue well into the future.
USD/JPY
The USD/JPY touched a session low of 112.95 on Tuesday, but quickly recovered to settle around 113.14. The pair has enjoyed a solid uptrend over the past two weeks as the US dollar asserted its confidence on the global currency market. However, the pair has declined since Friday's three-month high above 114.00. The immediate support for the USD/JPY is likely situated around 112.90. On the opposite side of the ledger, immediate resistance is likely to be found around 114.00.
EUR/USD
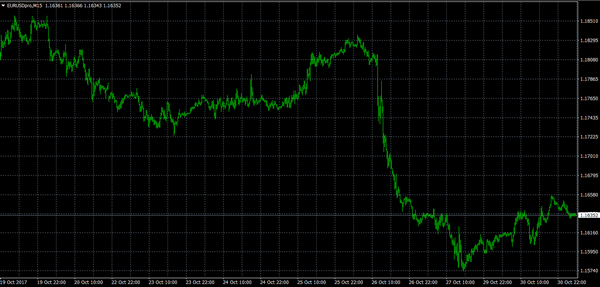
The euro has been under pressure since the European Central Bank (ECB) announced it would likely extend its record bond-buying program beyond September 2018. The decision triggered a 200-pip decline for the EUR/USD. As of Tuesday, the pair still hadn't recovered and was trading around 1.1636. The outlook remains tilted to the downside, as the euro bulls contend with a brewing crisis in Spain over Catalan independence. Levels to watch for the EUR/USD include 1.1685 on the upside and 1.1595 on the downside.
GOLD
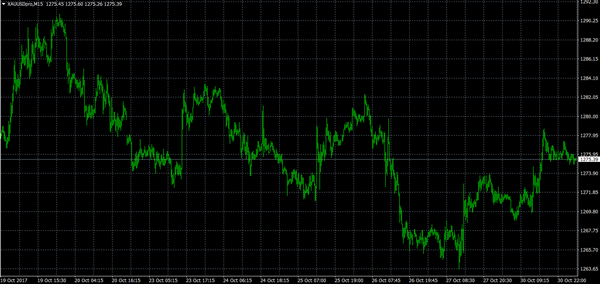
Precious metals have suffered a series of sharp declines over the past two weeks, with gold prices falling to their lowest level since July. Prices were little changed around $1,275 on Tuesday. The bulls are eyeing a close above $1,285 for a signal of upside momentum. On the flipside, the bears are keeping a close eye on $1,265. A dip below that level could expose bullion to heavier losses over the short term.
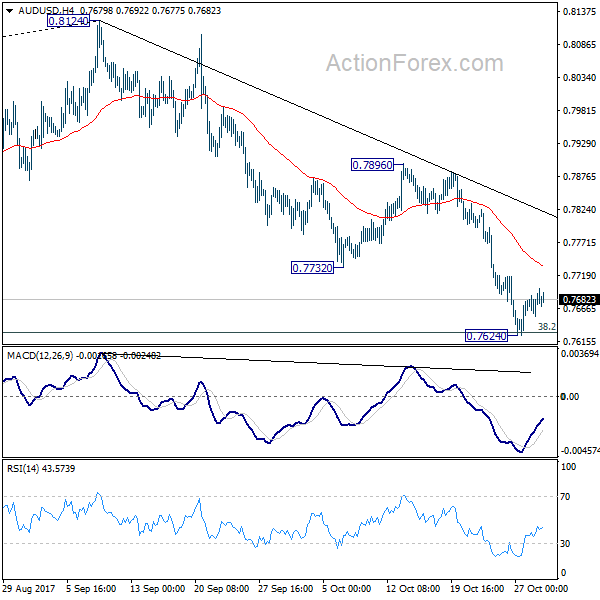
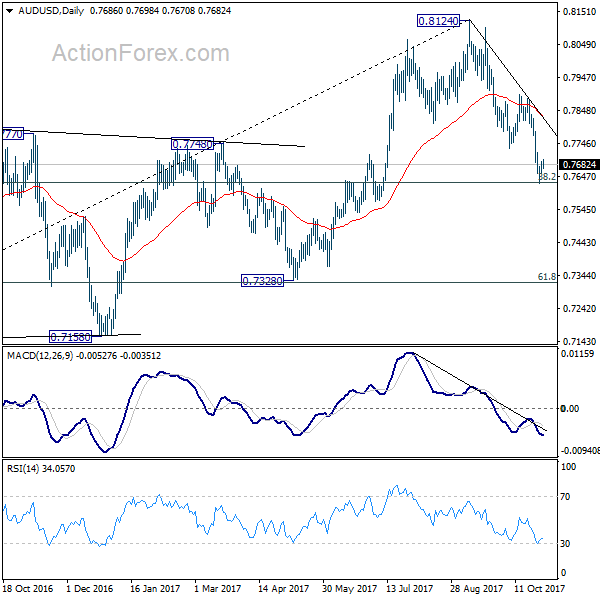
AUD/USD Daily Outlook
Daily Pivots: (S1) 0.7664; (P) 0.7678; (R1) 0.7700; More...
AUD/USD is staying in consolidation above 0.7624 temporary low. Intraday bias remains neutral for the moment. Upside of recovery should be limited well below 0.7896 resistance to bring decline resumption. Firm break of 0.7624 will resume whole decline from 0.8124 and target next key cluster level at 0.7322/8.
In the bigger picture, corrective rise from 0.6826 medium term bottom is likely completed at 0.8124, after hitting 55 month EMA (now at 0.8067). Decisive break of 0.7328 key cluster support (61.8% retracement 0.6826 to 0.8124 at 0.7322) will confirm. And in that case, long term down trend from 1.1079 (2011 high) will likely be resuming. Break of 0.6826 will target 61.8% projection of 1.1079 to 0.6826 from 0.8124 at 0.5496. This will now be the favored case as long as 0.7896 near term resistance holds.
Euro To Japanese Yen’s Long Term View
Key Highlights
- The Euro is in a solid uptrend from the 115.00 swing low against the Japanese Yen, but facing hurdles near 134.50.
- There was a break above a monster bearish trend line at 120.00 on the weekly chart of EUR/JPY.
- Recently, the Germany's consumer price index preliminary reading for Oct 2017 came in at 1.6% (YoY), less than the forecast of +1.7%.
- Today, the Euro Zone's Gross Domestic Product for Q3 2017 (Prelim) will be released, which is forecasted to increase 0.5% (QoQ).
EURJPY Technical Analysis
The Euro started a solid uptrend from the 115.00 swing low against the Japanese Yen. The EUR/JPY pair traded as high as 134.44 where it is faced a monster resistance.
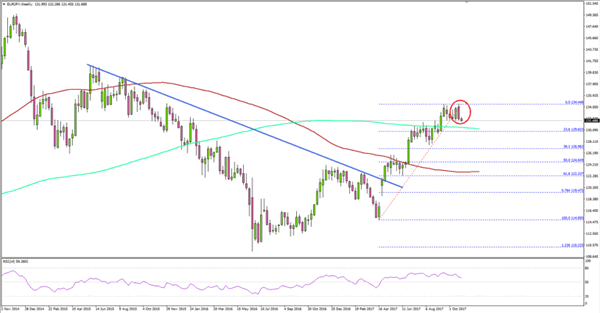
Looking at the weekly chart, there was a break above a monster bearish trend line at 120.00. The pair followed a crucial bullish path and settled above the 130.00 handle, the 100-week simple moving average (red) and the 200-week simple moving average (green).
However, the pair seems to be struggling near 134.50. The last weekly candle is a bearish candle, overlapping the last bullish candle. This is a strong bearish signal and suggesting a short-term top.
On the downside, an initial support is near 130.00 and the 23.6% Fib retracement level of the last wave from the 114.85 low to 134.44 high. The mentioned 130.00 support is important since it is near the 200-week SMA.
A weekly below 130.00 would ignite a larger correction towards 123.00, the 100-week SMA and the 50% Fib retracement level of the last wave from the 114.85 low to 134.44 high. On the upside, a break of the 134.50 level is required to negate the current bearish sentiment.
Germany's Consumer Price Index
Recently in the Euro Zone, the Germany consumer price index for Oct 2017 (Prelim) was released by the Statistisches Bundesamt Deutschland. The forecast was slated for a rise of 0.1% in Oct 2017 compared with the previous month.
The actual result was lower than the forecast, as there was no change in the CPI in Oct 2017. Looking at the yearly change, there was an increase of 1.6%, which was less than the forecast of +1.7% and also less than the last +1.8%.
The report added that:
In October 2017, the harmonised index of consumer prices for Germany, which is calculated for European purposes, is expected to increase by 1.5% year on year. Compared with September 2017, it is expected to be down by 0.1%.
The Euro pairs came under pressure after the release, and the EUR/JPY pair traded towards 131.50.
Economic Releases to Watch Today
Euro Zone CPI for Oct 2017 (Prelim) (YoY) – Forecast +1.4%, versus +1.5% previous.
Euro Zone Core CPI for Oct 2017 (Prelim) (YoY) – Forecast +1.2%, versus +1.3% previous.
Euro Zone Gross Domestic Product Q3 2017 (Prelim) (QoQ) – Forecast 0.5%, versus 0.6% previous.
Euro Zone Gross Domestic Product Q3 2017 (Prelim) (YoY) – Forecast 2.4%, versus 2.3% previous.
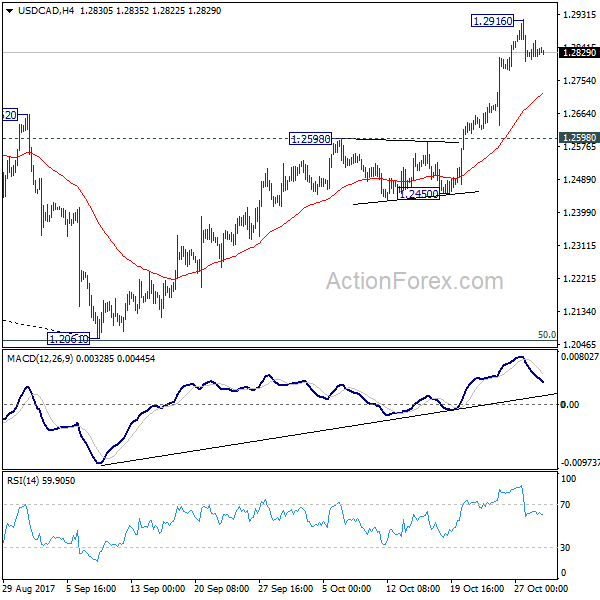
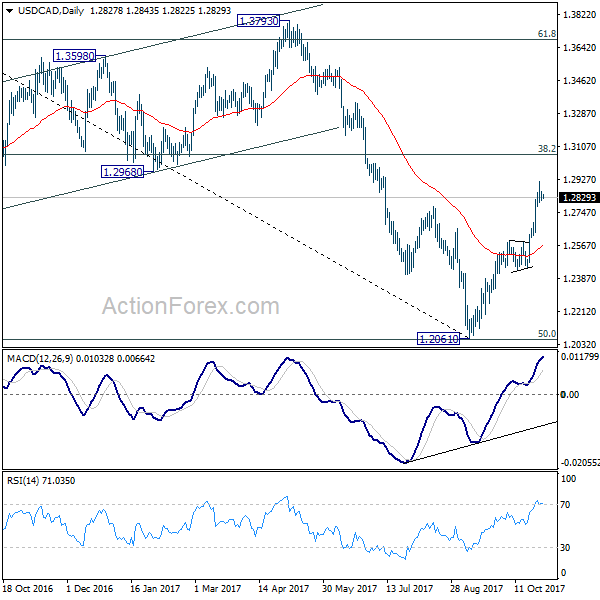
USD/CAD Daily Outlook
Daily Pivots: (S1) 1.2809; (P) 1.2835; (R1) 1.2858; More....
USD/CAD is staying in consolidation below 1.2916 temporary top and intraday bias remains neutral at this point. Downside of retreat should be contained above 1.2598 resistance turned support and bring rally resumption. Medium term trend in USD/CAD should have reversed. Break of 1.2916 will extend the rise from 1.2061 to 38.2% retracement of 1.4689 to 1.2061 at 1.3065.
In the bigger picture, USD/CAD should have defended 50% retracement of 0.9406 (2011 low) to 1.4689 (2016 high) at 1.2048. And with 1.2048 intact, we'd favor the case that fall from 1.4689 is a correction. Rise from 1.2061 medium term bottom should now target 38.2% retracement of 1.4689 to 1.2061 at 1.3065. Firm break there will target 1.3793 key resistance next (61.8% retracement at 1.3685). We'll now hold on to this bullish view as long as 1.2450 support holds.
Forex: Another Political Headache For Trump
USD gave up some of its recent gains on news that investigators had charged President Trump's former campaign manager regarding the investigation of Russian interference in last year's US Presidential Campaign. Trump's former campaign manager Paul Manafort and another aide, Rick Gates, were both charged with money laundering on Monday. It was also announced on Monday that Former Trump advisor, George Papadopoulos, pleaded guilty in early October to lying to the FBI. The indictment of Manafort & Gates includes accusations of conspiracy against the United States, failure to report foreign bank accounts to the US government and conspiracy to launder money, a count that carries a 20-year maximum prison sentence. U.S. Justice Department Special Counsel Robert Mueller's 5-month investigation into alleged Russian efforts to tilt the election in Trump's favor and into potential collusion by Trump aides has Trump claiming the probe 'a witch hunt' and, as we have come to expect from Trump, he also commented on Twitter: 'Sorry, but this is years ago, before Paul Manafort was part of the Trump campaign. But why aren't Crooked Hillary & the Dems the focus?????'. Once again political turmoil is haunting Trump at a critical time for his administration, as they look to pass a tax reform bill and await Trump's selection of the next Fed Chair.
It appears that Federal Reserve Governor Jerome Powell is the first choice of President Trump to be the next Chair of the Federal Reserve, according to an unnamed senior official. Powell is a Republican centrist who is likely to continue the Fed's strategy of gradual interest rate hikes but may also be open to easing some regulations on banks. Powell, 64, has consistently backed Janet Yellen's plan to hike rates slowly to head off a potential surge in inflation without disrupting an economic recovery that remains in a fragile state. An unnamed senior administration commented that 'Trump hasn't made a final decision and could change his mind' and also commented that 'an announcement is scheduled for Thursday'.
EURUSD is trading around 1.1635 in early Tuesday trading.
USDJPY is relatively flat, trading around 113.12.
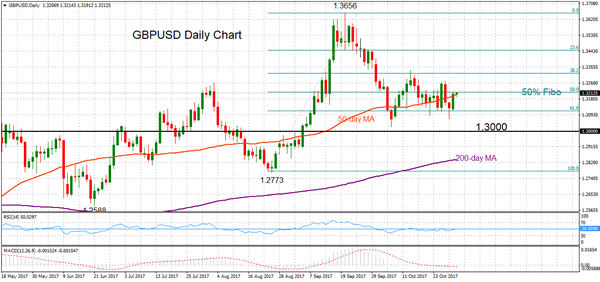
GBPUSD currently trades around 1.3210.
Gold is little changed in early trading at around $1,276.50.
WTI is 0.15 lower at around $54.12 in early trading.
Major data releases for today:
At 06:30 GMT, Bank of Japan Governor Kuroda will give a press conference to the markets regarding monetary policy. He will comment on the factors that affected the most recent interest rate decision, the overall economic outlook, inflation, and clues regarding future monetary policy in Japan.
At 10:00 GMT, Eurostat will release a host of Eurozone Data: GDP (YoY & QoQ) for Q3, CPI & CPI Core (YoY) for October and the Unemployment Rate for September. Unemployment is forecast to have dropped to 9.0% from August's 9.1%. CPI-Core is expected to come in at 1.2% slightly lower than the previous release of 1.3% with CPI forecast at 1.4% from 1.5%. Annualized GDP is forecast to come in slightly higher at 2.4% from the previous release of 2.3%. The quarterly GDP is expected to come in at 0.5%, slightly lower than the previous release of 0.6%. The markets will be looking for any significant deviation from the forecasts which will likely cause EUR volatility.
At 19:30 GMT, Bank of Canada Governor Poloz is scheduled to appear before the House of Commons Standing Committee on Finance in Ottawa. He will be accompanied by Senior Deputy Governor Carolyn A. Wilkins.
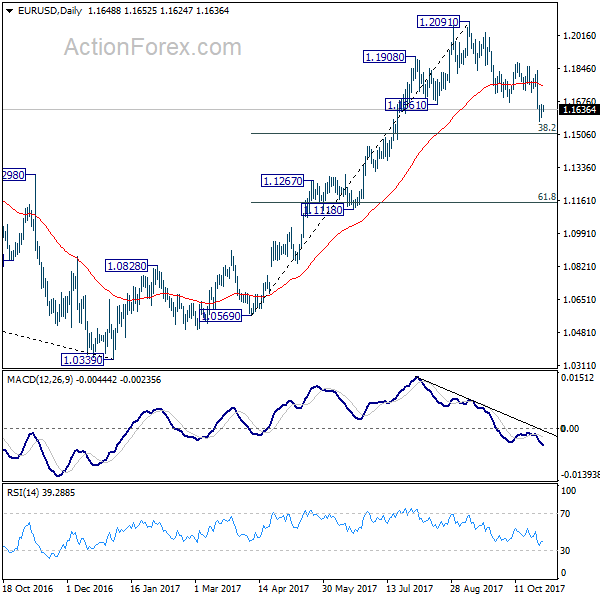
EUR/USD Daily Outlook
Daily Pivots: (S1) 1.1610; (P) 1.1634 (R1) 1.1675; More...
A temporary low is in place at 1.1574 and intraday bias in EUR/USD is turned neutral first. Some consolidations could be seen. But still, break of 1.1879 resistance is needed to confirm completion of the decline from 1.2091. Otherwise, near term outlook will stay bearish. Below 1.1574 will target 38.2% retracement of 1.0569 to 1.2091 at 1.1510.
In the bigger picture, rise from 1.0339 medium term bottom is seen as a corrective move for the moment. Therefore, in case of another rally, we'd be cautious on 38.2% retracement of 1.6039 (2008 high) to 1.0339 (2017 low) at 1.2516 to limit upside and bring reversal. Meanwhile, sustained trading below 55 week EMA will suggest that such medium term rebound is completed and could then bring retest of 1.0339 low.
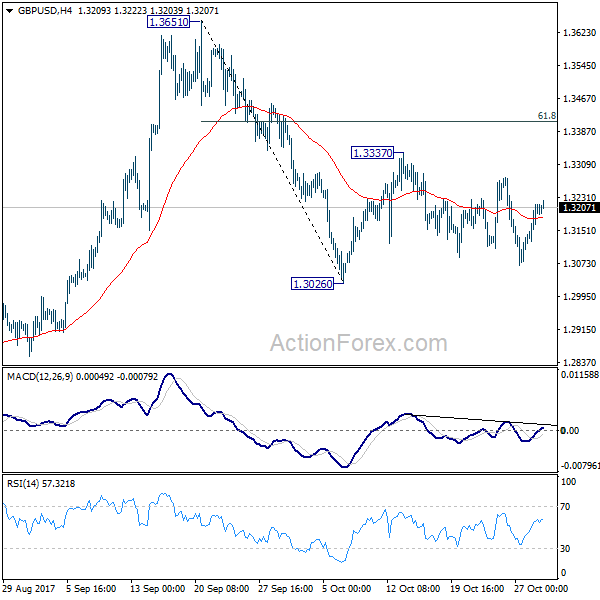
GBP/USD Daily Outlook
Daily Pivots: (S1) 1.3140; (P) 1.3177; (R1) 1.3243; More....
No change in GBP/USD's outlook as it's still bounded in range of 1.3026/3337. Intraday bias remains neutral for the moment. On the downside, firm break of 1.3026 support will resume the decline from 1.3651 and target 1.2773 key support level. This will also revive the case of medium term reversal. On the upside, in case of another rally, upside should be limited by 61.8% retracement of 1.3651 to 1.3026 at 1.3412 to bring fall resumption finally.
In the bigger picture, while the medium term rebound from 1.1946 was strong, GBP/USD hit strong resistance from the long term falling trend line. Outlook is turned a bit mixed and we'll stay neutral first. On the downside, decisive break of 1.2773 key support will argue that rebound from 1.1946 has completed. The corrective structure of rise from 1.1946 to 1.3651 will in turn suggest that long term down trend is now completed. Break of 1.1946 low should then be seen. On the upside, break of 1.3835 support turned resistance will revive the case of trend reversal and target 38.2% retracement of 2.1161 (2007 high) to 1.1946 (2016 low) at 1.5466 .