Sample Category Title
USD/JPY Mid-Day Outlook
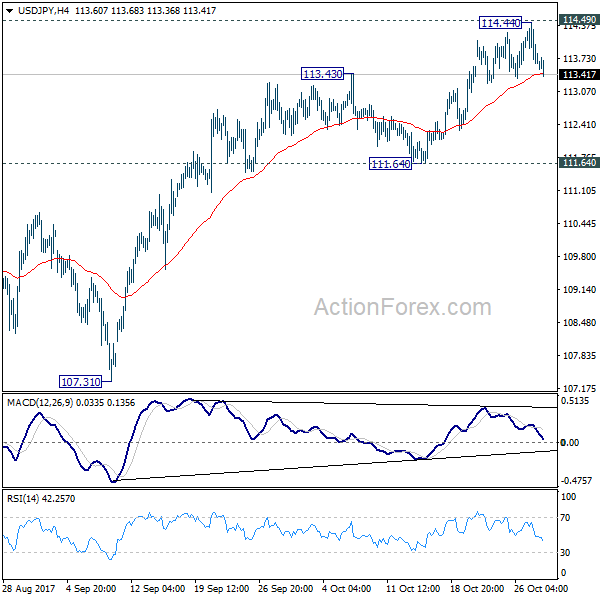
Daily Pivots: (S1) 113.39; (P) 113.91; (R1) 114.20; More...
Intraday bias in USD/JPY remains neutral for the moment. Pull back from 114.44 could extend lower. But after all, outlook will stays cautiously bullish as long as 111.64 support holds. Decisive break of 114.49 key resistance will confirm that correction pattern from 118.65 has completed at 107.31 already. And USD/JPY should then target a test on 118.65.
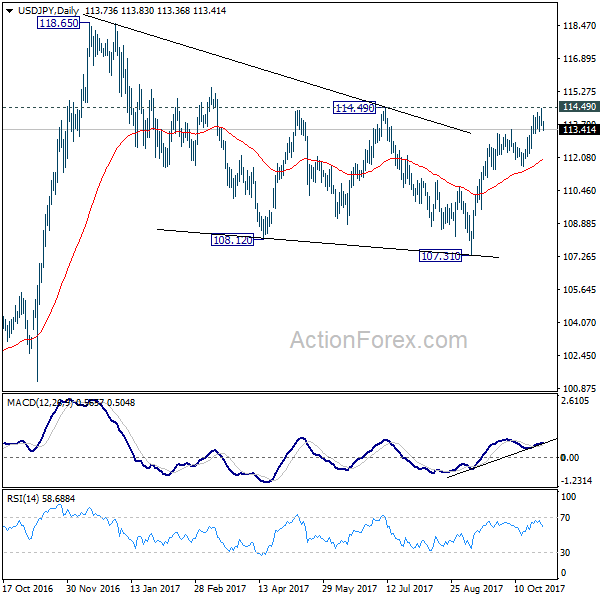
In the bigger picture, medium term rise from 98.97 (2016 low) is not completed yet. It should resume after corrective fall from 118.65 completes. Break of 114.49 resistance will likely resume the rise to 61.8% projection of 98.97 to 118.65 from 107.31 at 119.47 first. Firm break there will pave the way to 100% projection at 126.99. This will be the key level to decide whether long term up trend is resuming.
USD/CHF Mid-Day Outlook
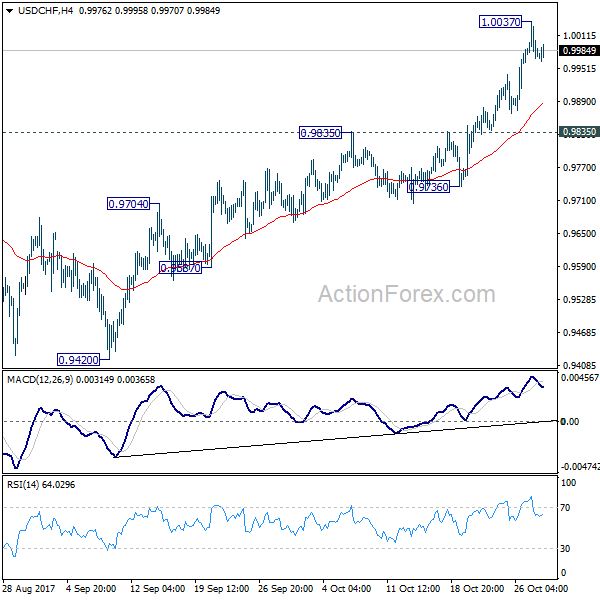
Daily Pivots: (S1) 0.9942; (P) 0.9989; (R1) 1.0019; More....
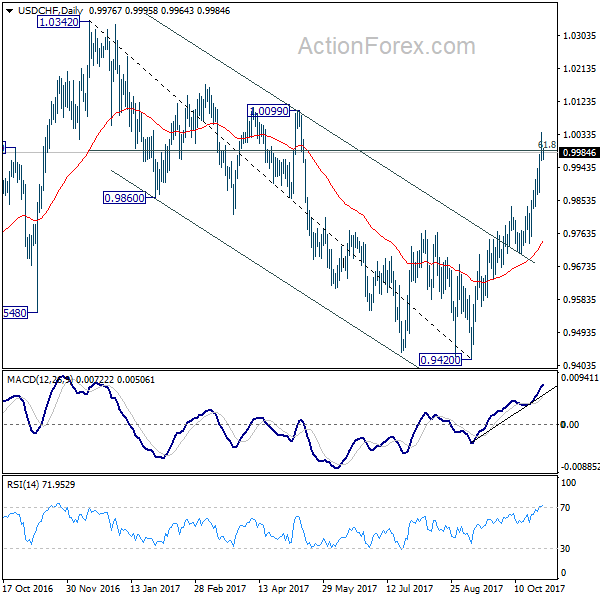
Intraday bias in USD/CHF remains neutral for consolidation below 1.0037 temporary top. Downside of retreat should be contained above 0.9835 resistance turned support and bring rally resumption . Since 61.8% retracement of 1.0342 to 0.9420 at 0.9990 is already met, break of 1.0037 will turn bias to the upside for 1.0342 key resistance next.
In the bigger picture, current development suggests that USD/CHF has defended 0.9443 (2016 low) key support level again. Rise from 0.9420 could is a medium term up move and should target a test on 1.0342 high. This represents the upper end of a long term range that started back in 2015. On the downside, break of 0.9736 support is now needed to indicate completion of the rise from 0.9420. Otherwise, further rally will remain in favor in medium term.
GBP/USD Mid-Day Outlook
Daily Pivots: (S1) 1.3072; (P) 1.3116; (R1) 1.3164; More....
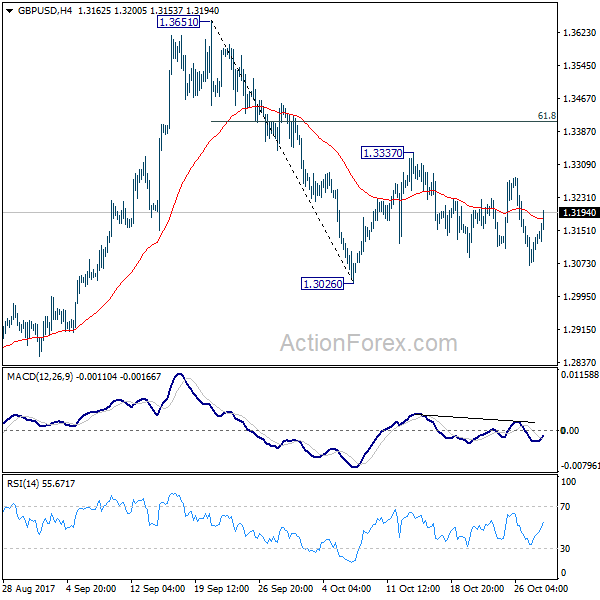
GBP/USD is still staying in range of 1.3026/3337 and intraday bias remains neutral. On the downside, firm break of 1.3026 support will resume the decline from 1.3651 and target 1.2773 key support level. This will also revive the case of medium term reversal. On the upside, in case of another rally, upside should be limited by 61.8% retracement of 1.3651 to 1.3026 at 1.3412 to bring fall resumption finally.
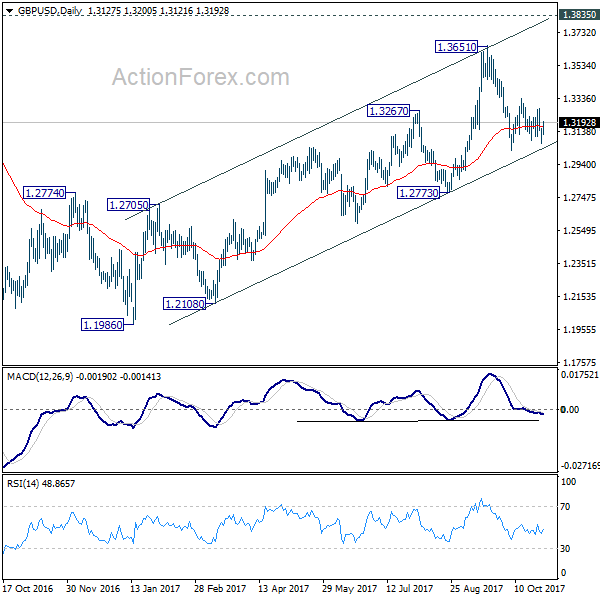
In the bigger picture, while the medium term rebound from 1.1946 was strong, GBP/USD hit strong resistance from the long term falling trend line. Outlook is turned a bit mixed and we'll stay neutral first. On the downside, decisive break of 1.2773 key support will argue that rebound from 1.1946 has completed. The corrective structure of rise from 1.1946 to 1.3651 will in turn suggest that long term down trend is now completed. Break of 1.1946 low should then be seen. On the upside, break of 1.3835 support turned resistance will revive the case of trend reversal and target 38.2% retracement of 2.1161 (2007 high) to 1.1946 (2016 low) at 1.5466 .
EUR/USD Mid-Day Outlook
Daily Pivots: (S1) 1.1568; (P) 1.1612 (R1) 1.1651; More...
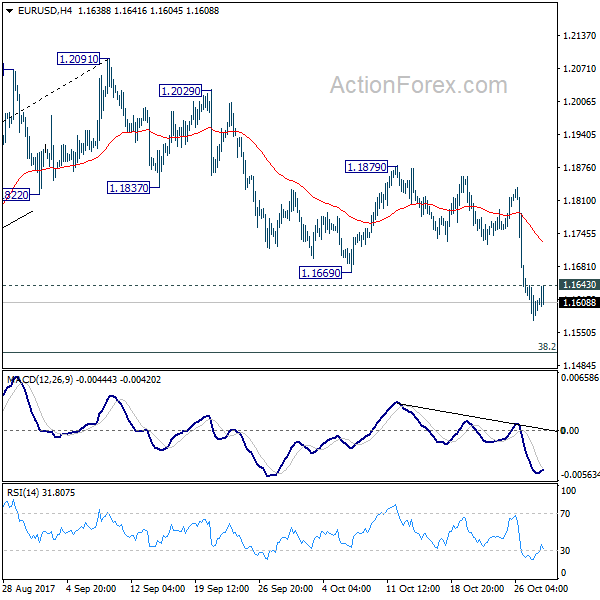
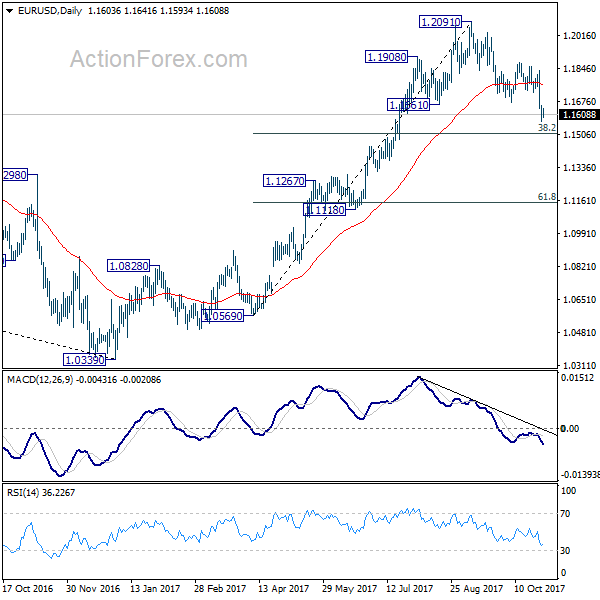
With 1.1643 minor resistance intact, intraday bias in EUR/USD remains on the downside for 38.2% retracement of 1.0569 to 1.2091 at 1.1510. We'd expect strong support from there, at least on first attempt, to bring rebound. Above 1.1643 minor resistance will turn bias neutral first. But break of 1.1879 is needed to confirm completion of the decline. Otherwise, near term outlook remains bearish. Meanwhile, sustained break will of 1.1510 will carry larger bearish implication and target 55 week EMA (now at 1.1346).
In the bigger picture, rise from 1.0339 medium term bottom is seen as a corrective move for the moment. Therefore, in case of another rally, we'd be cautious on 38.2% retracement of 1.6039 (2008 high) to 1.0339 (2017 low) at 1.2516 to limit upside and bring reversal. Meanwhile, sustained trading below 55 week EMA will suggest that such medium term rebound is completed and could then bring retest of 1.0339 low.
Dollar Mixed as Trumps’ Ex-Campaign Manager Charged in Russian Probe, Euro Lower after German CPI Miss
Dollar is trading mixed in early US session despite positive economic data. Personal income rose 0.4% in September, up from 0.2% and met consensus. Spending jumped solidly by 1.0%, above expectation of 0.9%. Headline PCE accelerated to 1.6% yoy while core PCE was unchanged at 1.3% yoy. However, the greenback is weighed down, especially against Yen, by news that Special Prosecutor Robert Mueller launched the first charge on Russian probe. Paul Manafort, a former campaign manager for President Donald Trump, was indicted on 12 counts including "conspiracy against the United States."
German CPI missed, but Eurozone confidence solid
Euro trades lower after disappointing German inflation data. Healing CPI rose 0.0% mom in October. Annually, CPI slowed to 1.6% yoy, down from 1.8% yoy and missed expectation of 1.7% yoy. Also from Germany, retail sales rose 0.5% mom in September. Eurozone business climate rose to 1.44 in October up from 1.34, above expectation of 1.40. That's the highest reading since March 2011. Economic confidence rose to 114.0, up from 113.1, above expectation of 113.3. The 114.0 economic confidence was the highest level since January 2001. Industrial confidence improved to 7.9, up from 6.7, above expectation of 7.1. Services confidence rose to 16.2, up from 15.4, above expectation of 15.0. Consumer confidence was finalized at -1.
In Spain, the Madrid government is set to take control of Catalan institutions today. If Catalonia regional President Carles Puigdemont refuses to step down, he could face possible arrest and prosecution on charges of rebellion. And the maximum sentence for the charge is 30 years. Spanish Foreign Minister Alfonso Dastis said he hoped that the upcoming elections would help to "restore legal governance and rule of law in Catalonia". And after that, "Catalonia will again be the same society it was before: open and integrated."
Euro has been under much selling pressure after ECB announced to half monthly asset purchase to EUR 30b and extend the program for another nine months. The common currency will need to look into GDP and CPI data to be released tomorrow for some support.
Sterling firm ahead of BoE hike
Sterling is trading generally firm today. Mortgage approvals dropped to 66.2k in September. M4 money supply dropped -0.2% mom in September. The main focus is BoE Super Thursday. BoE is widely expected to raise the Bank Rate by 25bps to 0.50%, first hike in a decade. In our view, this will be a one-off as the Bank Rate will be brought back to pre-Brexit referendum level. The impact of the voting decision is largely absorbed by the monetary stimulus as well as depreciation in Sterling. BoE policy makers would be hesitate to make any more move before getting a clearer picture on Brexit. With that in mind, the vote split of the decision is the first key point to watch. The tighter the decision, the more unlikely for another hike in near term. In addition, BoE will release the quarterly inflation report. Revision in inflation projection there will tell us how policymakers general feel about the recent surge in inflation.
Swiss KOF points to bright outlook
Swiss KOF leading indicator rose to 109.1 in October, up from 105.8 and beat expectation of 106.5. That's also the highest level since September 2010. KOF noted in the release that "Autumn is welcoming the Swiss economy with a tailwind." Economic outlook is bright "mainly driven by the banking and manufacturing indicators." "The prospects for exports and the accommodation and food service activities are also somewhat better than before. " But "indicators for domestic consumption are stagnating:" and "indicators for the further development of the construction sector have declined somewhat."
BoJ may downgrade inflation forecast tomorrow
BoJ rate decision will be a focus in the upcoming Asian session. It's widely expected to keep monetary policies unchanged. That is, the short-term rate will be held at -0.1%. And the central bank will continue target to keep 10 year JGB yield at 0% under the Yield Curve Control framework. The main question is whether BoJ would revise down inflation projections again. Release from Japan today, retail sales rose 2.2% yoy in September, below expectation of 2.3% yoy.
EUR/USD Mid-Day Outlook
Daily Pivots: (S1) 1.1568; (P) 1.1612 (R1) 1.1651; More...
With 1.1643 minor resistance intact, intraday bias in EUR/USD remains on the downside for 38.2% retracement of 1.0569 to 1.2091 at 1.1510. We'd expect strong support from there, at least on first attempt, to bring rebound. Above 1.1643 minor resistance will turn bias neutral first. But break of 1.1879 is needed to confirm completion of the decline. Otherwise, near term outlook remains bearish. Meanwhile, sustained break will of 1.1510 will carry larger bearish implication and target 55 week EMA (now at 1.1346).
In the bigger picture, rise from 1.0339 medium term bottom is seen as a corrective move for the moment. Therefore, in case of another rally, we'd be cautious on 38.2% retracement of 1.6039 (2008 high) to 1.0339 (2017 low) at 1.2516 to limit upside and bring reversal. Meanwhile, sustained trading below 55 week EMA will suggest that such medium term rebound is completed and could then bring retest of 1.0339 low.
Economic Indicators Update
| GMT | Ccy | Events | Actual | Forecast | Previous | Revised |
|---|---|---|---|---|---|---|
| 23:50 | JPY | Retail Trade Y/Y Sep | 2.20% | 2.30% | 1.70% | 1.80% |
| 07:00 | EUR | German Retail Sales M/M Sep | 0.50% | 0.50% | -0.40% | -0.20% |
| 08:00 | CHF | KOF Leading Indicator Oct | 109.1 | 106.5 | 105.8 | |
| 09:30 | GBP | Mortgage Approvals Sep | 66.2K | 66.0K | 66.6K | 67.2K |
| 09:30 | GBP | M4 Money Supply M/M Sep | -0.20% | 0.70% | 0.90% | 1.10% |
| 10:00 | EUR | Eurozone Economic Confidence Oct | 114 | 113.3 | 113 | 113.1 |
| 10:00 | EUR | Eurozone Business Climate Indicator Oct | 1.44 | 1.4 | 1.34 | |
| 10:00 | EUR | Eurozone Industrial Confidence Oct | 7.9 | 7.1 | 6.6 | 6.7 |
| 10:00 | EUR | Eurozone Services Confidence Oct | 16.2 | 15 | 15.3 | 15.4 |
| 10:00 | EUR | Eurozone Consumer Confidence Oct F | -1 | -1 | -1 | |
| 12:30 | USD | Personal Income Sep | 0.40% | 0.40% | 0.20% | |
| 12:30 | USD | Personal Spending Sep | 1.00% | 0.90% | 0.10% | |
| 12:30 | USD | PCE Deflator M/M Sep | 0.40% | 0.40% | 0.20% | |
| 12:30 | USD | PCE Deflator Y/Y Sep | 1.60% | 1.60% | 1.40% | |
| 12:30 | USD | PCE Core M/M Sep | 0.10% | 0.10% | 0.10% | |
| 12:30 | USD | PCE Core Y/Y Sep | 1.30% | 1.30% | 1.30% | |
| 13:00 | EUR | German CPI M/M Oct P | 0.00% | 0.10% | 0.10% | |
| 13:00 | EUR | German CPI Y/Y Oct P | 1.60% | 1.70% | 1.80% |
U.S. Consumer Spending Bounces Back from Hurricanes in September, But Underlying Inflation Still Soft
Personal income rose 0.4% in September, on par with consensus. Controlling for inflation and removing taxes, real personal income was flat on the month.
Personal consumption rose by 1.0% in nominal terms, a hair above market expectations for 0.9%. In real terms, spending was up 0.6%, rebounding strongly from the hurricane-related pullback in August.
By component, real spending on durable goods led the way, rising by 3.5% (following a 1.4% decline in August). Spending on non-durable goods and services were both up a strong 0.3%.
Prices rose 0.4% in September, due mainly to energy, which rose 6.8% (non-annualized). As a result, inflation accelerated to 1.6% y/y from 1.4% in August. Core PCE inflation, on the other hand, remained steady at 1.3%.
Key Implications
September's strong spending growth makes up for August's weakness, and also implies a strong handoff for growth in the fourth quarter. Perhaps the only source of caution is the weakness in real income growth, but this too was affected by hurricanes and is likely to recover as the job market returns to normal in Q4.
Outside of the volatility in energy prices, inflation remains soft. Alas, the debate between monetary policymakers who point to strong economic activity and those who point to weak price growth will remain. This means that even as the Fed continues to raise its key lending rate (we anticipate the next hike this December), the process will continue to be at the measured pace we have seen so far.
CAC Unchanged Ahead of French, Eurozone Inflation Reports
The CAC index has paused on Monday, after recording strong gains last week. Currently, the CAC is trading at 5,494.50, up 0.01% on the day. On the release front, there are no eurozone or French events on the schedule. On Tuesday, France releases GDP, Consumer Spending, and Preliminary CPI. The eurozone will publish CPI Flash Estimate and Preliminary Flash GDP.
The CAC gained 2.1% last week, as the index continues to rack up gains. On Friday, the CAC punched above the 5500 level for the first time since January 2008. European stock markets were in green territory on Thursday, as the ECB chopped its asset purchase program (QE) from EUR 60 billion to 30 billion/mth. It was a case of "smaller but longer" for the QE program. The ECB extended the program, which was scheduled to terminate in December, to September 2018. At the same time, ECB President Mario Draghi's announced that QE would remain open-ended. There were expectations that the ECB would announce a date when the program would end. ECB President Mario Draghi has given himself plenty of wiggle room, as he can simply extend QE beyond next September. As for monetary policy, the ECB maintained interest rates at a flat 0.00%, and Draghi provided no hints about the timing of future rate hikes. The ECB appears in no rush to tinker with rate policy, and we're unlikely to see any rate increases until QE is completed.
European stock markets have been muted in their response to the crisis in Spain, but investors continue to monitor events in the eurozone's fourth largest economy. On Friday, the central government pressed the trigger and imposed direct rule on Catalonia. Just prior this move, the Catalonian government pre-empted Madrid and declared independence. There have been huge demonstrations in Barcelona, both in favor and against secession from Spain. Madrid and Barcelona have been a collision course for weeks, so what happens now? The answer may lie with Catalonia's 200,000 civil servants, who must decide whether to follow orders from Madrid, or join a civil disobedience campaign which is being organized by the Catalan government. So far, the Spanish government has taken a hard line against the independence movement, dismissing Catalan President Carles Puigdemont and his government, and threatening to file rebellion charges against Puigdemont. Prime Minister Mariano Rajoy has called new elections in Catalonia for December 21, but the situation remains volatile.
GBPUSD Triggers Recovery Higher With Eyes On Key Resistance
GBPUSD: The pair was seen triggering a recovery during early trading today following its price rejection on Friday. This leaves the pair targeting more strength in the days ahead possibly towards the 1.3278 zone. On the downside, support lies at the 1.3100 level where a break will turn attention to the 1.3050 level. Further down, support lies at the 1.3000 level. Below here will set the stage for more weakness towards the 1.2950 level. Conversely, resistance stands at the 1.3200 levels with a turn above here allowing more strength to build up towards the 1.3250 level. Further out, resistance resides at the 1.3300 level followed by the 1.3350 level. On the whole, GBPUSD continues to face further upside pressure on recovery.
GBPUSD Buying Set to Increase Above 1.3201
The British pound has moved sharply higher against the U.S dollar during the European trading session, hitting 1.3188, as investors start to price-in a rate hike from the Bank of England this week. The GBPUSD pair currently trades around the price-highs of the day, as the BOE prepare to hike UK interest rates for the first time in over a decade. During the upcoming U.S trading session, we see the release of the Federal Reserve's preferred measure of monthly U.S inflation data, CORE PCE.
Buying in the GBPUSD pair is set to increase once price-action breaks-above the 1.3201 technical level. Further bullish advancement towards the 1.3268 remains likely. Extended GBPUSD resistance is located at 1.3300 and 1.3360.
Should the GBPUSD fail to move above the 1.3201 level in the upcoming trading sessions, sellers will likely push price-action back towards the 1.3157 level. Extended intraday support is located at 1.3130 and 1.3116.
USDJPY Bearish Below 113.89
The U.S dollar continues to trade on the backfoot against the Japanese Yen, with price-action so far finding interim daily support around the 113.50 level. Intraday weakness in the U.S dollar index, due to U.S political uncertainty, is currently supportive of selling in the USDJPY pair. Investors await the upcoming release of CORE PCE data from the United States, and the Bank of Japan's monetary policy decision in the early hours of Tuesday morning.
The USDJPY pair remains intraday bearish while trading below the key 113.89 technical level. Further losses are increasingly likely while trading below the 113.89 level, with sellers targeting the 113.33 and 112.90 downside levels.
Should price-action trade above the 113.90 level for an extended period, further intraday USDJPY buying towards the 114.24 and 114.50 technical levels should be expected.